Some of our favorite Visium spatial transcriptomics publications from 2023

*Impact at a glance: This blog highlights a year of high-impact Visium Spatial studies that enabled groundbreaking advancements in cancer research, immunology, neuroscience, and developmental biology. Find quick recaps of why these papers were innovative and direct links to the articles for further reading.*
From identifying a previously undescribed T-cell state in cancer, to defining the genes involved in healthy palate development, our 2023 publication picks cover the most innovative and interesting applications of the Visium Spatial platform.
And they capture a recurring theme: spatial discovery powered by unbiased insights.
With the ability to spatially resolve the whole transcriptome across a complete tissue section, Visium gives researchers an unbiased view of the biology of their samples. This can reveal insights that researchers weren’t looking for; generate hypotheses that can be further tested and validated; and multiply the discovery potential in every sample.
Keep reading to explore some of our favorite spatial transcriptomics publications of 2023. Or skip ahead to specific publication highlights:
- Novel T-cell state driving immunotherapy resistance
- Previously uncharacterized genes in palate development
- The role of lipid metabolism in brain injury
- The CD4+ T-cell origin story
- Discovering transcript diversity with spatial isoform sequencing
- More Visium papers and blogs!
Enter a new era of high-resolution spatial discovery with Visium HD, enabling whole transcriptome spatial analysis at single cell scale with continuous tissue coverage. See your tissue in HD →
Novel T-cell state confirmed across cancer types
In their May 2023 Nature Medicine publication (1), researchers from the University of Texas MD Anderson Cancer Center established the most detailed picture of heterogeneous T cells in the tumor microenvironment (TME) to date. Their cell atlas included 308,048 single T-cell transcriptomes from 16 cancer types, taken from 375 human patient samples. This revealed 32 distinct T-cell states, including a previously undescribed T-cell stress response state (TSTR) associated with increased expression of heat shock genes HSPA1A/HSPA1B.
To further explore the identity and function of this T-cell state, and map spatial relationships to other cell types in tissue, the team used Visium spatial transcriptomics on 33 FFPE tissue sections from six cancer types—melanoma, lung adenocarcinoma, breast cancer, cutaneous squamous cell carcinoma, clear cell renal cell carcinoma, and gastric adenocarcinoma. They discovered TSTR cells localized mostly within lymphocyte aggregates, potential tertiary lymphoid structures in tumor beds, or surrounding tumor edges.
Leveraging correlative clinical features from patient cohorts, the researchers observed that TSTR cells increased after immunotherapy treatment and were at higher levels in non-responders, suggesting they are less effective at fighting cancer. These insights, paired with the spatial localization of TSTR cells to lymphocyte-rich regions of the TME, led the researchers to hypothesize that the novel T-cell state may have crosstalk with colocalized immune cells and, therefore, influence immunotherapy resistance.
Unreported genes discovered in the fusing palate transcriptome
According to the CDC, 1 in every 1,600 babies is born with cleft palate in the United States (2). Cleft palate is a developmental defect that occurs when the tissue that makes up the roof of the mouth does not join together completely during pregnancy (2), making it all the more important to understand the cellular and molecular mechanisms underlying healthy palate development.
In their Nature Communications publication (3), a team led by researchers from the Eunice Kennedy Shriver National Institute of Child Health and Human Development (NICHD) at the NIH sought to map the active genes driving normal palate fusion in an embryonic mouse model. Using Visium analysis on FFPE coronal mid-palatal sections taken from the transitional stages where palate shelves make contact (E14.5) and the palate fuses (E15.5), the team built a spatially resolved picture of the differentially expressed genes between the two tissue stages.
“With an eye toward discovery, we turned our attention to the most highly differentially expressed genes identified from the spRNA-seq analysis to identify potential markers of palatal fusion across space and time.” —Piña et al. (3)
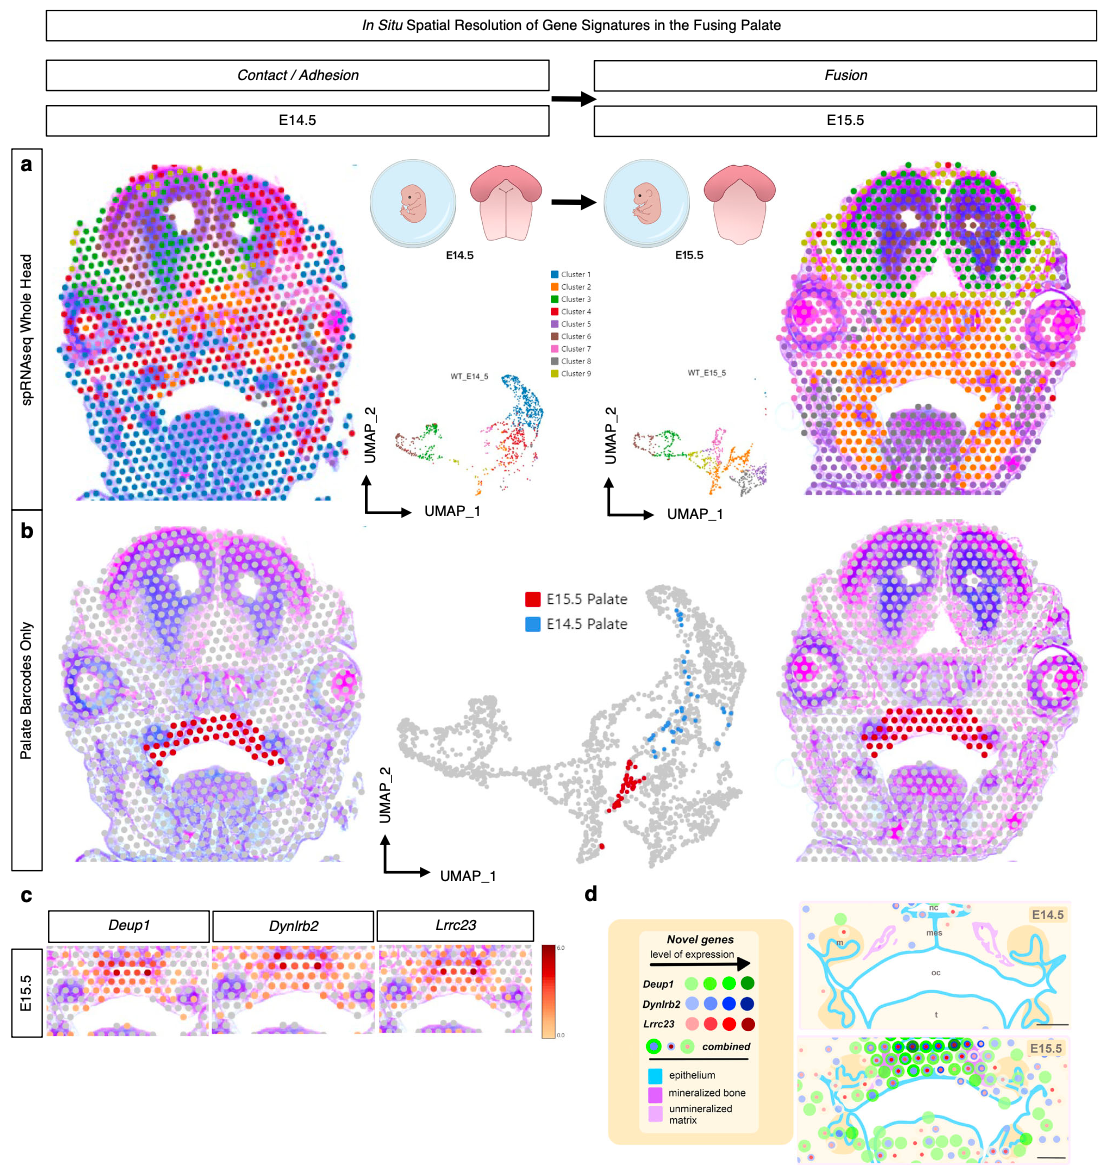
Their unbiased, whole transcriptome Visium experiment revealed three previously unreported genes in palate fusion—Deup1, Dynlrb2, and Lrrc23, all involved in cilia function—which were localized in the palate ciliated nasal epithelium at E15.5. These findings suggest nasal epithelium cells may play a special role in facilitating cell migration upon and during fusion of the palate shelves.
Detailed insights, such as these, into the temporal and spatial cellular dynamics of palate fusion represent an important step toward, in the author’s words, “new preclinical models of palate ossification and submucosal clefts, paving the way toward potential therapies to correct cleft palate defects in humans.”
Revealing transcriptomic and metabolic changes in the injured human brain
Brain injuries are scary and, in many cases, life-altering. Studies recorded through the Traumatic Brain Injury Model Systems National Database showed that, for a US population 16 years and older that received inpatient rehabilitation services after moderate to severe traumatic brain injury (TBI), 26% saw positive improvement at the five-year mark after injury—however, 30% were worse, while 22% had died (4).
Researchers from the Shanghai Pudong New Area People’s Hospital wanted to explore the underlying biological changes that might be associated with varying therapeutic outcomes for people with moderate to severe TBI. They were specifically looking to understand the relationship between transcriptomic and metabolic changes in injured brain tissue. Metabolic readouts—molecules such as lipids or proteins left behind from cellular processes—can provide a snapshot of the physiology of cells or an organ, and potentially reveal novel biomarkers or functional insights when paired with transcriptomic data.
The team analyzed surgical brain samples from six people with moderate or severe TBIs using Visium Spatial Gene Expression and airflow-assisted desorption electrospray ionization mass spectrometry imaging (AFADESI-MSI)—a spatial metabolomics method. Combining transcriptomic and metabolic data revealed upregulated expression of metabolite-associated genes, SEPTIN4 and S1PR5, within the site of injury in severe TBI groups. Specifically, SEPTIN4, which is typically involved in cell death, localized to regions with neuronal loss; and S1PR5, which is involved in lipid metabolism processes, localized to tissue regions with high abundance of a lipid marker (5).
These findings suggest increased lipid peroxidation impairs synapse formation and neuron development. The data also provides a distinguishing molecular pattern between moderate and severe TBI, and adds to our understanding of why patients with severe TBI tend to have poorer neurological outcomes and responses to comprehensive therapies.
Revealing the drivers of CD4+ T-cell lineage commitment
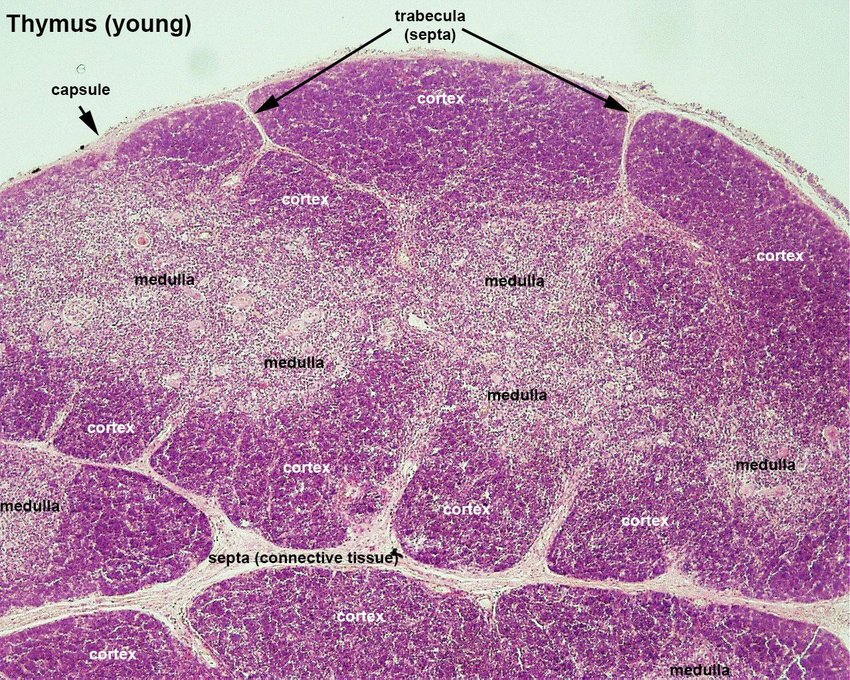
While we know that CD4+ T cells are important—they differentiate into diverse T-cell subtypes that play a critical role in activating and regulating immune responses to pathogens (6,7)—researchers from the NIH and University of Pennsylvania Medical School wanted to fill the gaps in our understanding of the factors that control commitment to the CD4+ lineage in the thymus.
In their Science Immunology publication (6), the team took a multidimensional approach to studying the transcription factors (TFs) that drive the split from double-positive CD4+CD8+ T cells to the CD4+ lineage during T-cell selection. Prior studies suggested that multiple factors play a part in initiating the gene expression program characteristic of the CD4+ lineage, directing the team to establish a double knockout (KO) mouse model of two relatively unexplored genes, Zfp281 and Zfp148. These were putative activators of Thpok expression, a gene encoding a TF that in turn prevents expression of, and chromatin accessibility at, CD8+ lineage genes, thus guiding the course of differentiation towards the CD4+ lineage.
Initially using single cell RNA-seq, the researchers showed that knocking out Zfp281 and Zfp148 drove different transcriptomic profiles in immature CD4+ thymocytes compared to the counterpart cluster in control samples. Using the control dataset to define a CD4+ lineage signature, they demonstrated that KO populations had lower CD4+ lineage scores, confirming the likely role of Zfp281 and Zfp148 in lineage commitment.
Functionally characterizing Zfp281 and Zfp148 was also a matter of understanding their impact on the spatial architecture of thymus tissue. The research team noted that KO samples had reduced Ccr7 gene expression, which is involved in T-cell migration from the cortex to medullary areas of the thymus (where T cells then enter the blood). Using Visium CytAssist Spatial Gene Expression on FFPE tissue sections from both control and KO mouse thymi, the team analyzed the distribution of thymocyte cells between the cortex and medulla as they acquired either CD4+ or CD8+ lineage signatures. This revealed a significantly reduced CD4+ lineage signature in KO medulla compared to control samples, and confirmed in spatial context the functional impact of Zfp281 and Zfp148 on CD4+ T-cell differentiation.
Searching for transcript isoforms in spatial context
The discovery power of whole transcriptome spatial gene expression can be strengthened with technological innovations that allow researchers to obtain a more complete picture of biological complexity in a tissue section. That includes transcript isoforms—sequences of RNA transcribed from the same gene but combined in various ways to produce different, but related, mRNA transcripts—that may be hiding in plain sight.
Researchers from the Institut de Pharmacologie Moléculaire et Cellulaire and the KTH Royal Institute of Technology validated a method called spatial isoform transcriptomics (SiT) in their Nucleic Acids Research publication (8). The technique builds on the Visium assay, employing Nanopore long-read sequencing to build spatial gene expression libraries that capture full-length mRNA sequences to detect transcript isoforms. Using this approach, they studied different regions of mouse brain, including the olfactory bulb, to explore transcript isoform diversity.
Within the olfactory bulb, they observed regional isoform switching for 36 genes, one of the most prominent of which was Plp1 (proteolipid protein 1). Implicated in central nervous system pathologies such as dysmyelination, Plp1 isoforms were differentially expressed between the inner granule cell layer (where the full isoform, PLP, was preferentially expressed) and the outer regions of the olfactory nerve layer (where the shortened DM20 isoform was preferentially expressed).
The SiT method allowed the researchers to identify 35 additional codons present in PLP and quantify the balance of both isoforms with spatial context. To further define the cellular source of Plp1 isoform expression, the team used an existing olfactory bulb single cell RNA-seq dataset to deconvolute the cell types in spatial spots defined by SiT. Their data suggested that myelinating-oligodendrocyte cells in the granule cell layer were the main source of the Plp1 standard isoform, while olfactory ensheathing cells in the olfactory nerve layer sourced the shorter DM20 isoform. Together, these findings offer new mechanistic insights into an isoform ratio implicated in a rare neurodegenerative disease, Pelizaeus-Merzbacher disease (8).
Empowering the next era of spatial discovery
Looking back on 2023, we’re amazed and humbled to see the ways Visium Spatial technology has been a part of so many groundbreaking research projects. A single blog can’t do full justice to the breadth and significance of those studies, so we recommend reading more about how Visium Spatial technology is unlocking new avenues of inquiry with the resources below:
Additional publications and blogs:
- Benotmane J, et al. High-sensitive spatially resolved T cell receptor sequencing with SPTCR-seq. Nat Commun 14: 7432 (2023). doi: 10.1038/s41467-023-43201-6
- Researchers map the crucial cellular processes in early human pregnancy
- Researchers uncover how people with paralysis may walk again
- Novel lung immune niche provides long-term antibody hideouts
- Spatial and single cell tools open the black box of early human development
- Spatial transcriptomics—the next evolution of cancer drug discovery
- Simplifying spatial transcriptomics protocols with Visium CytAssist
What’s next for your spatial research and for Visium? If you haven’t heard, we launched Visium HD at the start of 2024. Visium HD is the next evolution of our whole transcriptome spatial gene expression technology, offering the same unbiased discovery power you’ve come to love at the resolution you need—single cell scale with continuous tissue coverage.
Explore Visium HD data and our next-generation slide architecture here →
References:
- Chu Y, et al. Pan-cancer T cell atlas links a cellular stress response state to immunotherapy resistance. Nat Med 29: 1550–1562 (2023). doi: 10.1038/s41591-023-02371-y
- Cleft Lip/Cleft Palate. https://www.cdc.gov/birth-defects/about/cleft-lip-cleft-palate.html?CDC_AAref_Val=https://www.cdc.gov/ncbddd/birthdefects/cleftlip.html
- Piña J, et al. Multimodal spatiotemporal transcriptomic resolution of embryonic palate osteogenesis. Nat Commun 14: 5687 (2023). doi: 10.1038/s41467-023-41349-9
- About Moderate and Severe TBI. https://www.cdc.gov/traumatic-brain-injury/about/moderate-severe-tbi.html
- Zheng P, et al. Integrated spatial transcriptome and metabolism study reveals metabolic heterogeneity in human injured brain. Cell Rep Med 4: 101057 (2023). doi: 10.1016/j.xcrm.2023.101057
- Chopp L, et al. Zfp281 and Zfp148 control CD4+ T cell thymic development and TH2 functions. Sci Immunol 8: eadi9066 (2023). doi: 10.1126/sciimmunol.adi9066
- Luckheeram R, et al. CD4+ T cells: Differentiation and functions. Clin Dev Immunol 2012: 925135 (2012). doi: 10.1155/2012/925135
- Lebrigand K, et al. The spatial landscape of gene expression isoforms in tissue sections. Nucleic Acids Res 51:e47 (2023). doi: 10.1093/nar/gkad169
Editor's note: This article was updated in March, 2025 with new resources.