Your Visium for FFPE data analysis questions answered
Visium Spatial Gene Expression for FFPE is all about removing barriers, overcoming the challenges imposed by formalin-fixation and paraffin-embedding for transcriptomic analysis, to enable unbiased whole transcriptome analysis of FFPE tissue sections. From sample prep to data analysis, the Visium for FFPE workflow is designed to put spatial transcriptomics within your reach.
During the final session of our Visium for FFPE webinar series, we went on a data analysis journey—from data to discovery—with our 10x-pert hosts, Michael Campbell, PhD, Senior Software Engineer, and Florian Baumgartner, Senior Product Manager - Spatial Informatics. They stressed the importance of letting your data drive your discovery efforts—not limiting the opportunities for new insights with pre-existing expectations.
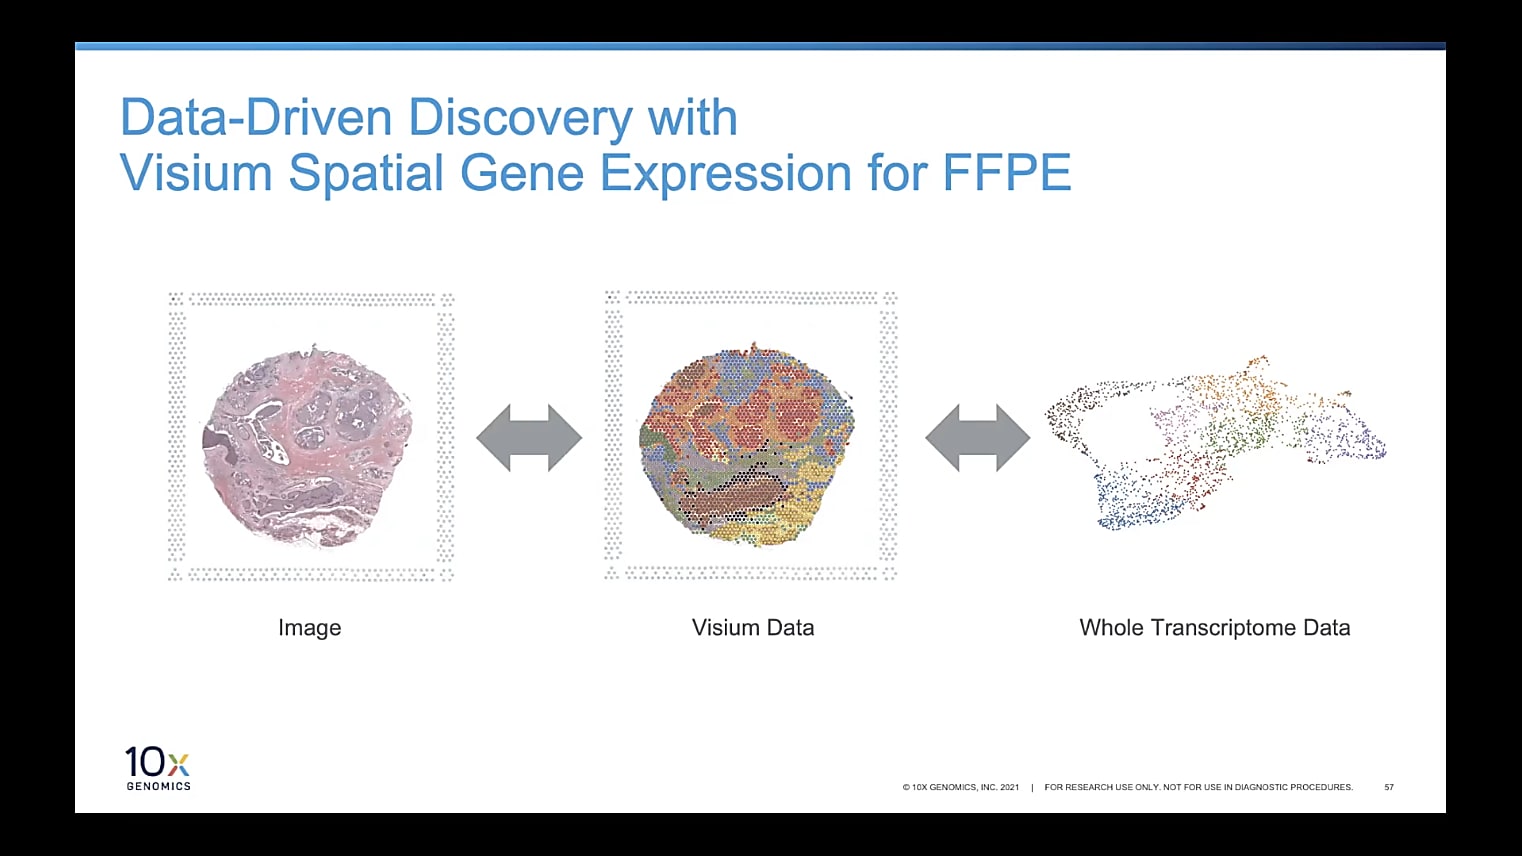
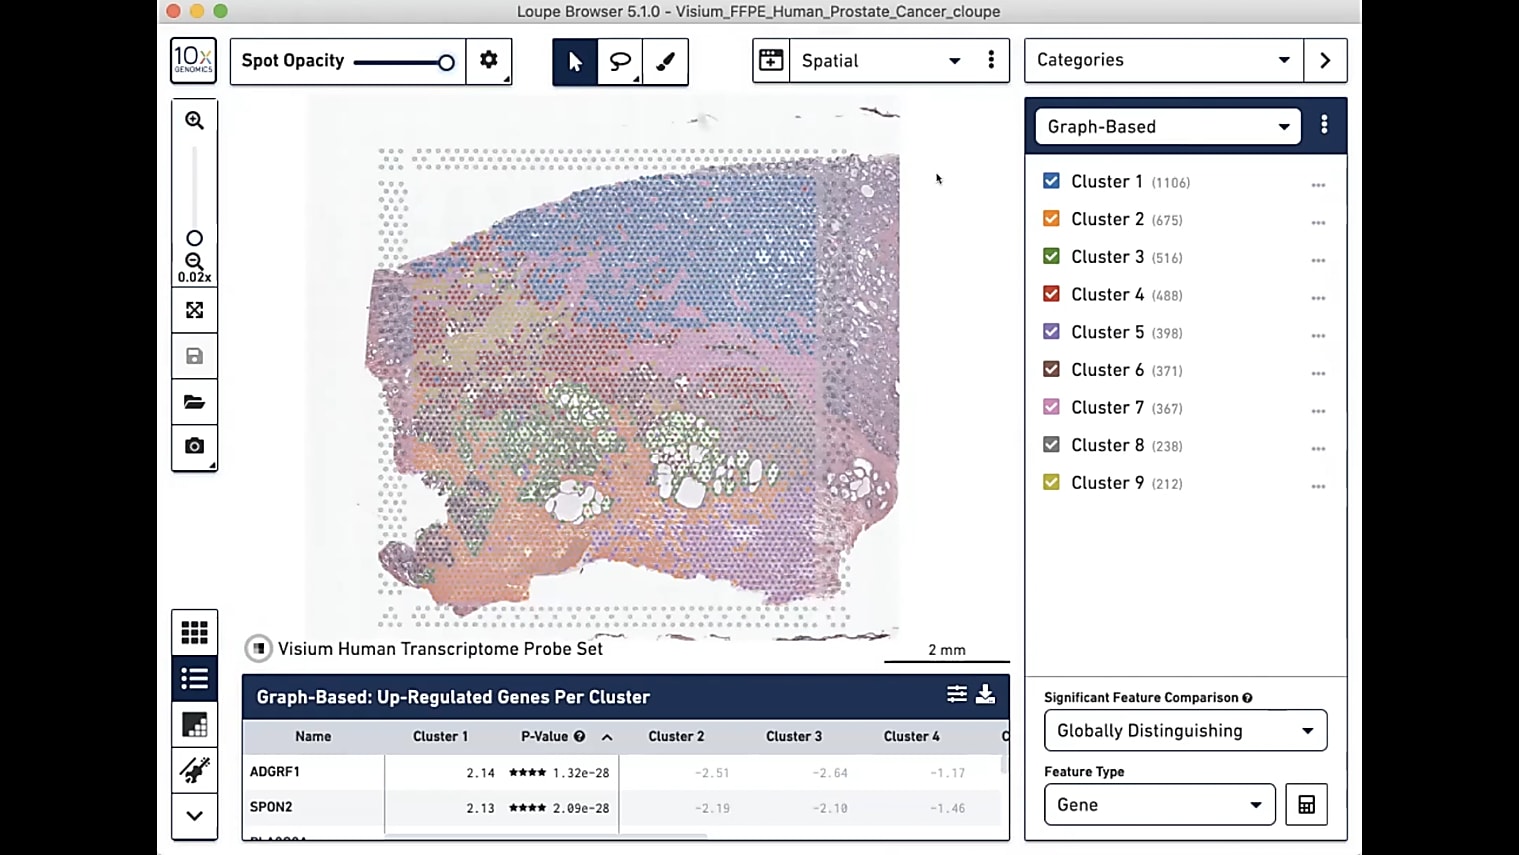
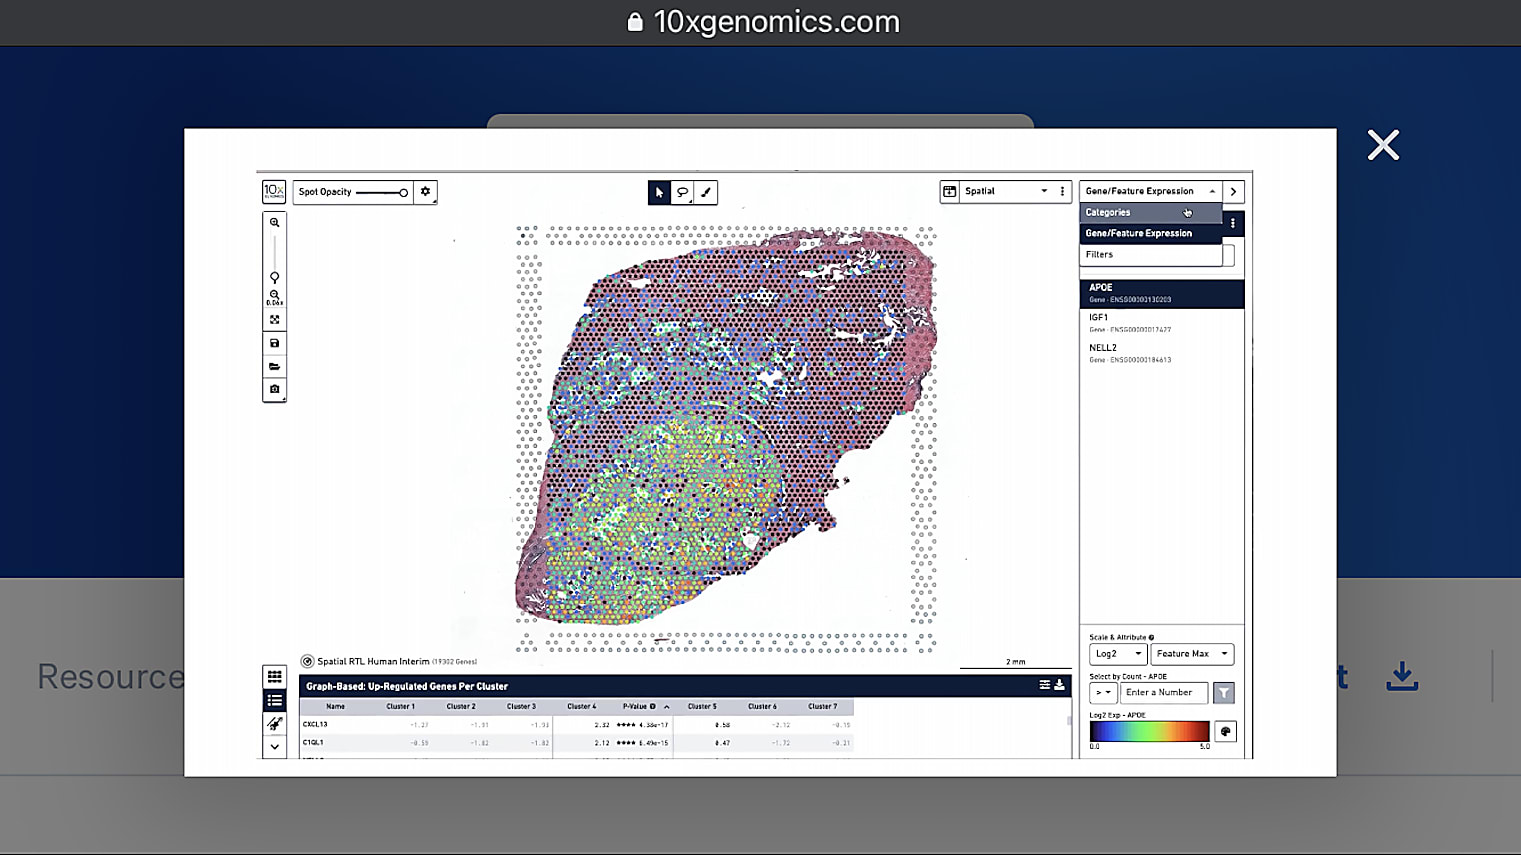
The whole transcriptome approach of Visium for FFPE lets you analyze entire FFPE tissue sections, without the need to restrict analysis to predetermined genes or regions of interest, so you don’t miss out on important biology. Our software tools, Space Ranger and Loupe Browser can help you bring this same unbiased approach to your data analysis process. With various options for analysis and visualization of your data, our turnkey software lets you explore your data from different angles and perspectives, revealing all the secrets hiding within your sample. For example, Visium for FFPE combines tissue image with whole transcriptome data, allowing you to view each of these aspects separately or overlay them to view gene information within the spatial context of your tissue.
Watch the full, on-demand webinar now to learn more about data analysis for Visium for FFPE, explore a demo looking at Visium data for two tissue samples, and find out how data-driven discovery approaches can reveal new and unexpected insights. Keep reading to get a peek at some of the questions Michael and Florian answered during the live Q&A session following the demo.
Is it okay that the tissue overlaps some areas of the fiducial frame?
The reason that you need that fiducial frame is to align the image information with the gene expression information. If it overlaps some of it, it's not going to be a problem.
If you cover up to about a third of the spots, but you still have about three sides with visible fiducial spots, the automatic alignment will likely work just fine. If the automatic alignment does fail, the data can often still be rescued using a manual alignment in Loupe Browser.
As far as the actual data itself goes, covering the fiducials in the frame will not affect the capture of transcripts or ligation products in the assay.
What if I want to compare one tissue slide of a CTR situation versus a Treatment situation, is this possible with Space Ranger?
There are some nuances here, but I'll try and touch on the high points.
So, the number one mistake that people often make in comparing control vs treatment is treating all of the spots as independent observations. For example, a 4 x 4 comparison with a region in the tissue that contains about 1,000 spots should not be treated as a 4,000 x 4,000 comparison. It should be a 4 x 4 comparison in their hypothesis testing. So, to do this comparison, you would need to calculate a single value for the gene of interest for each sample—maybe the log-normalized expression within that region. Those values could then be compared using a two-sample hypothesis test, like a t-test. This analysis approach is not currently implemented in Space Ranger or Loupe. If you want to do qualitative comparison between treatment and control, that's something that's very easy in Loupe Browser and can be done by combining the different samples using the Space Ranger aggr pipeline.
Can I do cell-type deconvolution using Chromium Single Cell and Visium spatial data with your software tools?
Florian: This is a very common question we get a lot. At the moment, it is not possible to do this with our tools, but there are a large variety of third-party tools that have been developed that enable doing this. We already saw a few during the presentation today. So, you have Cell2Location and Seurat as a way to do this, SPOTlight, and others. If you have any questions on which tools there are, we can help you and point you to those. But, they are supported by us in a very limited way because they are developed by third parties. There are a lot of tools out there that are enabled to do this, but our software at this point is not able to do this yet.
About the outcome of the community tools: have you ever reviewed or verified them, and by what approaches?
This is a good question. There are a lot of these community-developed tools. Internally, there have been some that we have played with, but we haven't had the bandwidth to really vet a number of these tools, so that's one of the reasons we can't officially support or endorse them. There's some really cool stuff out there, and we've seen some fun things as we've played around with some of these community-developed algorithms and methods.
Are you planning to increase the spatial resolution?
Yes, we are definitely. Earlier this year, during our Xperience event, we gave some information about the Visium HD product that we plan to launch next year, and closer to launch we will have some more information. So, that will be coming next year.
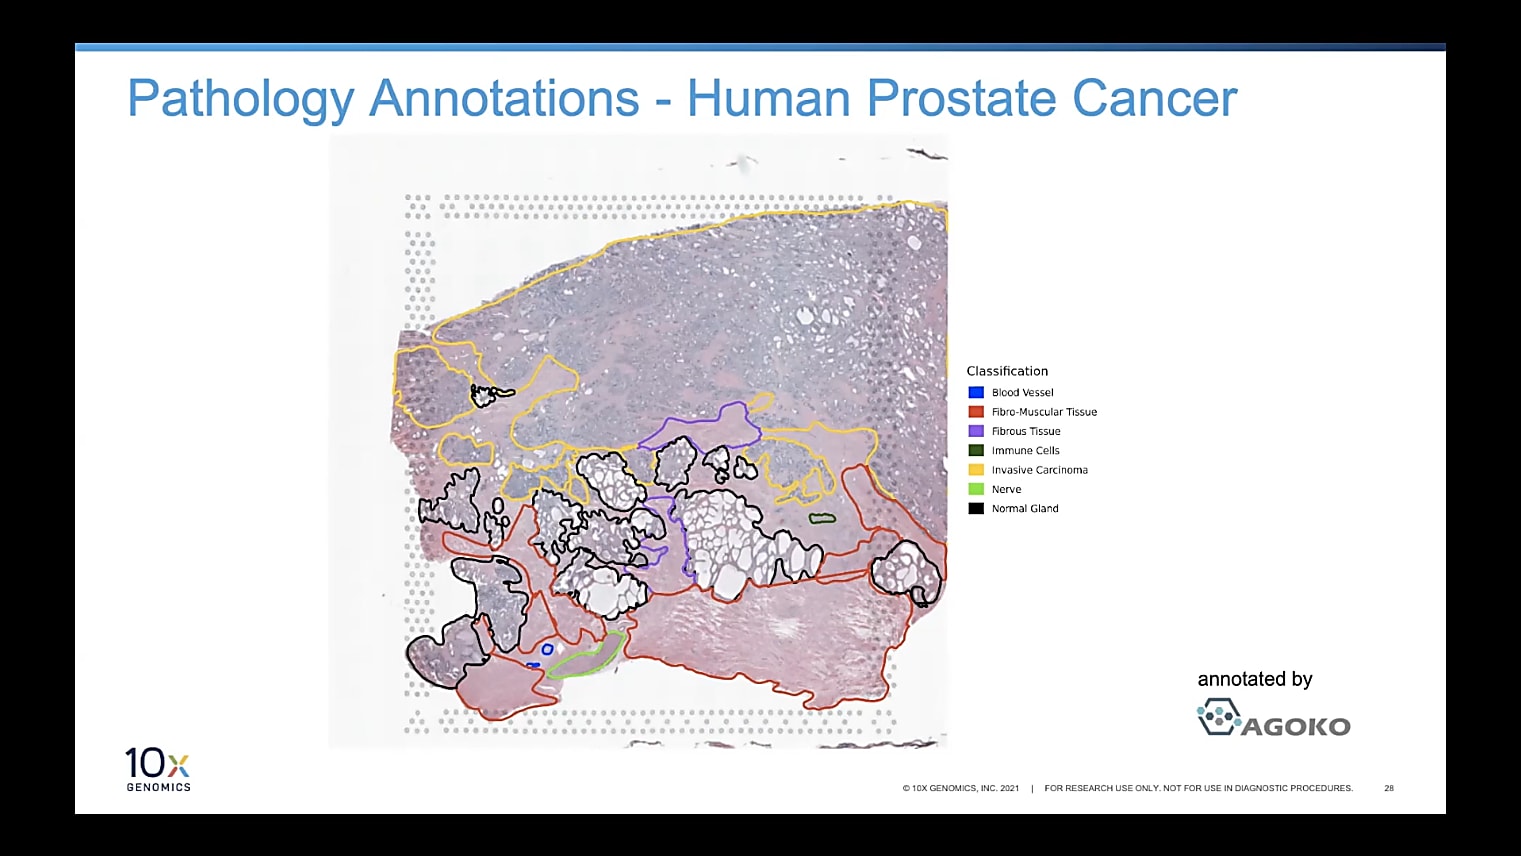
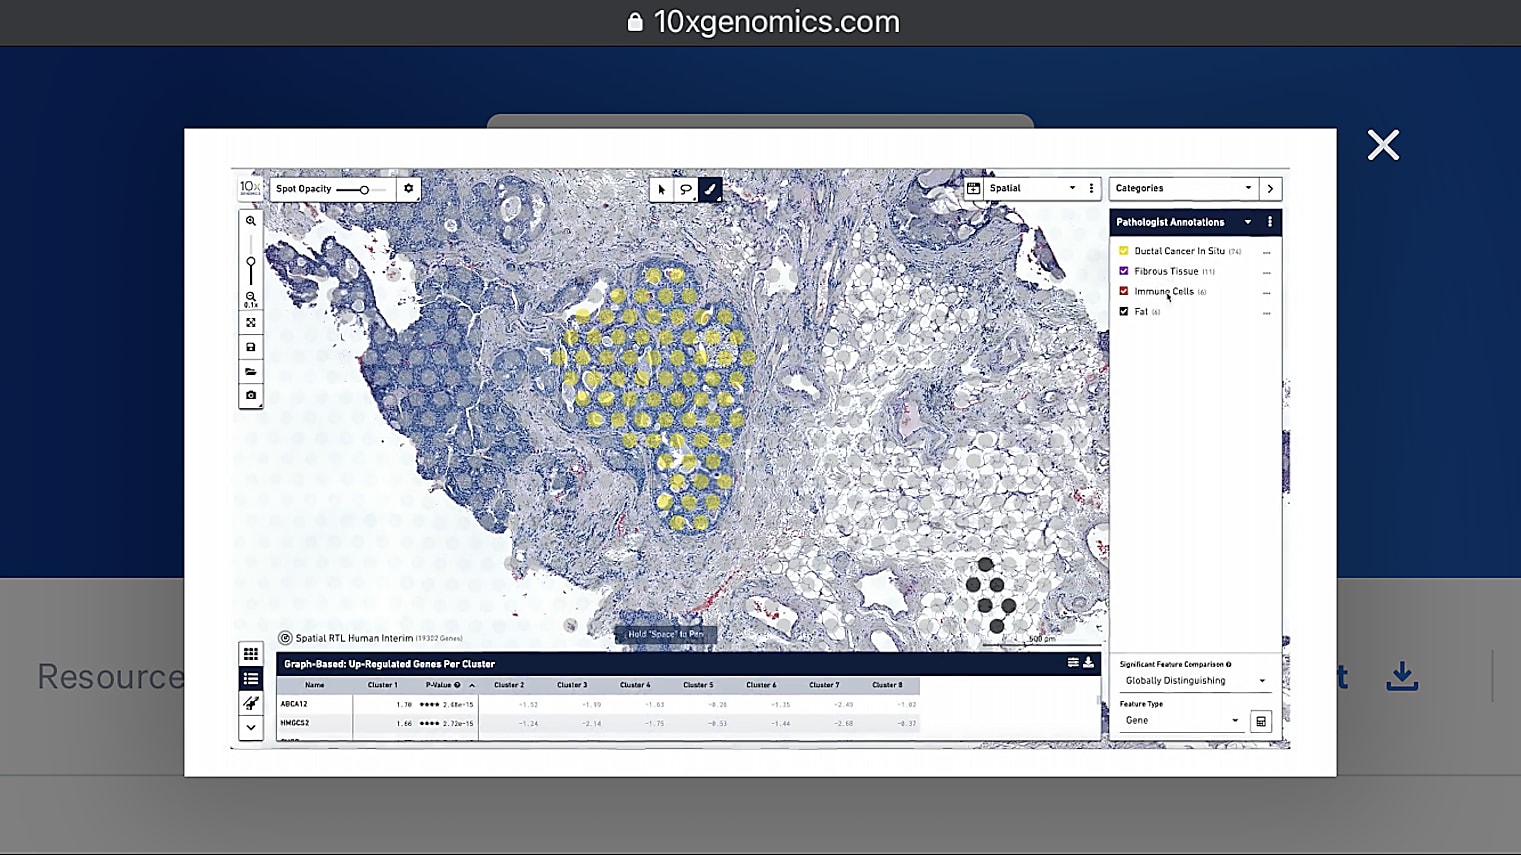
Can I overlay the pathologist image to annotate the regions of interest?
Currently, you would do this by having two separate windows next to each other, which I understand is not always optimal. But, for now, we recommend that you have an image to the left, which is annotated, then Loupe Browser, for example, to the right. Then, you can see the spots in Loupe. It's pretty simple to just annotate them based on what you see in the other image. Because of the resolution we have, it is very handy and very doable to do those annotations by hand so far, but we're definitely looking into how to make this even easier in the future.
Is there a GUI for Space Ranger, or is it all done through the terminal?
For Space Ranger itself, right now it's all done through the terminal. We are hoping to get it onto our Cloud Analysis platform where you’ll have that GUI interface, but, as of right now, it’s all Linux.
Regarding the differences in UMI counts, is this something of importance? I have a dataset that has some epidermis cells with some other types of cells that have a huge count variability, 400 to 24,000.
It's going to depend on the questions that you're asking of the data. Most samples contain a number of different cell types. Some of these cell types really do have much more RNA content than others. Seeing those differences is often a good sign, especially if you're expecting it within your sample type.
Does the tool calculate Moran's I for all genes at once, or does it do it for the most highly DE genes?
The Moran's I value is calculated for all of the genes. You can find the Moran’s I values in Loupe Browser or in one of the CSV files output by Space Ranger.
Are there any 10x Genomics tools to develop downstream network modules for DE genes?
Not for a network analysis right now. Our differential expression outputs could be fed into additional tools, but we don't have anything built in right now.
What's the difference between spatial enrichment and finding upregulated genes?
Upregulated genes are identified between pre-defined clusters while spatial enrichment is not influenced by clusters but looks at all of the spots.
Has there been a study done to compare frozen and FFPE samples? How do the results compare, and does the analysis of the samples require different tools and or methods?
Yes, our first Visium product is for fresh frozen, and now we've developed the Visium for FFPE solution. As mentioned earlier, the Visium for FFPE is still full transcriptome, but it is a capture approach. You get information from the whole transcriptome based on a large probe set. With fresh frozen, you also get the whole transcriptome but the chemistry is different. The Space Ranger pipeline is aware of the different chemistries, and the outputs for both products are very similar, allowing researchers to use the same or similar analysis approaches for both.
Is Visium Spatial Gene Expression a targeted approach? If so, how can you identify new marker genes?
The approach is [actually] probe-based—you've got split probes targeting genes—but it is whole transcriptome at its heart. The panel was designed to cover as many genes as possible within the transcriptome. So, through that, you can still identify new markers.
For the FFPE data, is there reporting on gene isoforms?
There is not. The probes were designed to capture as many isoforms as possible with the fewest probes. This results in the final counts being reported at the gene level and not isoform level.
If I have two sequencing runs from the same slide, the first being an exploratory run and the second being more depth, would it be appropriate to combine them to use with Space Ranger count?
Yes, if the second sequencing run used the same library as the first one did. This scenario is pretty common.
Learn more about how Visium for FFPE can help you uncover the secrets hiding in your FFPE tissues in an upcoming webinar from GenomeWeb, featuring preliminary results from Luciane Kagohara, PhD, Assistant Professor at Johns Hopkins Medicine, and Dan Chang, PhD, Principal Scientist and Single-Cell Sequencing Lead at Merck Research Laboratories. Register now →