Two platforms, one powerful spatial biology toolkit: When and how researchers are using Visium and Xenium

We recently discussed the key features of our Visium Spatial Gene Expression and Xenium In Situ spatial transcriptomics platforms, including technical considerations like plexity, sensitivity, and resolution, among others. This information provides a foundation from which you can start to consider which platform is the best fit for your current applications or if they should be used together.
In the same way that a picture is worth a thousand words, real-world examples of how others have tackled this decision are also helpful. So, how have other scientists used these spatial transcriptomics tools to address their biological questions? What were the strengths of Visium and Xenium that fueled the insights in each study? How have others built on the insights from one technology to inform experiments with the other?
In the sections below, we aim to help you answer these questions by highlighting publications and pre-prints that have used both Visium and Xenium to study the same biological system, but from different angles and with different goals.
Mapping tumor–immune composition in early stages of human lung cancer
- Visium was used to perform unbiased mapping of immune cell types in the tumor microenvironment and draw associations between gene expression signatures and tumor morphology.
- Xenium analysis further untangled the single cell biology present in heterogeneous tumor microenvironments by teasing out differences in local macrophage subtypes at high spatial resolution.
Defining the cellular-molecular organization of the mouse thalamus
- Visium was used in combination with single cell RNA-sequencing (scRNA-seq) to distinguish the excitatory neuronal cell clusters composing three subregions of the anterior thalamic nuclei (ANT) in mouse, and revealed a spatial pattern to gene expression heterogeneity along the dorsomedial-ventrolateral axis of the anteroventral (AV) subregion.
- Xenium provided a high-resolution view of the same tissue regions to untangle further cellular heterogeneity, revealing a mixed astrocyte-excitatory neuron hybrid cell type unique to the AV nucleus and confirming spatial zonation of gene expression heterogeneity across the ANT.
Tracking the development of cleft palate
- Visium established a baseline landscape of the cell types and genes involved in normal palate fusion in mice, and identified three previously unreported genes involved in cilia function.
- Xenium was used in combination with Chromium Single Cell Multiome ATAC + Gene Expression to functionally characterize the relationship between Pax9 (a known transcription factor involved in craniofacial development) and the Wnt signaling pathway, teasing apart specific cell types affected by Pax9 deficiency in a mouse model of cleft palate to define a possible mechanism of disease.
Identifying a triple-positive region in a heterogeneous FFPE breast cancer sample
- Xenium identified a small triple-positive region, originally missed by pathological annotation, and defined cell composition and exclusive gene markers for invasive and ductal carcinoma in situ (DCIS) tumor regions in the same breast cancer tissue section.
- Visium genome-wide data was used to characterize the genes differentially expressed in that particular triple-positive tumor region compared to other tumor regions, defining gene expression signatures and gene ontology unique to heterogeneous DCIS subtypes.
From in situ to invasive lung cancer
Cancer is evolution in a microcosm. Mutations that make the cancer more likely to survive the selective pressures of both our biology and the tumor microenvironment accumulate and proliferate. Except, instead of endless forms most beautiful, this process results in a multitude of evolutionary advantages that enable cancer cells to evade our immune system, resist apoptosis commands, divide uncontrollably, and diversify into multiple different types of cancers, including advanced stages of disease that are more invasive and intractable.
In a recent paper, the Suzuki lab (University of Tokyo) sought to characterize lung adenocarcinoma in situ (AIS) and several distinct AIS subtypes (Noguchi types A, B, and C), which represent an early, non-invasive stage of disease with high patient survival rates when tumors are surgically resected (1). Their motivation was to better understand the molecular events that could drive progression from the less dangerous in situ subtypes to invasive lung adenocarcinoma. However, defining these evolutionary trajectories relies heavily on understanding the intersection of cell type(s), cues in the tumor microenvironment, and tissue spatial context.
Mapping the transcriptome of lung cancer subtypes reveals immune cell characteristics possibly driving progression
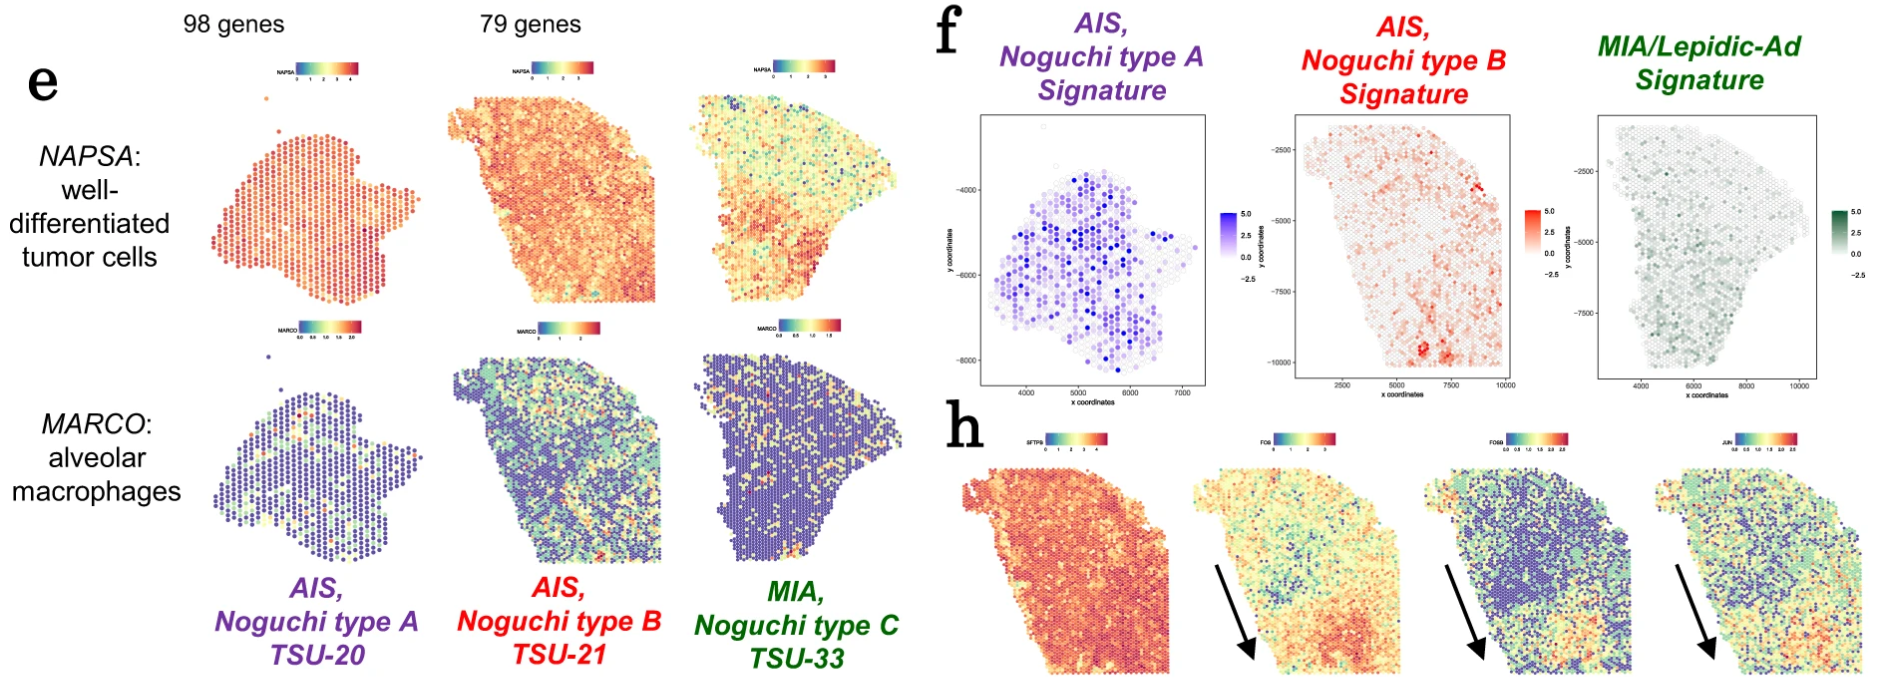
Using bulk RNA-seq and gene ontology analyses on frozen human tissues to differentiate Noguchi type A versus type B AIS, the group discovered each subtype exhibited a distinct signature. Type A cases displayed dysregulation in genes linked to cell growth and survival. In contrast, type B showed extensive upregulation in immune-related genes and an increase in cytotoxic lymphocytes.
The group then used Visium Spatial Gene Expression to validate these transcriptomic findings and localize contributing immune cell types within the type B tumor microenvironment. In one Noguchi type B tumor section, they performed single cell deconvolution of Visium data and discovered macrophage subtypes that highly expressed FABP4 and SPP1 packed near regions of alveolar collapse (sites of acute lung injury). Analysis of the ligand–receptor interactions of SPP1+ macrophages suggested these cells were affecting local fibroblasts and possibly contributing to alveolar collapse and the development of fibrotic foci, which are known histopathological indicators of Noguchi type B AIS. These histopathological events may also be some of the triggers that cause AIS to turn more invasive.
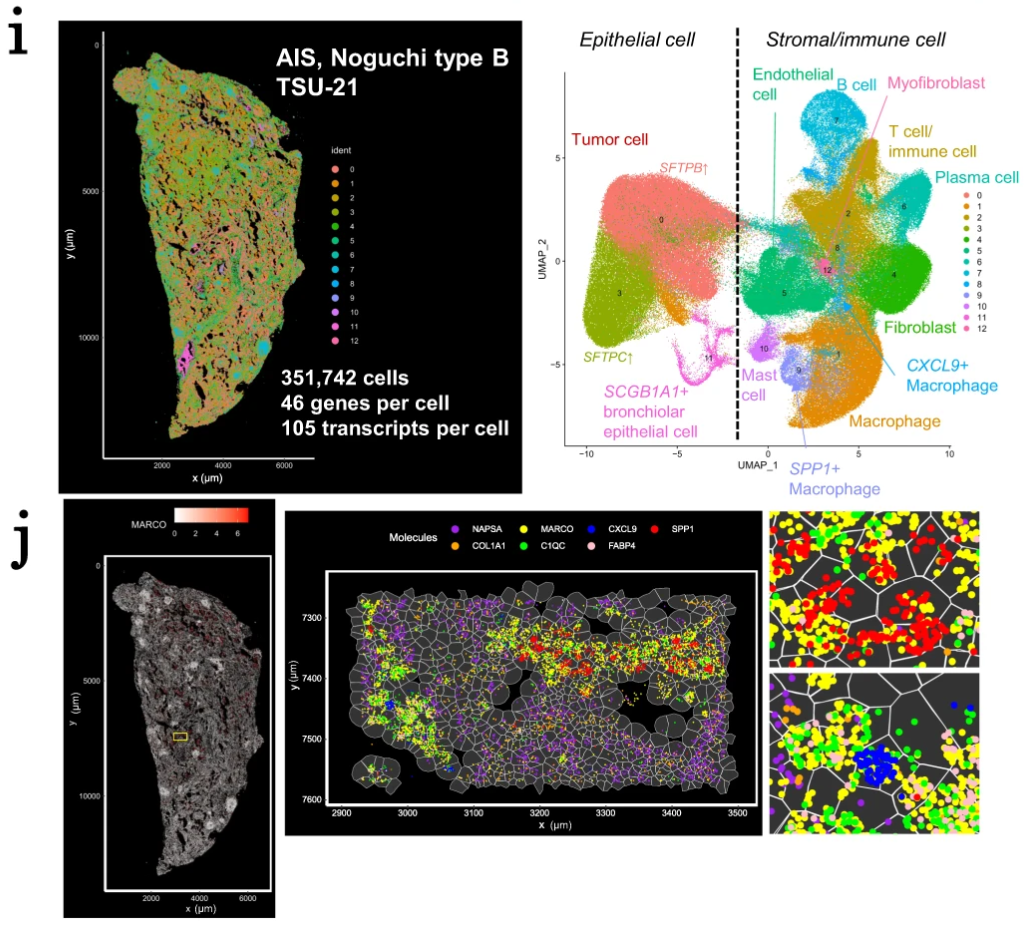
To take their spatial transcriptomic analysis to the next level and get a true single cell view of immune cell activity in these stages of AIS, the researchers used Xenium In Situ analysis to confirm their findings with high spatial resolution. Assaying one type A and one type B case, Xenium allowed them to target 302 genes in over 400,000 cells between the two samples. Notably, they were able to directly observe SPP1+ and FABP4+ macrophages that localized to alveoli structures in type B, but not type A tumors. Zooming in on a small region of the type B tumor section, they were also able to observe a polarization in local macrophage populations between an M1 proinflammatory phenotype and an M2 anti-inflammatory phenotype, which could be relevant to regionally affected anti-tumor or immunosuppressive functions in the tumor microenvironment (2). Later, the team leveraged Xenium data to deconvolve Visium data, further refining cell-type assignment of the genes common between the Xenium gene panel and whole transcriptome Visium data.
The application of Visium and Xenium together (Figure 1, 2) in AIS subtypes provides a clear picture of the differences in cellular composition between these tumor classes and a mechanistic understanding of the immune cell–mediated processes that may be driving progression to more invasive stages of AIS. Moreover, this study highlighted the ability to glean whole transcriptome insights from Visium to uncover associations between gene expression signatures and tumor morphology, then use targeted Xenium analysis to untangle the single cell biology present in heterogeneous tumor microenvironments.
Defining the cellular-molecular organization of the mouse thalamus
The thalamus is one of the information processing cores of the brain and is arranged in specialized regions called nuclei that respectively handle different motor and sensory signals (3). Thinking and memory, attention control, emotions and behavior regulation, processing visual or auditory information, sleep—all of these basic functions, and more, rely on the thalamus. Therefore, it’s a site in the brain that neuroscientists are eager to deeply characterize and understand.
A team of researchers from the University of British Columbia took an integrated single cell and spatial approach to map the cellular and molecular landscape of the mouse thalamus in a recent study from Cell Reports (4). Their goal was to better understand how the unique functions of the subregions (nuclei) of the thalamus could be driven by specific neuronal cell types and their relative spatial organization.
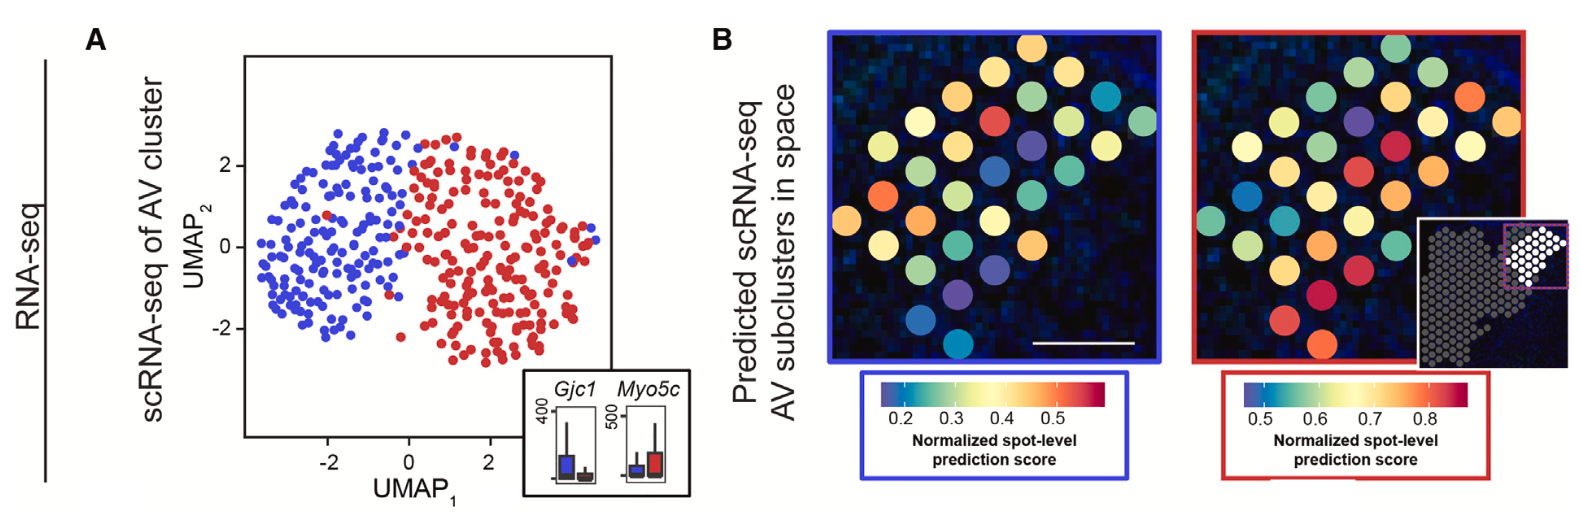
They first used scRNA-seq and Visium spatial transcriptomics on mouse brain tissue to establish a broad map of cell types in spatial context within the anterior thalamic nuclei (ATN). Whole transcriptome single cell and spatial data informed each other to resolve cell-type assignments and marker genes in morphological context (Figure 3), and provided insights into the ontology of gene expression signatures within specific neuronal subtypes.
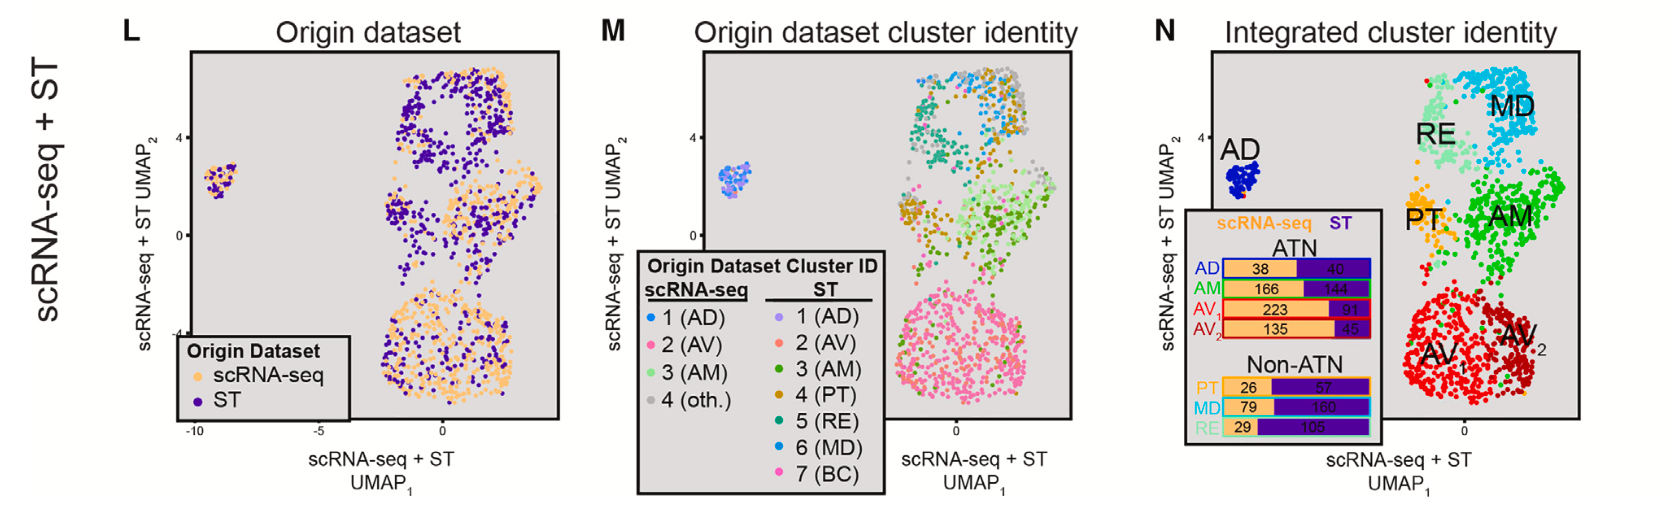
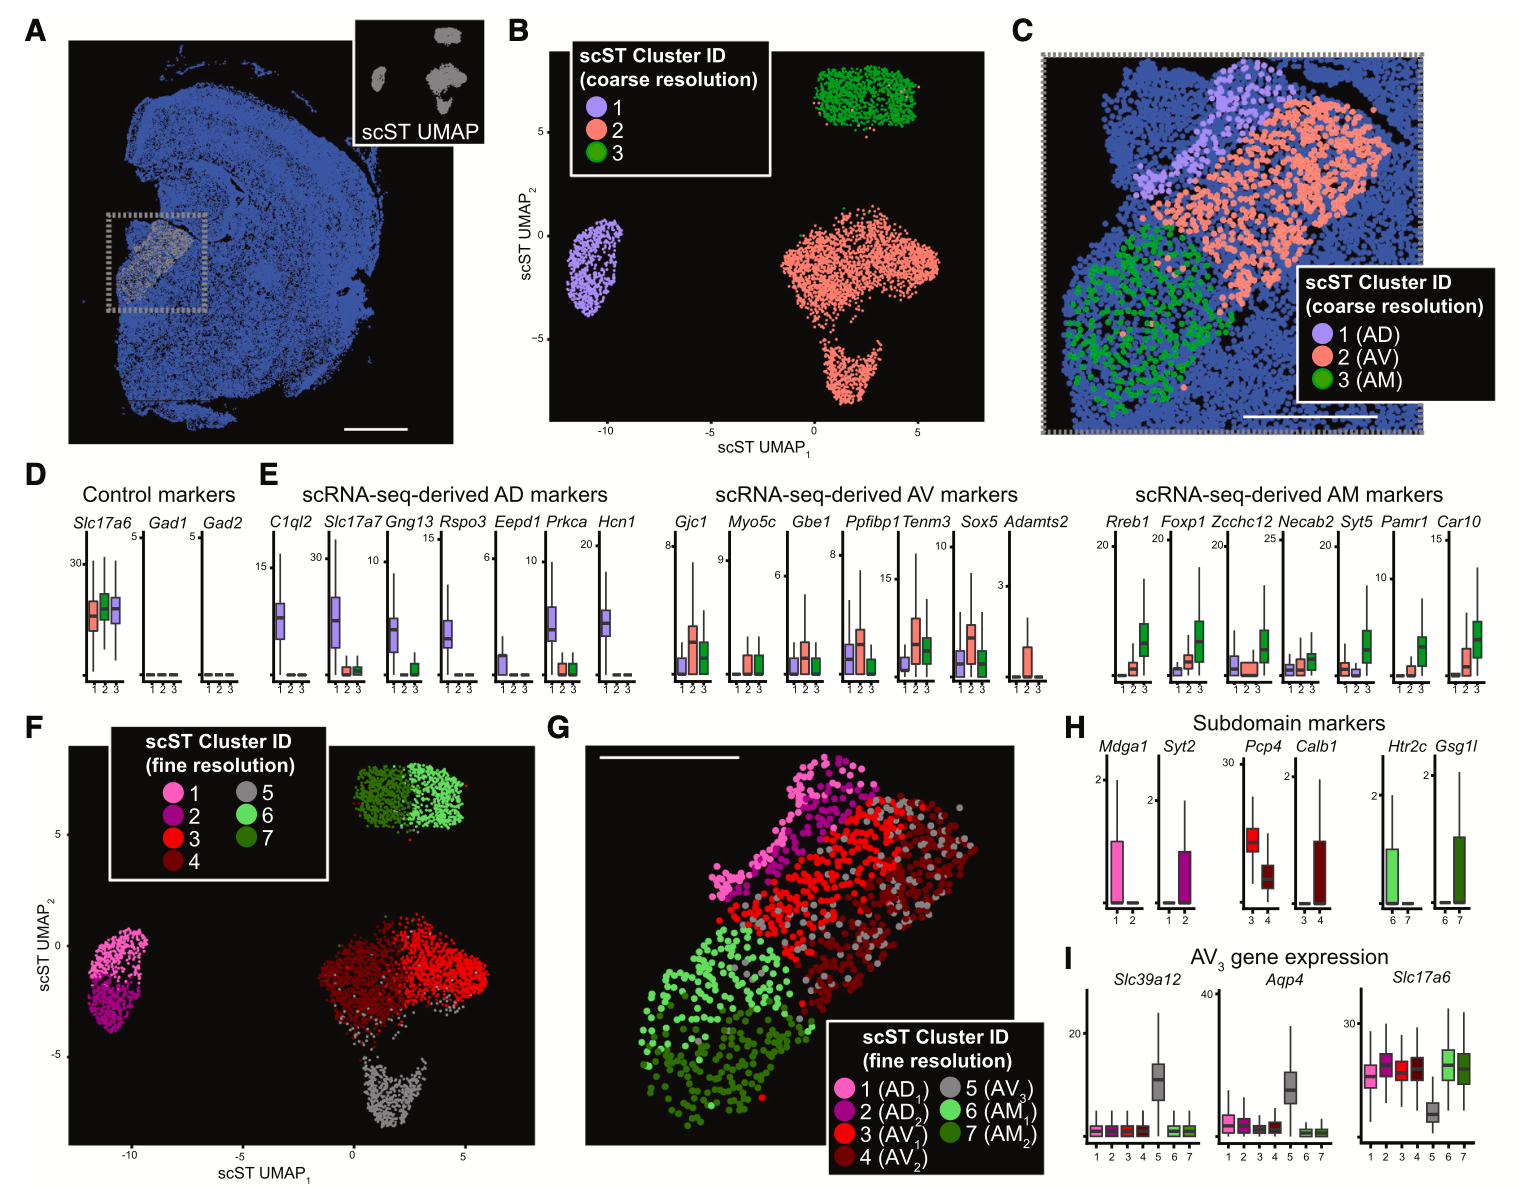
Notably, single cell clusters aligned to the three subregions that compose the ATN: the anterodorsal nucleus (AD), anteromedial nucleus (AM), and the anteroventral nucleus (AV). Integrating Visium spatial transcriptomics data revealed a more comprehensive picture of cellular heterogeneity within the ATN and distinguished cellular clusters corresponding to thalamic nuclei outside of the ATN (Figure 4). Reclustering the single cell data that aligned to the AV nucleus, which appeared to have graded heterogeneity in gene expression between two subclusters (Figure 5), and reintegrating with spatial transcriptomics data, the team noted a spatial pattern to the data suggesting a gradual change in AV cell-type identity crossing the dorsomedial-ventrolateral axis of the AV.
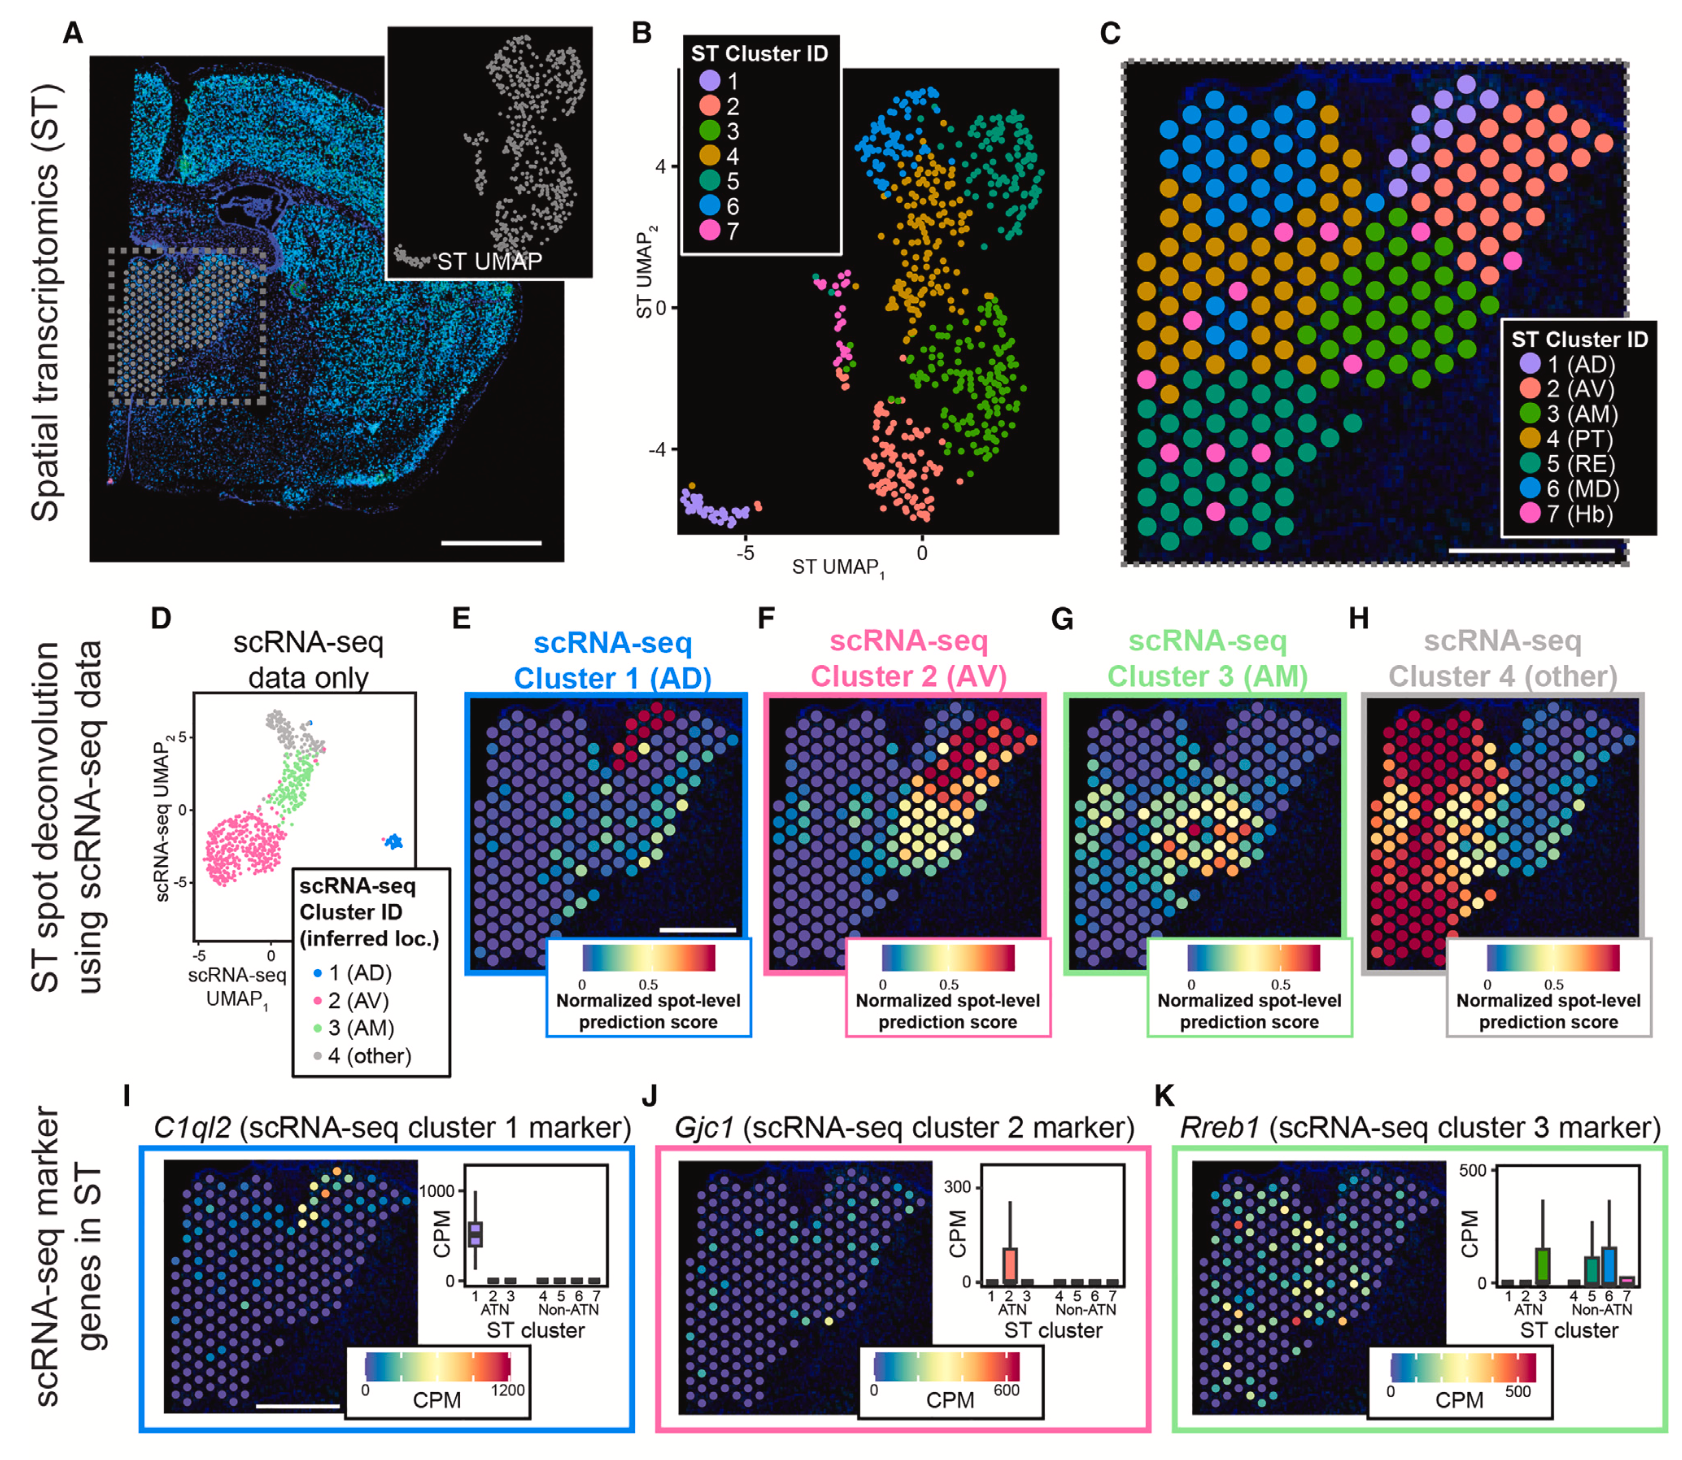
To assess the spatial organization of the ATN at higher resolution and resolve additional cellular heterogeneity, they turned to Xenium In Situ analysis, using a combination of the standard 247-probe panel supplemented with a 50-probe custom panel targeting specific nuclei of the ATN. From 7 mouse ATN tissue sections, they obtained 384,076 total cells, from which 4,476 putative excitatory neurons with cell bodies were located within the ATN. Course clustering by single cell spatial transcriptomics data (Figure 6) revealed three clusters that corresponded to the same clusters identified in scRNA-seq data and reflected the three subregions that compose the ATN (AD, AM, AV).
Then, analyzing the Xenium dataset with finer cluster resolution (Figure 6), the team distinguished further cellular subclusters within the AD, AM, and AV subregions. Notably, this analysis revealed a cell subtype distributed throughout the AV that expressed hallmark genes of both astrocytes and excitatory neurons and could represent a hybrid cell unique to this region of the ATN. The team was also able to confirm graded gene expression heterogeneity along the dorsomedial-ventrolateral axis, which was observed in the combined scRNA-seq and Visium data.
This combined application of single cell, Visium, and Xenium technology ultimately points to their collective value to untangle and refine subtle cellular heterogeneity in a complex tissue system, and to map spatially relevant gene expression changes that can reveal the interplay of cellular identity, location, and function. These insights into the ATN may help researchers come closer to understanding the cellular and molecular mechanisms underlying the diverse information-processing functions of the thalamus.
Back to topTracking the development of cleft palate
An organism’s development is nothing short of miraculous: a single cell splits, divides, differentiates, and—eventually—gives rise to a complex, multicellular organism. Given the complexity of development, it’s inevitable that some missteps occur along the way. Cleft palate—a disorder where the roof of the mouth doesn’t fully close up—is one such common disorder that can have both environmental and genetic linkages.
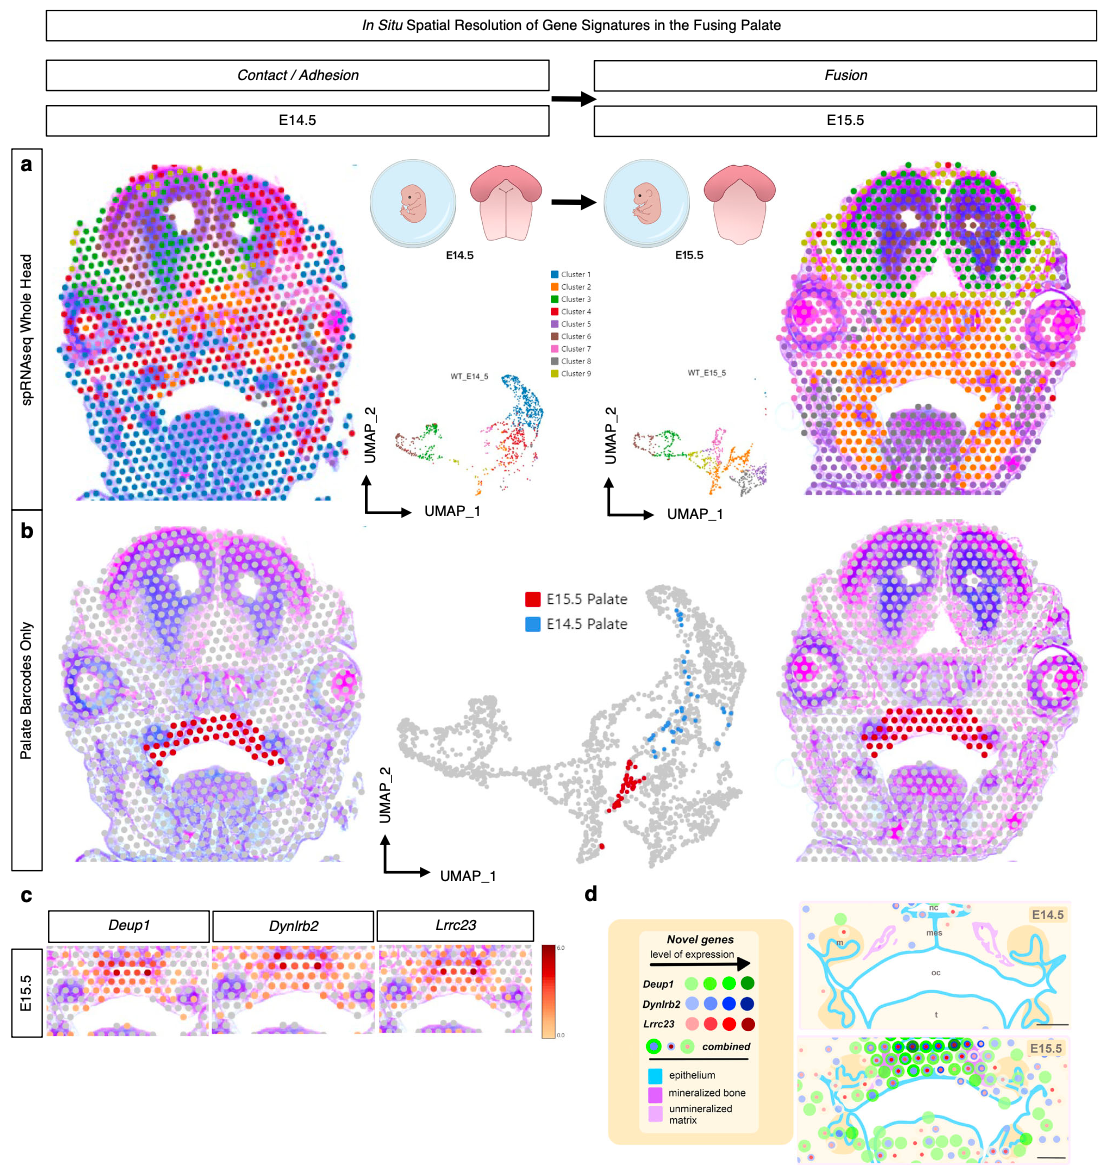
To better understand this disorder, the D’Souza group from the Eunice Kennedy Shriver National Institute of Child Health and Human Development (NICHD) at the NIH sought to map the active genes driving normal palate fusion in an embryonic mouse model (5). Using Visium analysis on formalin-fixed paraffin-embedded (FFPE) coronal mid-palatal sections taken from the transitional stages where palate shelves make contact (E14.5) and the palate fuses (E15.5), the team built a spatially resolved picture of the genes differentially expressed between the two tissue stages (Figure 7).
Their whole transcriptome Visium experiment revealed three previously unreported genes in palate fusion—Deup1, Dynlrb2, and Lrrc23, all involved in cilia function—which were localized in the palate ciliated nasal epithelium at E15.5. These findings suggest nasal epithelium cells may play a special role in facilitating cell migration upon and during fusion of the palate shelves.
After establishing this baseline cellular and molecular landscape of normal palate fusion, the team initiated a subsequent study to tease apart the molecular underpinnings of the Pax9-/- transgenic mouse model of cleft palate (6). They knew that the Pax9 gene encodes a transcription factor that can impact the Wnt signaling pathway, which is a major regulator of embryonic development, but the precise relationship between Pax9 and the Wnt pathway was unclear.
The group started by using Single Cell Multiome ATAC + Gene Expression (Multiome) to simultaneously analyze gene expression and open chromatin regions in the palates of wild-type (WT) and Pax9-/- mice during development. They identified multiple transcriptionally distinct cell clusters, which included a large mesenchymal cell cluster in WT mice. Analyzing these cell types further, they found a distinct subcluster of mesenchymal cells that not only exhibited a substantial (>3.5-fold) enrichment in Pax9 RNA, but an enrichment of open chromatin containing Pax9-binding motifs. Notably, they also observed that Pax9 expression was not necessary for osteogenic cells.
When they repeated these experiments with Pax9-/- mice, the researchers saw two notable differences. The first was that there were increased proportions of osteoprogenitor cells, signaling modifications in palate ossification. The second was a distinct increase in chromatin accessibility for two Wnt signaling modulators, Dkk1 and Dkk2, which is consistent with Pax9 deficiency–induced alterations in Wnt signaling dynamics.
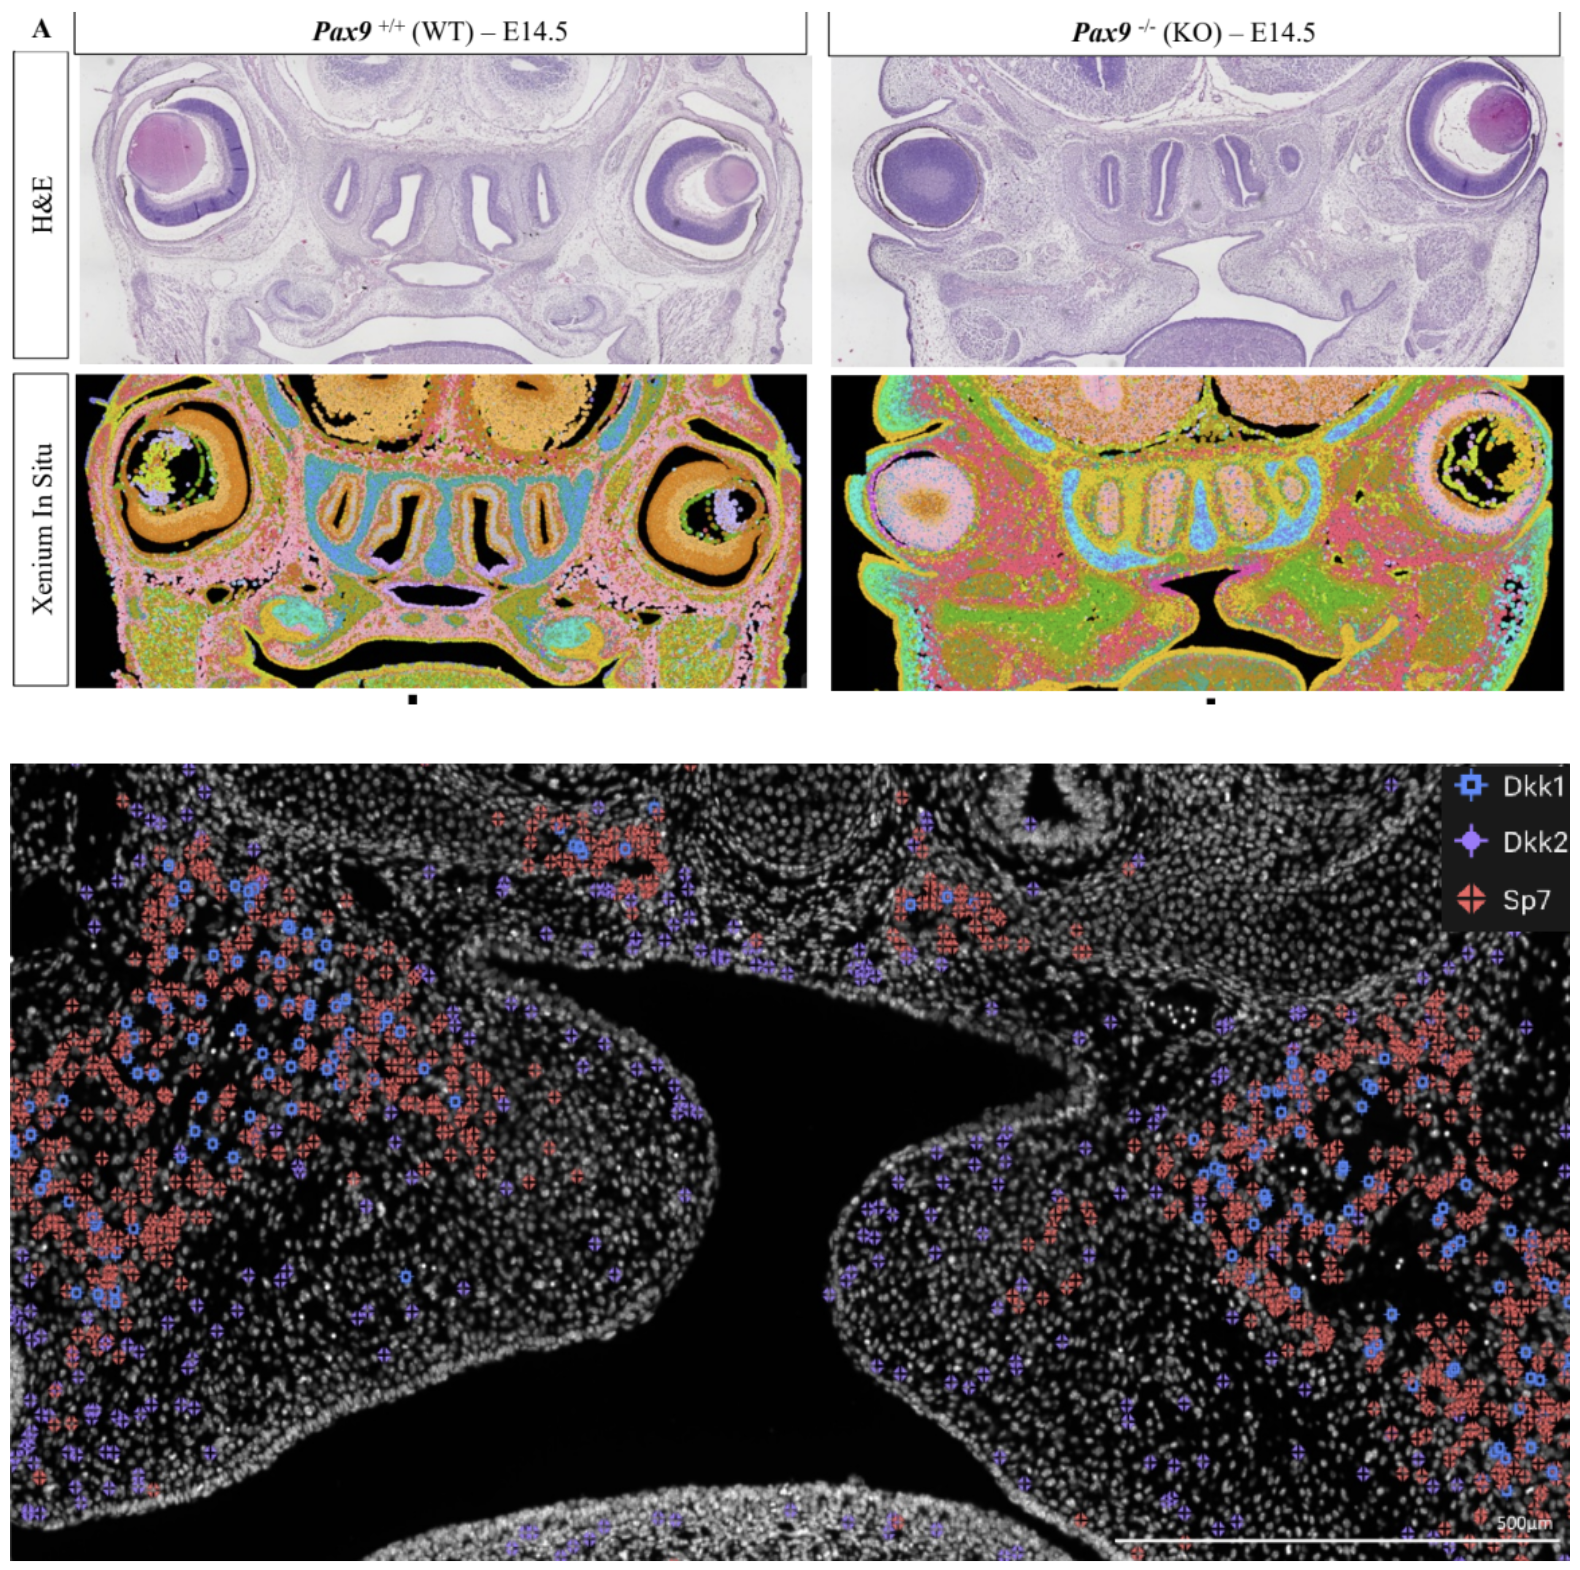
To explore whether Pax9 modulation of Wnt signaling is required for osteogenic commitment, the researchers turned to Xenium In Situ with a customized 350-gene panel to assay cell types, effector-ligands, and unique markers. With Xenium, they were able to perform single cell spatial imaging on FFPE whole-head coronal tissue sections from both WT and Pax9-/- mice (Figure 8).
Cell clustering based on Xenium data resolved 28 different clusters in both WT and Pax9-/- mice. Leveraging the spatial resolution afforded by this technology, the researchers performed gene expression analyses focused exclusively on cell clusters located within the palate to tease apart the differences induced by Pax9’s absence. This revealed exclusive and overlapping mesenchymal and epithelial cell clusters between both groups. Notably, one epithelial cluster, though present in both groups, had two Wnt genes—Wnt5a and Wnt7b—which were prevalent in WT mice but had much lower expression in Pax9-/- mice.
Returning to the Wnt modulators Dkk1 and Dkk2 identified in the Multiome analysis, the researchers observed not only a stark increase in these genes in the Pax9-/- cleft palate, but distinct spatial patterning of these genes (Figure 8). A particular point of interest was that Dkk2 was expressed on the mesial midline border, while several other genes linked to Wnt-overlapping pathways (Bmp2, Bmp4, Fgfr1, and Gli1) were deficient in this region.
Combined, these results are consistent with the ideas that 1) Pax9 expression plays a functional role in commitment and cell fate of mesenchyme cells in the palate, 2) Pax9 absence induces mesial Dkk2 expression, which inhibits Wnt-induced osteogenesis, and 3) these processes could represent one mechanism by which cleft palate forms.
Resolving heterogeneity in ductal carcinoma in situ breast cancer
Seeking to understand how cancers transform from in situ to invasive is not a new question—yet it’s an essential one in all cancers, including breast cancer. Ductal carcinoma in situ (DCIS) breast cancer is considered the earliest stage of breast cancer, so it is critical to resolve cellular and molecular heterogeneity within the tumor microenvironment, including characterizing emerging tumor subtypes, as these features contribute to disease progression and inform treatment decisions.
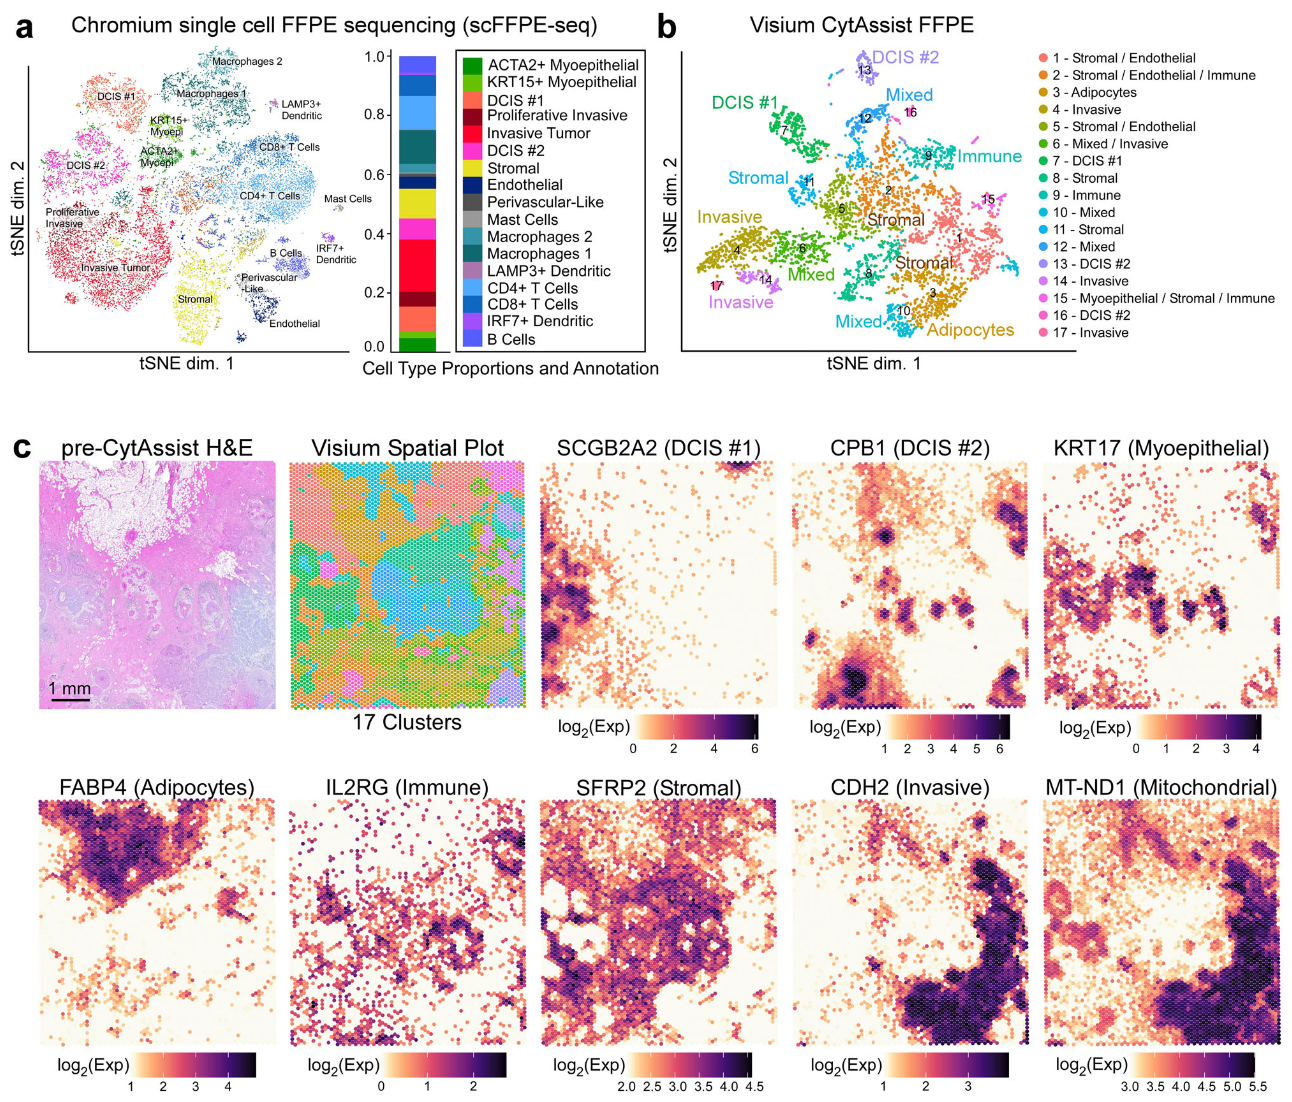
A team of 10x Genomics scientists leveraged tools from our three technology platforms—Chromium Gene Expression Flex, Visium CytAssist, and Xenium In Situ—to perform this deep characterization of the tumor microenvironment of a human FFPE DCIS tissue block (7). First leveraging discovery-based, whole transcriptome approaches with single cell (scFFPE-seq) and Visium spatial analysis on adjacent tissue sections, they created a comprehensive map of the cellular composition and spatial organization of the tumor sample. This integrated approach localized cell types and disease states across the tumor section, including the spatial location of three tumor domains—two molecularly distinct types of DCIS (DCIS #1 and #2) and an invasive tumor region—and other immune, stromal, and adipocyte cells (Figure 9).
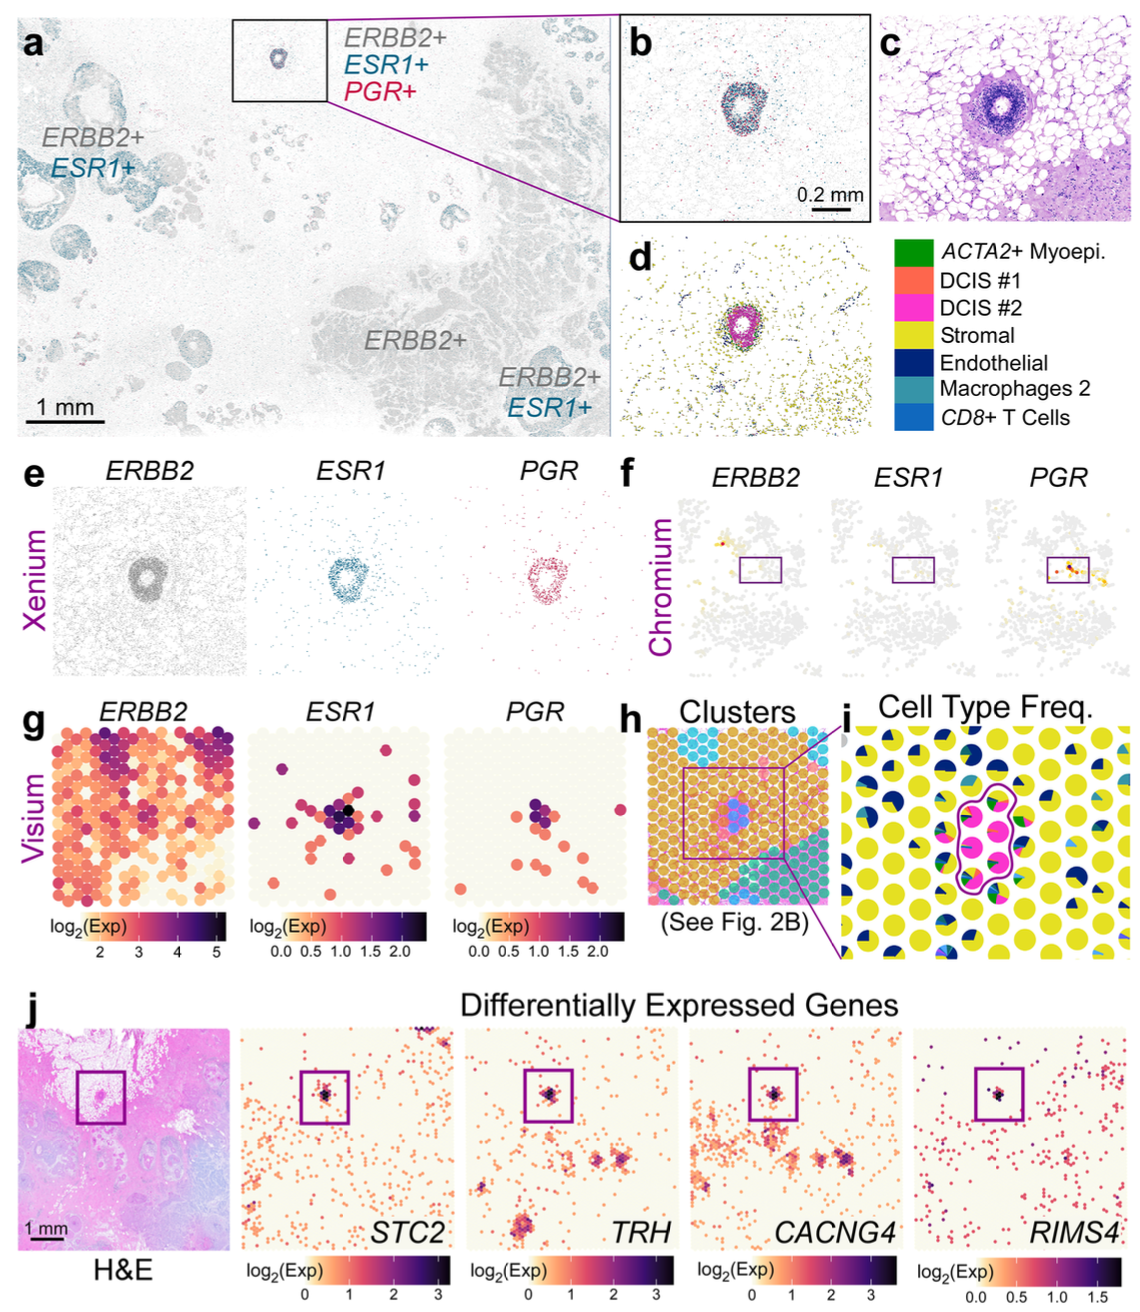
To further characterize and refine the cellular relationships in small cellular neighborhoods within the tumor microenvironment, the 10x team turned to Xenium, using a 313-plex human breast panel, which provides subcellular spatial resolution. The tumor section had been classified as a HER2+/ER+/PR-—meaning the sample expresses the human epidermal growth factor receptor 2 (HER2/ERBB2) and estrogen receptor (ER/ESR1), but does not express the progesterone receptor (PR/PGR)—by traditional histopathology assessment with H&E staining. Notably, however, Xenium spatial analysis revealed a small region of the tumor that had triple-positive expression of ERBB2, ESR1, and PGR transcripts (HER2+/ER+/PR+). This meant another cancer subtype was present in the heterogeneous sample, which could be important for classification and treatment. Moreover, with integrated single cell data, Xenium helped define the cellular composition and exclusive expression markers to distinguish the invasive and DCIS regions. For example, the team observed an increased proportion of invasive tumor cells in DCIS #2, suggesting this subclass was more invasive than DCIS #1. They were also able to clearly define the DCIS #2 tumor border by Xenium, noting a thin layer of myoepithelial cells encircling invasive cells.
Visium whole transcriptome analysis was also important to further characterize the small triple-positive region the team identified with Xenium (Figure 10). Using Xenium data to deconvolve Visium data, the team performed spot interpolation and visualized likely cell-type proportions within the Visium spots that covered the triple-positive region, as well as differential gene expression analysis for those spots compared to all other malignant spots. This identified 48 differentially expressed genes in the PGR+ spots compared to DCIS #1 and 44 differentially expressed genes compared to DCIS #2. Gene ontology analysis further distinguished these tumor regions by gene function: the PGR+ region had expression signatures related to estrogen receptor signaling, DCIS #1 showed signatures predominantly indicative of metabolism, and DCIS #2 genes related to interferon signaling pathways.
This study demonstrates an important rule: a “simple” DCIS sample may not be simple at all. Rather, it could be extremely heterogeneous, containing a spectrum of tumor subtypes that not only influence cancer classification, but possibly disease progression and therapeutic response. Integrated analysis provided by whole transcriptome single cell and spatial approaches, plus targeted analysis at the highest single cell resolution, can bring clarity to this heterogeneity and identify cell states and biomarkers involved in progression towards invasive carcinoma.
To go deeper into this study, find additional resources here:
- (Blog) 10x authors discuss the value of combining insights from single cell and spatial platforms
- (Blog) A focused breakdown of Xenium-enabled findings
- (Publication) Janesick A, et al. High resolution mapping of the breast cancer tumor microenvironment using integrated single cell, spatial and in situ analysis of FFPE tissue. Nat Commun 14: 8353 (2023). doi: 10.1038/s41467-023-43458-x
Upleveling spatial biology research with a multifaceted toolkit
As these studies demonstrate, taking advantage of multiple spatial biology tools allows you a clearer picture of the true biology of a tissue. Though not always necessary, the combined power of Visium whole transcriptome spatial discovery and Xenium precision single cell spatial imaging can help reveal greater heterogeneity than one technology alone. Moreover, traditional single cell analysis has great value for use with either, or both, of these spatial technologies, providing the resolution of a whole, intact cell and fitting that information into the contours of the tissue architecture.
The examples provided in this blog are by no means an exhaustive view of the possible applications of Visium and Xenium, whether alone or in combination. We fully expect that you, our innovative customers and scientific partners, will envision applications beyond those described above—and we can’t wait to be mind blown when you do.
*Author’s Note: The studies featured in this blog used our Visium Spatial Gene Expression v2 assay. We recently introduced Visium HD, a whole transcriptome spatial assay that provides data at single cell scale. Regardless, these studies provide principles for how whole transcriptome discovery-based approaches can be applied in a complementary manner with Xenium In Situ targeted analysis. To see applications of Visium HD from early users, please review this Visium HD introductory blog and our recap of AACR 2024.*
You can also explore the differences between Visium HD and Xenium in this technical considerations blog, which provides an additional lens to consider which spatial technology is right for you.
References:
- Haga Y, et al. Whole-genome sequencing reveals the molecular implications of the stepwise progression of lung adenocarcinoma. Nat Commun 14: 8375 (2023). doi: 10.1038/s41467-023-43732-y
- Suzuki Y. High-resolution analysis of lung cancers reveals heterogeneity in tumor microenvironments. 10x Genomics Webinar (2023). https://www.10xgenomics.com/videos/kx615e0tof?autoplay=true
- https://my.clevelandclinic.org/health/body/22652-thalamus
- Kapustina M, et al. The cell-type-specific spatial organization of the anterior thalamic nuclei of the mouse brain. Cell Rep 43: 113842 (2024). doi: 10.1016/j.celrep.2024.113842
- Piña J, et al. Multimodal spatiotemporal transcriptomic resolution of embryonic palate osteogenesis. Nat Commun 14: 5687 (2023). doi: 10.1038/s41467-023-41349-9
- Piña J, et al. Spatial multiomics reveal the role of Wnt modulator, Dkk2, in palatogenesis. bioRxiv (2023). doi: 10.1101/2023.05.16.541037
- Janesick A, et al. High resolution mapping of the tumor microenvironment using integrated single-cell, spatial and in situ analysis. Nat Commun (2023). 14: 8353. doi: 10.1038/s41467-023-43458-x
About the authors: