This page describes the algorithms underlying the processing and analysis steps that occur on the Xenium Analyzer.
The Xenium In Situ Gene Expression (CG000582, CG000749) and Xenium Prime In Situ Gene Expression (CG000760) workflows begin with sample preparation. Fresh frozen (FF) or formalin-fixed paraffin-embedded (FFPE) samples are mounted on Xenium slides. The samples are fixed and permeabilized (FF samples) or deparaffinized and decrosslinked (FFPE samples). Then, probe hybridization, ligation, and rolling circle amplification (RCA) are performed following the steps in the respective assay user guides.
Once the sample has been prepared, imaging is performed in cycles on the Xenium Analyzer. During each cycle, fluorescently labeled probes for detecting RNA target sequences and other reagents are automatically cycled in, imaged, and removed. The internal image sensor captures data across multiple Z-planes with a 0.75 µm step size across the entire tissue thickness for every field of view (FOV) in the user-selected region (see Region Selection Guidelines in the Xenium Analyzer instrument user guide). Image data are captured for multiple fluorescence channels in every cycle, which are processed and stitched to build a spatial map of the transcripts across the selected tissue section.
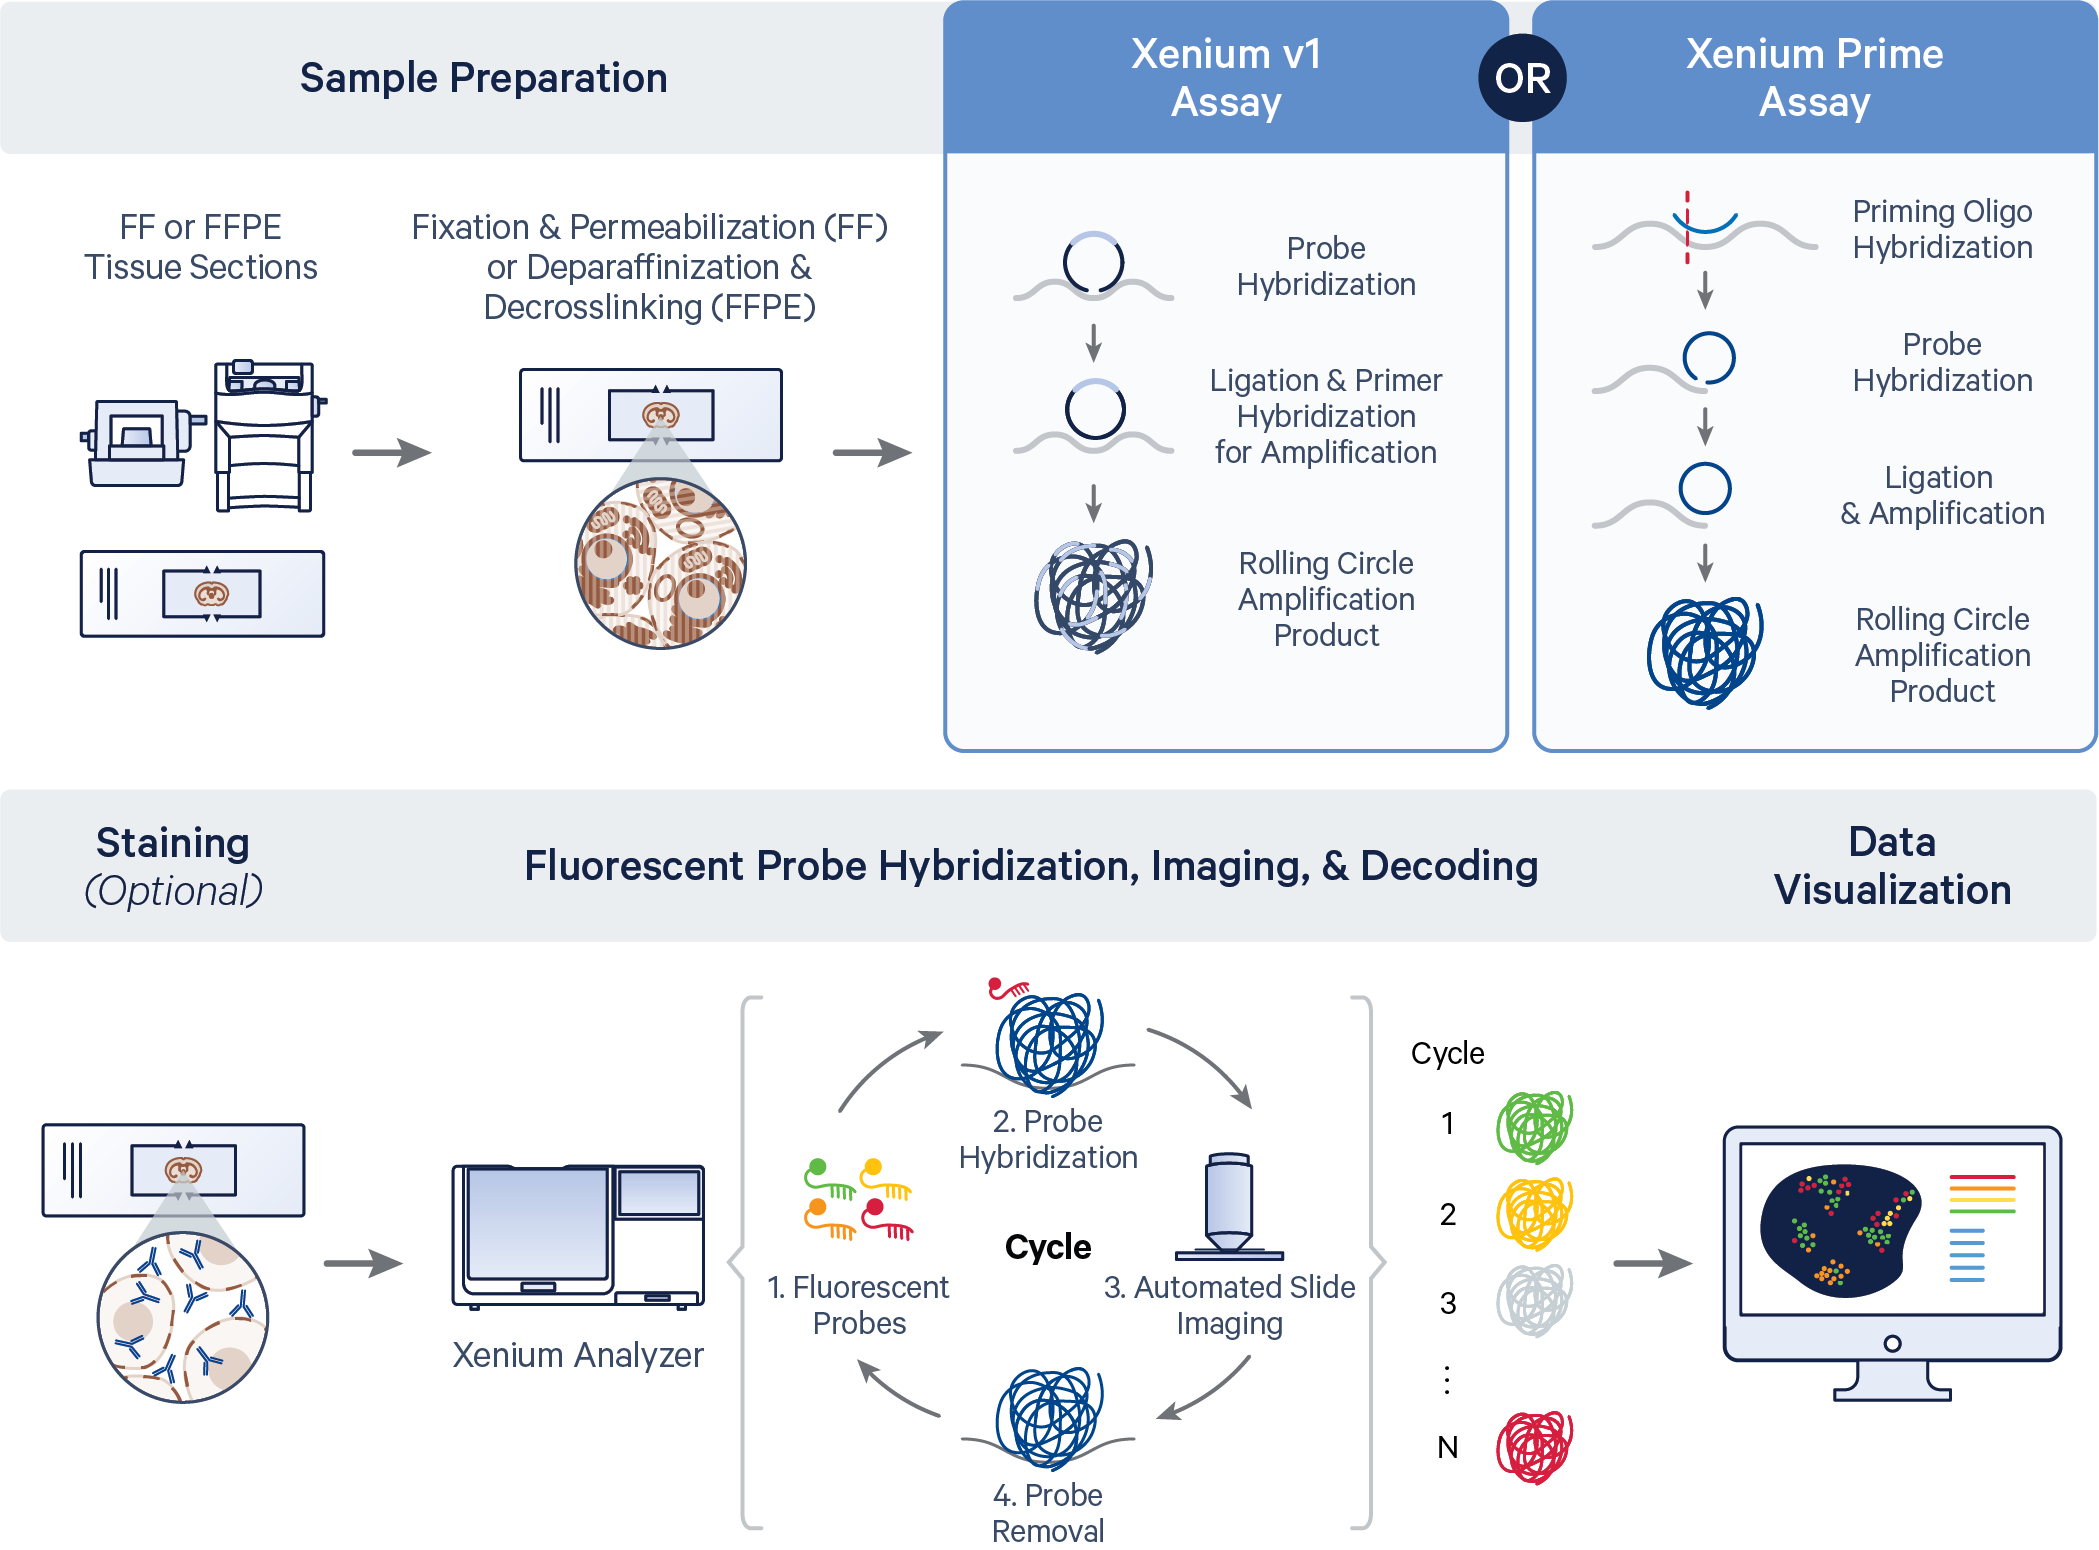
Thus, over the course of a run, the Xenium Analyzer’s internal image sensor collects 3D volumes across: 1) multiple FOVs, 2) multiple fluorescence channels, and 3) multiple cycles of chemistry and imaging. This produces terabytes of internal sensor data that are processed efficiently and analyzed across all cycle-channels to decode transcripts. Once transcripts are decoded, downstream analysis and visualization of Xenium raw data output — the spatial map of transcripts — can proceed.
The Xenium Onboard Analysis (XOA) pipeline supports the analysis of gene and protein expression data.
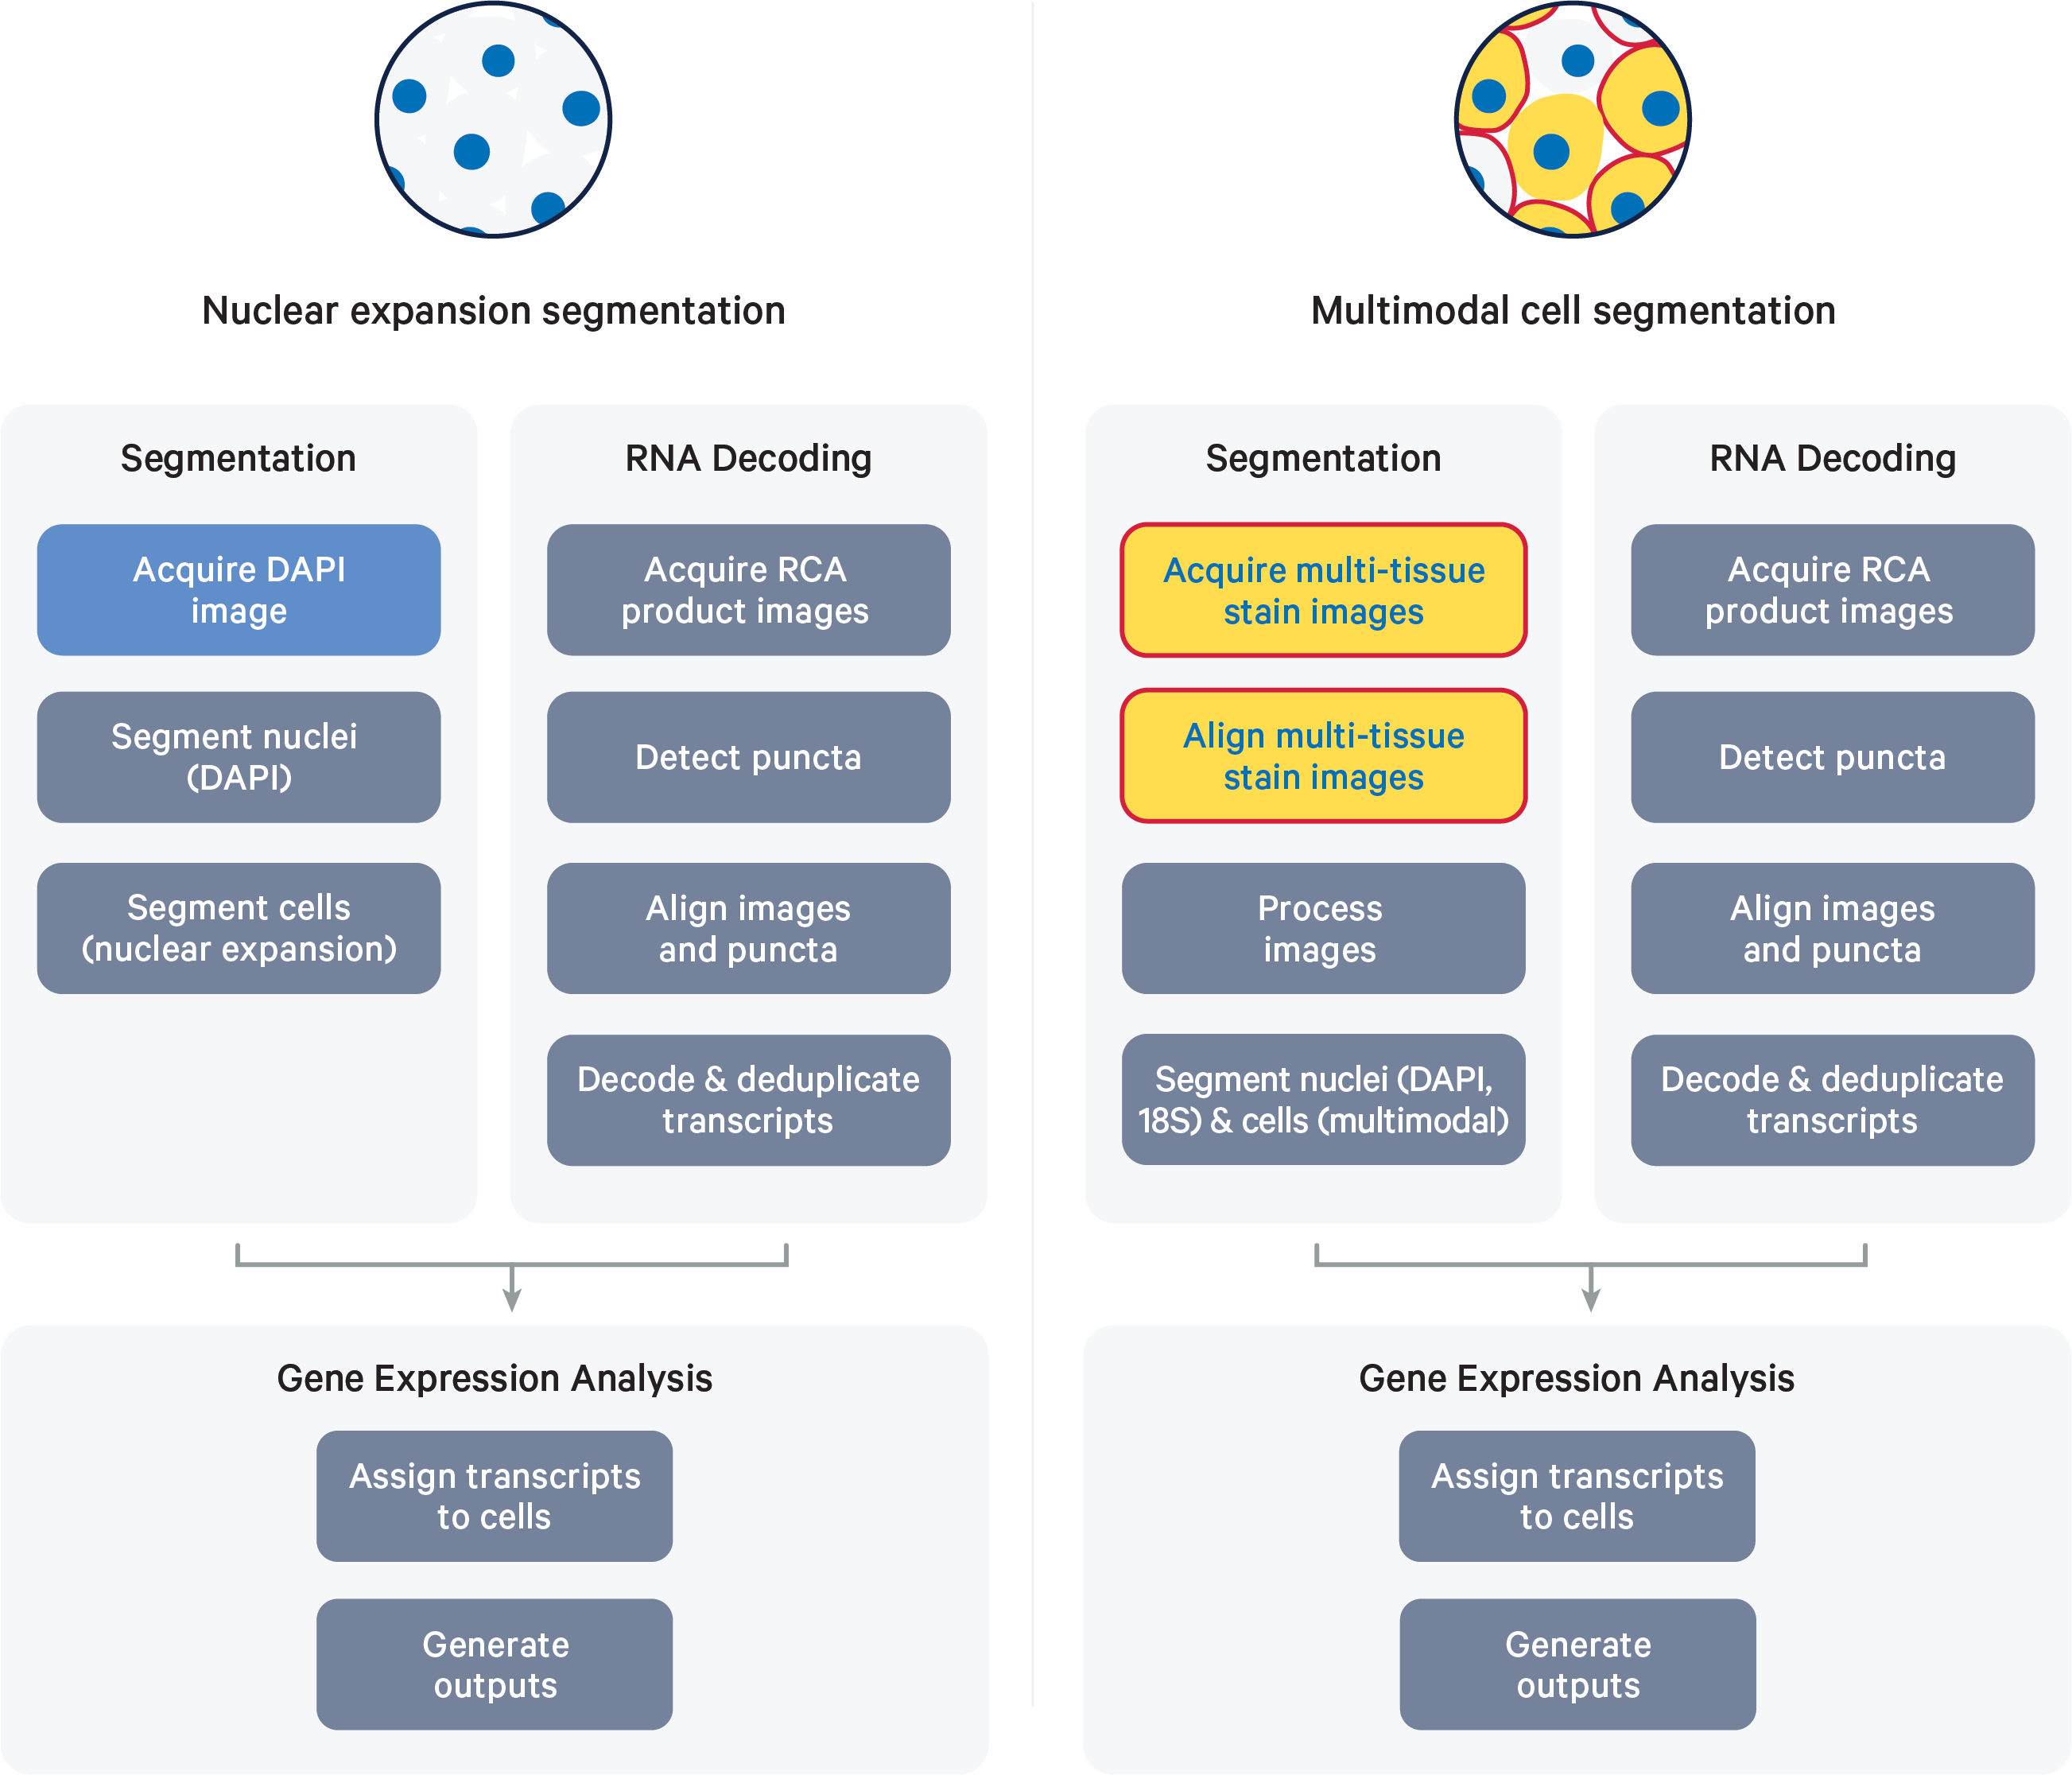
The image processing and segmentation steps of the XOA pipeline depend on the assay workflow used to prepare samples. The final steps of both pipelines include RCA product image registration, decoding, deduplication, secondary analysis, and generation of Xenium Onboard Analysis output data. Quality scores (Q-Scores) are estimated using controls for calibration (see Controls).
The high-level pipeline steps for each workflow are shown in the diagrams below:
- (Left) Following the Xenium In Situ Gene Expression - Probe Hybridization, Ligation & Amplification User Guide (CG000582)
- (Right) Following the Xenium In Situ Gene Expression with Cell Segmentation Staining User Guide (CG000749) or Xenium Prime In Situ Gene Expression with optional Cell Segmentation Staining User Guide (CG000760)
The image processing steps performed by the pipeline across cycles include acquisition of:
- DAPI images: DAPI (Xenium Nuclei Staining Buffer) is a blue fluorescent DNA stain for visualizing nuclear DNA in fresh and fixed cells. In the Xenium workflow, DAPI staining is used to locate nuclei, inform cell segmentation, and produce a 3D tissue morphology image. DAPI images are captured across all FOVs in the first cycle.
- Multi-tissue stain images: The Xenium Multi-Tissue Stain Mix contains stains for visualizing the cell membrane and cytoplasmic regions of cells. The boundary and interior RNA stains, in addition to the DAPI nuclei stain, are used to inform cell segmentation for the multimodal cell segmentation assay workflow.
- Protein images: Antibody staining is performed for several protein markers in the Xenium Protein assay performs.
- Background images: Background "blank" image, where a picture of the tissue is taken with no fluorophores. It may also be referred to as an autofluorescence image.
- RCA product images: For each cycle, images are captured in multiple color channels across all FOVs. Punctate fluorescent signals (puncta) are detected and filtered, and image distortion is corrected.
Click the link below to read about the algorithms used to process these images.
Nucleus segmentation occurs between cycles, while cell segmentation occurs after the imaging cycles have completed.
- In the Xenium In Situ Gene Expression assay, DAPI images are used to infer nucleus boundaries using a machine learning algorithm; cell boundaries are then inferred by isotropic nuclear expansion.
- In any Xenium In Situ assay following the Cell Segmentation Staining workflow, multi-tissue stains and multimodal cell segmentation methods are used to determine cell boundaries.
Click the link below to read about the algorithms used to segment nuclei and cells.
For each FOV, puncta across channels and cycles must be aligned to reduce differences in image offset, rotation, and magnification. This is important for accurate transcript decoding. The localized puncta from each channel and cycle are registered so that puncta corresponding to the same original RNA molecule are aligned tightly in 3D. Nonlinear transformations are fitted such that all the puncta are aligned to the reference morphology image.
In order to proceed from puncta to transcripts, decoding must be performed. The Xenium codebook contains a collection of codewords that are assigned to genes in a given gene panel. The pipeline uses the gene_panel.json to specify a given gene name to an indexed codeword. Each codeword is defined based on a pattern of fluorescent signal intensities recorded across channels and cycles (see diagram on panel concepts and terms page). Some codewords are reserved for negative controls.
When selecting the codeword assigned to each gene, the Xenium panel design process attempts to keep the predicted transcript density in each cycle-channel in each known cell type as uniform as possible, using single cell reference cell type data. In particular, high expression genes that are coexpressed in the same cell type will be assigned codewords in different cycle-channels as much as possible (more details on the Getting Started with Xenium Panels page).
The fluorescent signals from all channels and cycles are compared to the codebook using a global (across all FOVs) maximum likelihood approach based on probabilistic modeling. The decoding process itself does not make per cycle-channel calls. Instead, it performs a filtering step to find codewords that are plausible matches for the puncta signal trace. It assigns probabilities to each candidate codeword based on all the intensity information at the spatial location and chooses the most probable. This approach considers attributes such as puncta location, their color and cycle of detections, and signal intensities.
The XOA v3.0 algorithm increased the sensitivity of transcript detection in transcript dense regions (see here). The v3.0 pipeline also improved the filtering of puncta signal traces to remove lower probability codewords that are detected at the same location as higher probability codewords. This filtering was introduced to maintain the false positive transcript detection rate at an acceptable level. Starting in XOA v3.2, the algorithm is better at retaining signal from two real transcripts in close proximity. False positive puncta signal traces that were removed in XOA v3.0 - 3.1 are now included in outputs as transcripts with a calibrated Q-Score of 0. This does not affect the counts in the cell_feature_matrix outputs, since those only include high-quality transcripts. However, it will decrease the "Percent of all gene transcripts that are high quality" metric and the "mean calibrated quality of gene transcripts" values for a handful of genes in the Gene-Specific Transcript Quality plot of the analysis_summary.html.
The cell-feature matrix and Xenium Analyzer's secondary analyses only include transcripts with a Q-Score ≥ 20. Final Q-Scores are reported in the transcript data output files.
A Phred-style calibrated quality score is assigned to each decoded transcript to signify the confidence in the decoded transcript identity. The quality score is derived from the likelihood of the maximum likelihood codeword (i.e., the codeword that best explains the observed data), compared to the likelihood of other sub-optimal codewords. This yields a raw Q-Score. Codewords are then mapped to targets using the gene panel information.
Final Q-Scores are obtained first by putting the full range of raw Q-Scores into bins. Then, the raw Q-Scores in each bin are calibrated by the proportion of "Negative Control Codewords" in the bin. A final Q-Score is assigned to each raw Q-Score bin, to ensure that Q-Scores in each bin are correctly calibrated. Control codewords are built into the process to ensure that the final Q-Scores are accurately calibrated.
- Negative control codewords are codewords in the codebook that do not have any probes matching that code. They are chosen to meet the same requirements as regular codewords and can be used to assess the specificity of the decoding algorithm.
- Negative control probes are probes that exist in the panels but target non-biological sequences. They can be used to assess the specificity of the assay. They were screened against the human and mouse transcriptomes and showed no predicted binding.
- Genomic control probes are probes that are designed to bind to intergenic genomic DNA but not to any transcript sequence present in the tissue. They are present in the Xenium Prime assay.
- Unassigned codewords are unused codewords. There is no probe in a particular gene panel that will generate the codeword.
- The Deprecated codewords category is assigned to codewords that are not used in the Xenium Onboard Analysis pipeline.
After decoding, the results are combined from all FOVs. Duplicate decoded transcripts in overlapping regions between adjoining FOVs are reconciled into one transcript, based on a nearest neighbor analysis that considers transcript identity and Q-Score. The deduplicated transcripts are assigned global coordinates based on the reference morphology image obtained from the DAPI image processing step (morphology.ome.tif).
Decoded and deduplicated transcripts in 3D with Q-Scores ≥ 20 are assigned to directly overlapping segmented cells to produce a cell-feature matrix. This matrix can be analyzed using conventional and novel single cell and spatial analysis approaches, facilitating integration with existing single cell and spatial datasets.
Xenium Onboard Analysis performs secondary analysis on the cell-feature matrix to generate PCA, UMAP, graph-based and K-means clustering, and differential expression analysis results. t-SNE projection is not supported in Xenium onboard analysis. Click the links below to read about the algorithms used to generate secondary analysis results: