Image processing begins by mapping known physical features on the glass slide surface (fiducials) to set the image coordinate system. The instrument then identifies the upper bound of the tissue section to find the location of the first Z-slice. These pieces of information collectively determine the range of Z-slices to image. This process has been robust to all tested sections and tissue types.
The DAPI image process produces a complete 3D morphology image (the morphology.ome.tif output file) for each of the stained regions and determines the reference image volume that cells are segmented from and decoded transcripts are assigned to.
First, the lens distortion in internal sensor data is corrected. This is done computationally based on instrument calibration data, which are collected in order to characterize the optical system and are saved on-instrument. Next, the Z-stacks from internal sensor data (0.75 µm step size) are further subsampled to a 3 µm step size. This subsampling step size was determined empirically to be a useful resolution for cell segmentation quality.
Shared image features are then extracted from the regions where FOVs overlap. Feature matching is performed to estimate the offsets between adjoining FOVs. The offsets are used to ensure consistent alignment across the image (global alignment).
Finally, the 3D DAPI image volumes (Z-stacks) generated across FOVs are blended together to construct a stitched volume that is used for nucleus segmentation.
The DAPI and multi-tissue stain image processes produce 2D projections for each image stain (output in the morphology_focus/ directory). The DAPI focus image is based on the DAPI image captured in the cell segmentation cycle if the Cell Segmentation Staining workflow is used (described below), otherwise it is from cycle 1.
The steps described below also apply for the cell segmentation and protein images acquired following the Xenium In Situ Gene and Protein Expression with Cell Segmentation Staining assay. Additional Xenium Protein image processing algorithm steps are described on this page.
This algorithm step is performed for tissues prepared with the Multi-Tissue Stain Mix following the Cell Segmentation Staining workflow (see CG000749, CG000760), or CG000819.
After RNA imaging cycles, two cycles are added to the on-instrument analysis workflow to image the cell membrane boundary stains and interior cell stains for multimodal cell segmentation.
- The first added cycle captures DAPI and the other stain channels in a blank state.
- The second added cycle captures DAPI and the other channels with their respective stains present.
The DAPI images from these additional two cycles are then aligned to the cycle 1 DAPI image so they are in the same coordinate system. Next, the background "blank" images are subtracted from the stain images for each of the multi-tissue stain channels, which helps to offset the effects of autofluorescence. Background subtraction is performed for the multi-tissue stain images, not the DAPI image.
In XOA v3.0, background thumbnail images are displayed in the analysis_summary.html Image QC gallery. Downsampled images are available in the aux_outputs/ directory (i.e., background_01_[channel].tiff).
This algorithm step is based on multi-focus image fusion techniques* to generate an all-in-focus stitched, 2D projection for each stain image (i.e., cell segmentation: boundary, interior RNA, and interior protein; DAPI; protein). It includes the following steps:
- In 16 x 16 pixel patches, the algorithm selects the best in-focus Z-slice from the aligned multi-channel stain image Z-stack, which has a 0.75 µm step size and includes the DAPI, background, and cell segmentation stain channels. This process is applied to every FOV selected for analysis.
- The focus finding process then generates a global focus map based on all these channels, which is applied across every channel and cycle.
*Review articles such as this one provide some background information about multi-focus image fusion methods.
Seven Z-slices are sampled around the global focus map. Then, deconvolution and background removal are applied, and the middle slice of the volume is selected. This step improves resolution and contrast of images such that they appear sharper and have lower fluorescence intensity values (i.e., when visualized in Xenium Explorer).
Cell segmentation images undergo a masking step that uses information from the background images to identify and mask saturated pixels.
A spectral crosstalk correction is applied to remove signal bleedthrough from other channels for all cell segmentation stain images. Different spectral channels can interfere with each other. This step corrects that bleedthrough by removing the predicted contribution of each of the fluorophores from channels that are not intended to detect them.
Finally, the results are stitched together to generate a 2D projection image for each stain. These processed images are provided in the Xenium Onboard Analysis output bundle as multi-file OME-TIFF files, one per channel, in the morphology_focus/ directory. The directory will contain the nuclei DAPI stain image, as well as any additional stain images for Xenium outputs generated with the multimodal cell segmentation and protein assay workflows. Outputs are described here.
The goal of RCA product image processing is to detect and filter puncta and correct distortion. Performed for every channel and cycle, the 3D image volumes (Z-stacks) obtained for each FOV are processed to detect the puncta in 3D space that correspond to labeled RCA products. Images are currently captured in four color channels and n cycles depending on the assay.
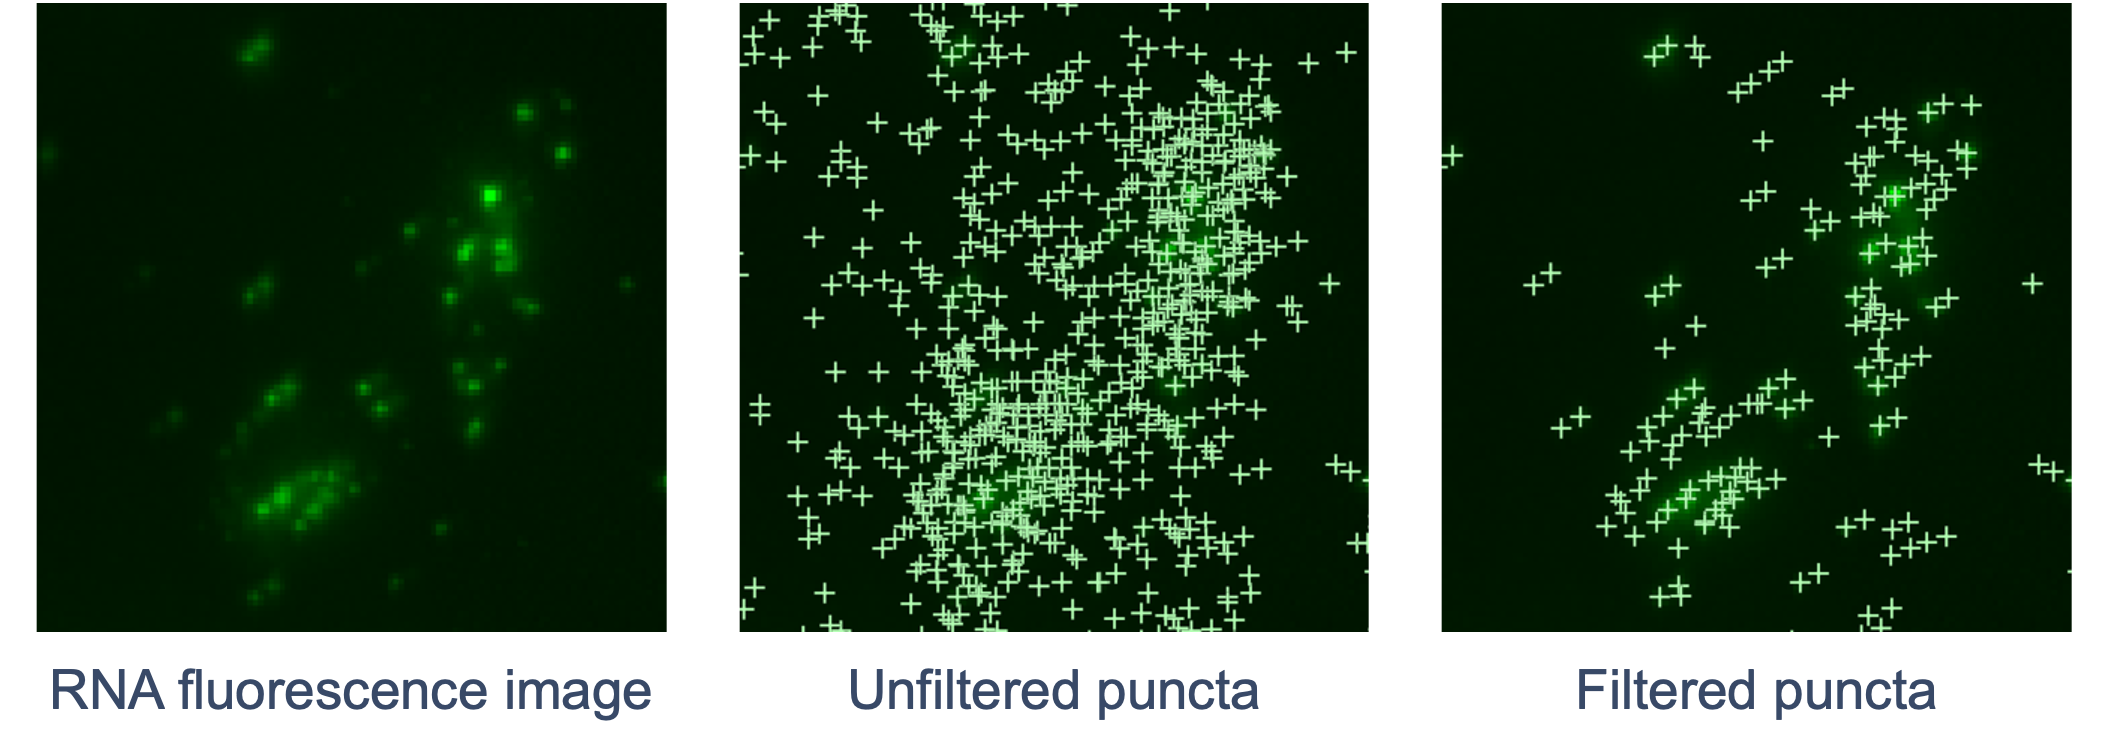
The RNA fluorescence image is scanned for punctum signals that stand out from the local background. The XYZ coordinates of each punctum are refined by examining local brightness. The signal intensity of the punctum is determined based on a fitted shape. Xenium Analyzer instrument-specific calibrations are made to adjust the optical system’s point spread function (PSF) model. This calibration enables increased detection and localization of puncta in transcript-dense regions and near the edges of FOVs, effectively minimizing FOV-related artifacts like roll-off.
Next, the pipeline filters out puncta that are unlikely to be true transcripts (non-punctate or low quality signals). Similar to DAPI images, curvature distortion is corrected.
- Zafar R, Farid MS, and Khan MH. Multi-Focus Image Fusion: Algorithms, Evaluation, and a Library. J Imaging. 6:60, 2020.