The analysis_summary.html file generated by the Xenium Onboard Analysis pipeline should be among the first output files a researcher looks at after running the Xenium instrument. This file serves three purposes:
- Provides a convenient portable overview of data
- Highlights summary metrics and plots that researchers can use to quickly QC data
- Contains information that 10x Genomics support can use for troubleshooting
Where can I find the analysis summary?
The analysis_summary.html file can be found on the instrument after the run completes (see the Xenium Analyzer User Guide).
- After the run is complete, data generated across all the runs can be accessed under Menu > Open Settings > Runs.
- Click Open Output Folder Location to access the top-level output folder on the desktop. Click the individual runs to open a run-specific screen.
- To access the region-specific output folder, click Open Region Folder.
- The
analysis_summary.htmlis available in the View Analysis Summary folder.
The analysis_summary.html file can be viewed on the instrument, on any web browser, and in Xenium Explorer.
At the top of the analysis_summary.html, there is a banner with the Run name and Region name, which were inputs on the instrument during the Initialize Instrument step (see the Xenium Analyzer User Guide). The Run start time, which is time-stamped by the instrument, is also shown (in UTC). There are five tabs: Summary, Decoding, Cell Segmentation, Analysis, and Image QC. The default view begins on the Summary tab.

When certain metrics fall below key thresholds, warning () or error () alerts will be shown below these tabs.
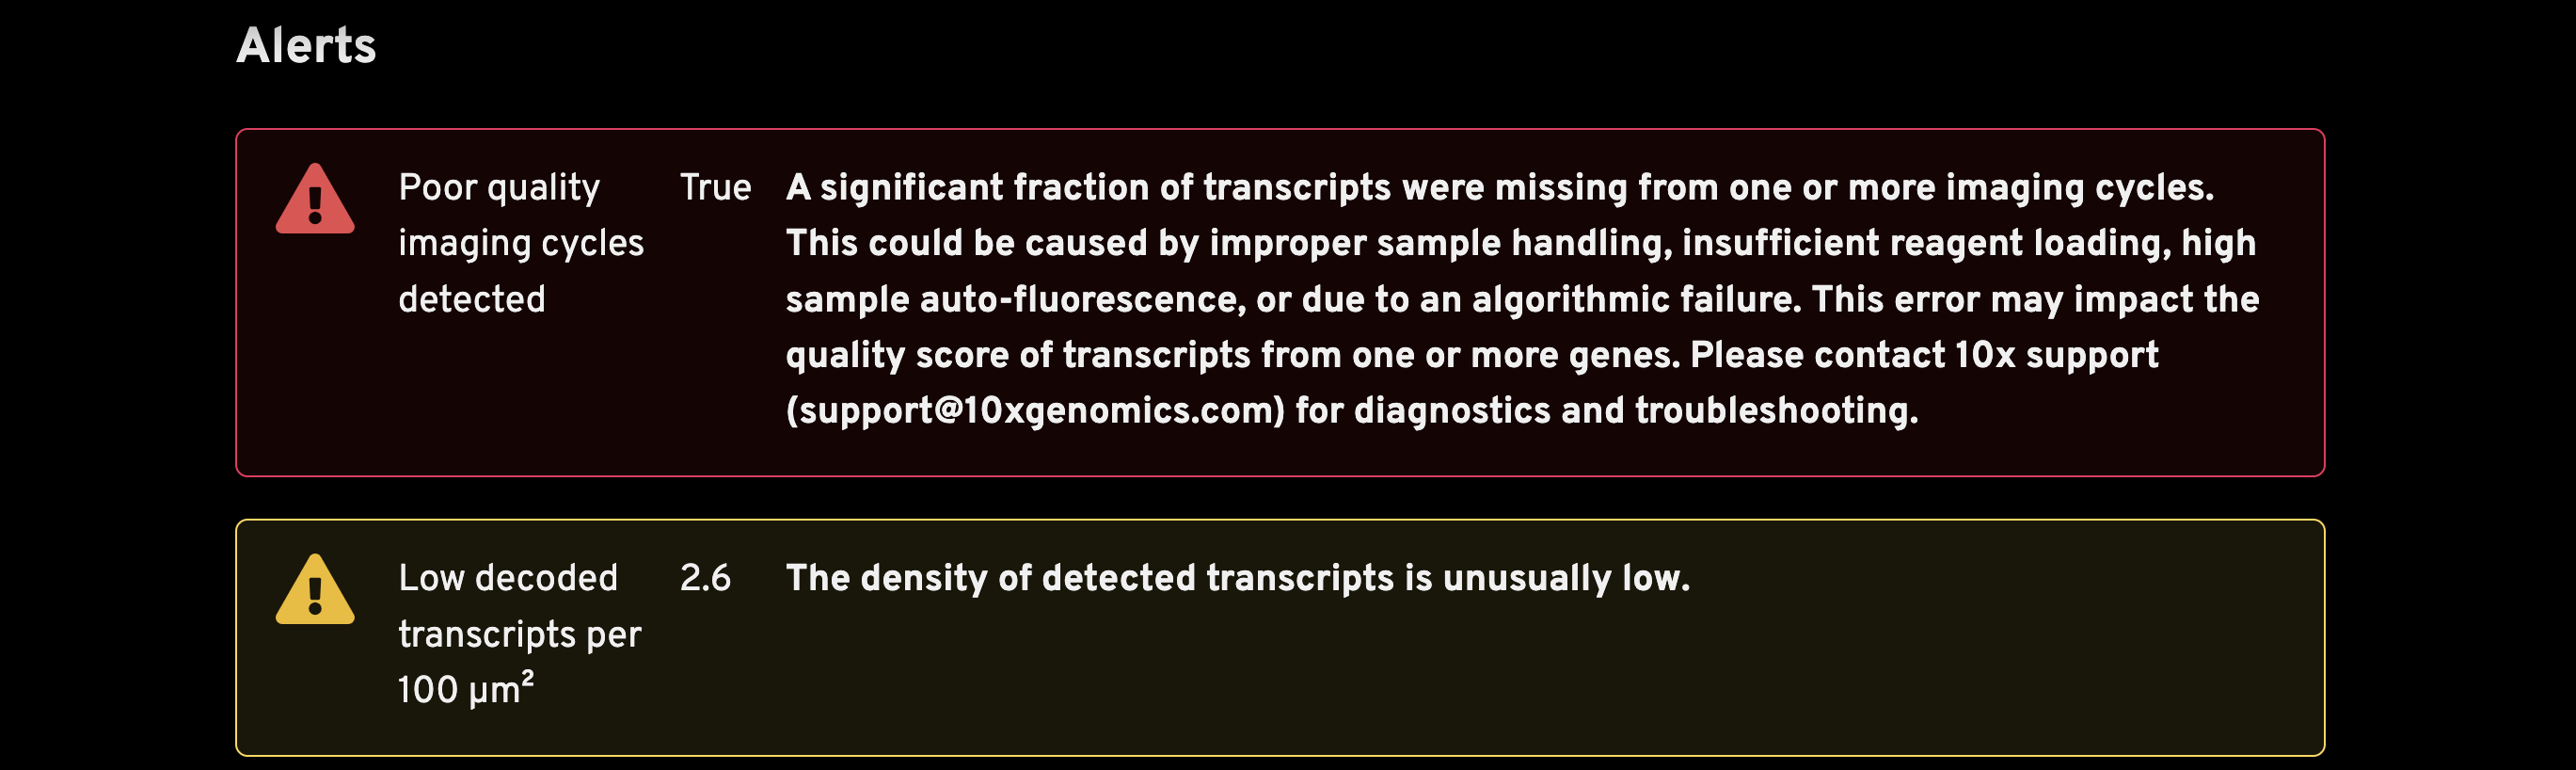
Learn about the alert types, thresholds, and guidance suggestions here:
The Key Metrics panel is the starting point to QC your data and to spot outliers among multiple runs at a glance. These metrics are often helpful indicators if there is a problem with the data.
There are no universal thresholds for these metrics as interpretation requires some understanding of the sample and gene panel used. Researchers should have some understanding of how many cells are expected given the tissue size and type. Here are some important considerations for interpreting key metrics:
- Median transcripts per cell and decoded transcript density will depend on tissue type and the selected gene panel (e.g., a 300-gene panel will have more transcripts than a 50-gene panel).
- The number of cells detected will depend on tissue type and the size of the region of interest (ROI) selected on the instrument in the analysis.
| Metric | Description |
|---|---|
| Number of cells detected | The expectation for this metric depends on the tissue sample. |
| Median transcripts per cell | The median number of transcripts per cell. Cells with zero transcripts are excluded from the calculation. This metric is expected to be lower if the selected gene panel does not match the tissue type. |
| Nuclear transcripts per 100 µm2 | The high-quality, decoded-to-gene, nuclear transcript count divided by the total segmented nuclear area, normalized to a 10 x 10 µm area by multiplying by 100. |
| Total high quality decoded transcripts | The total number of decoded gene transcripts that decode with high quality (≥ Q20). |
The Sample Region Summary (left) shows the Region name, Slide ID, and Cassette name, which are required inputs during instrument initialization (see the Xenium Analyzer User Guide). Preparation method, also input during instrument initialization, is optional.
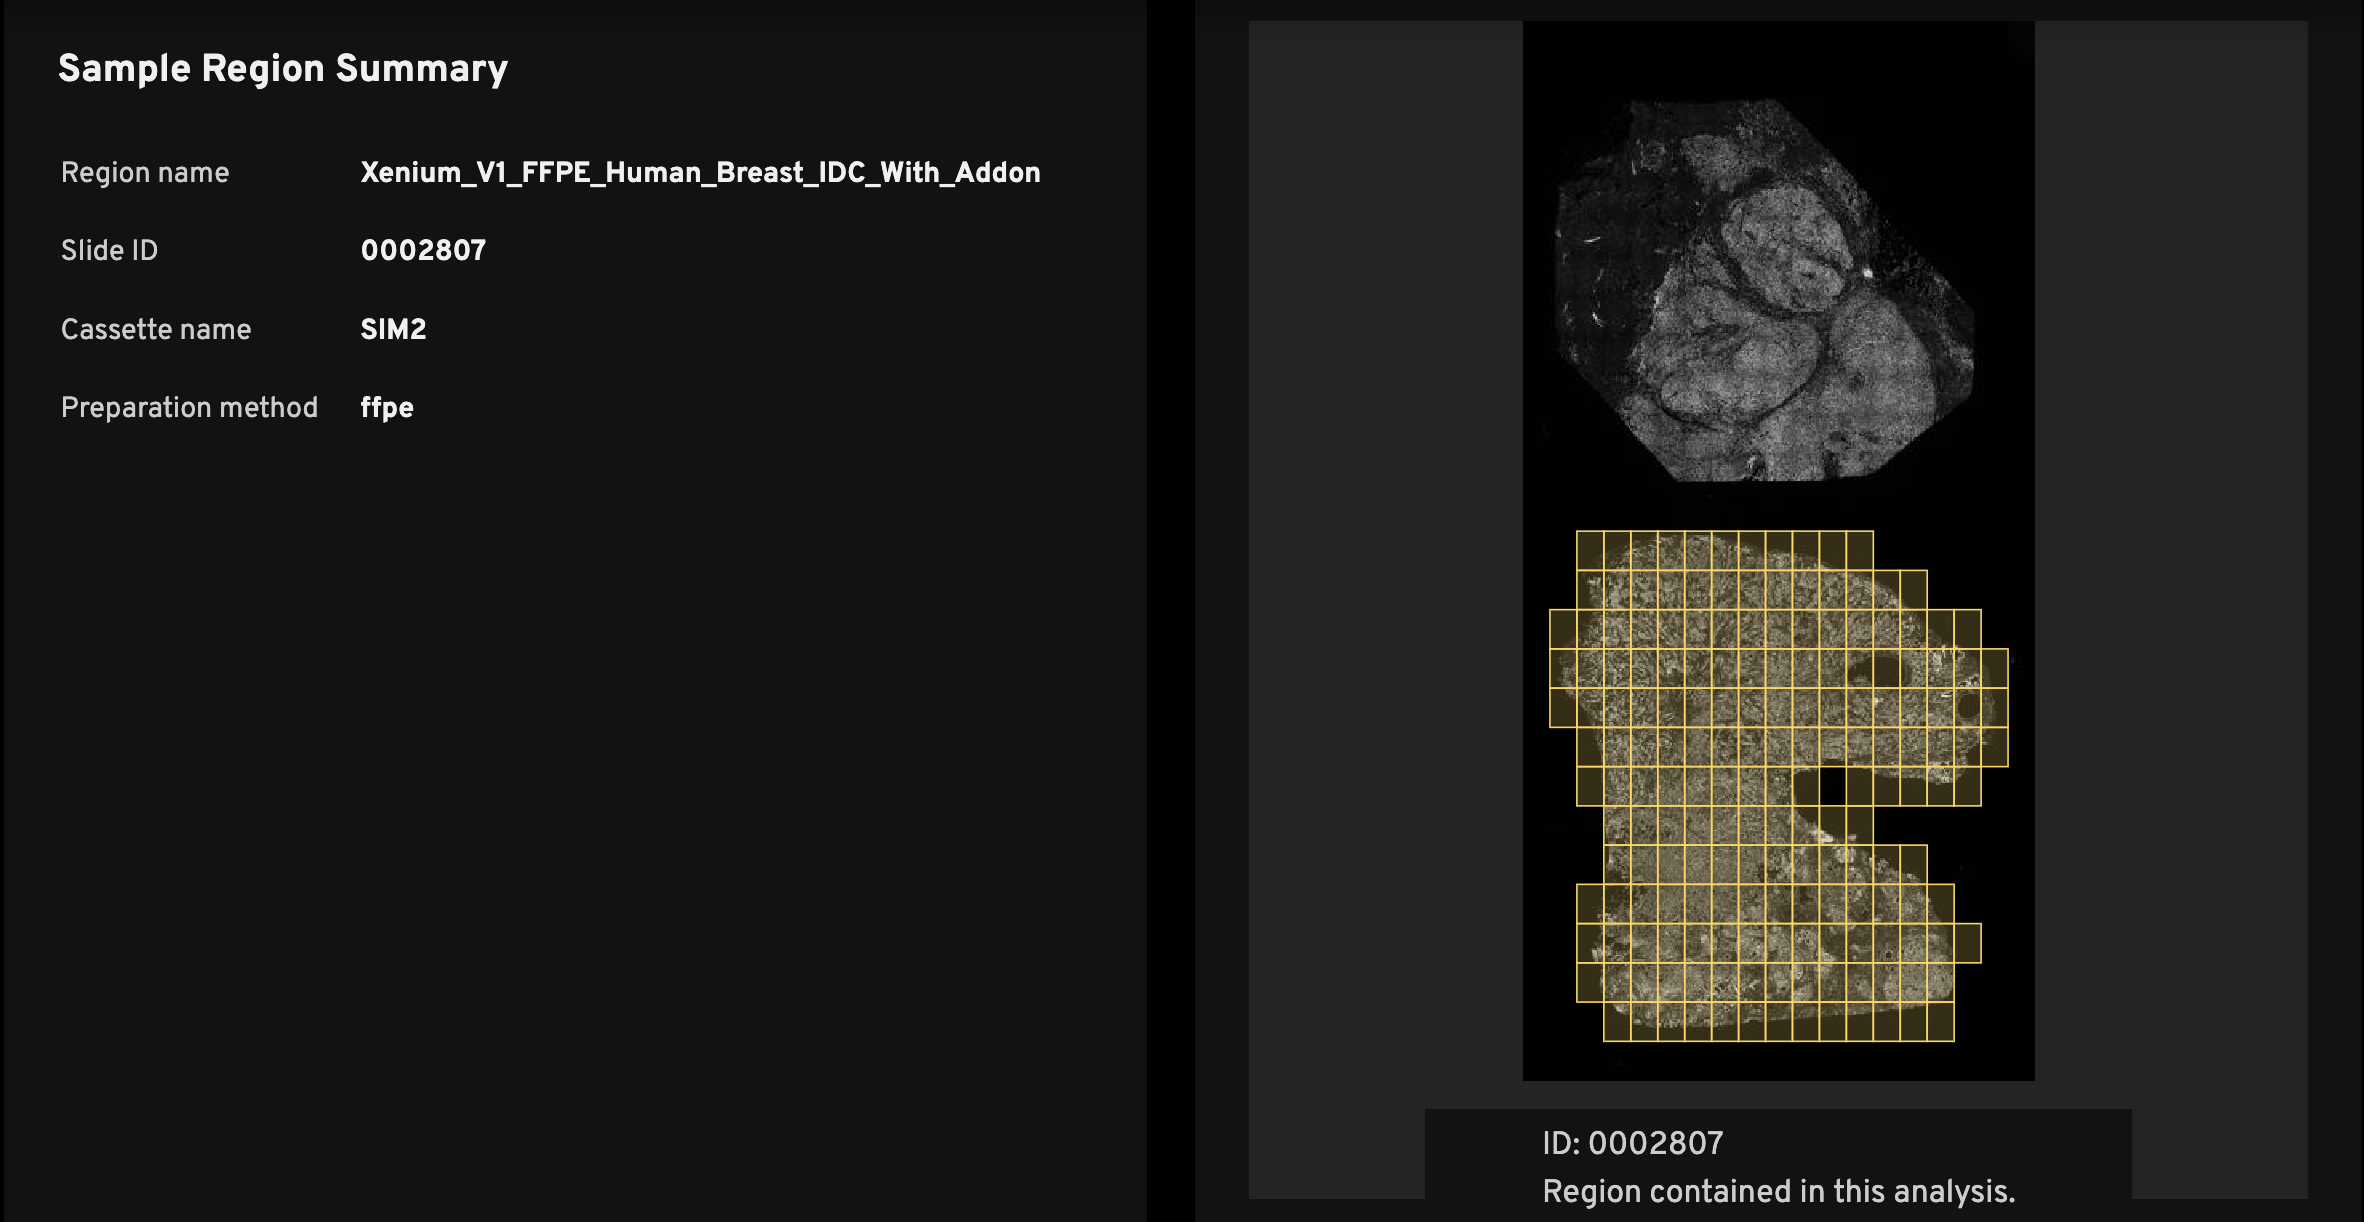
Every analysis_summary.html file has an overview scan (right), which shows the nuclei-stained (DAPI) image. The slide ID is displayed below the overview scan image (ID:). This ID location indicates the slide orientation, as it matches the relative location of the ID on the physical Xenium slide.
The purpose of the image is to help researchers quickly identify the tissue region on the slide that was used to generate the data in the Xenium output bundle. For example, if you have three mouse brain replicates on a slide, the overview scan quickly shows which among the top, middle, or bottom replicates the summary metrics correspond to.
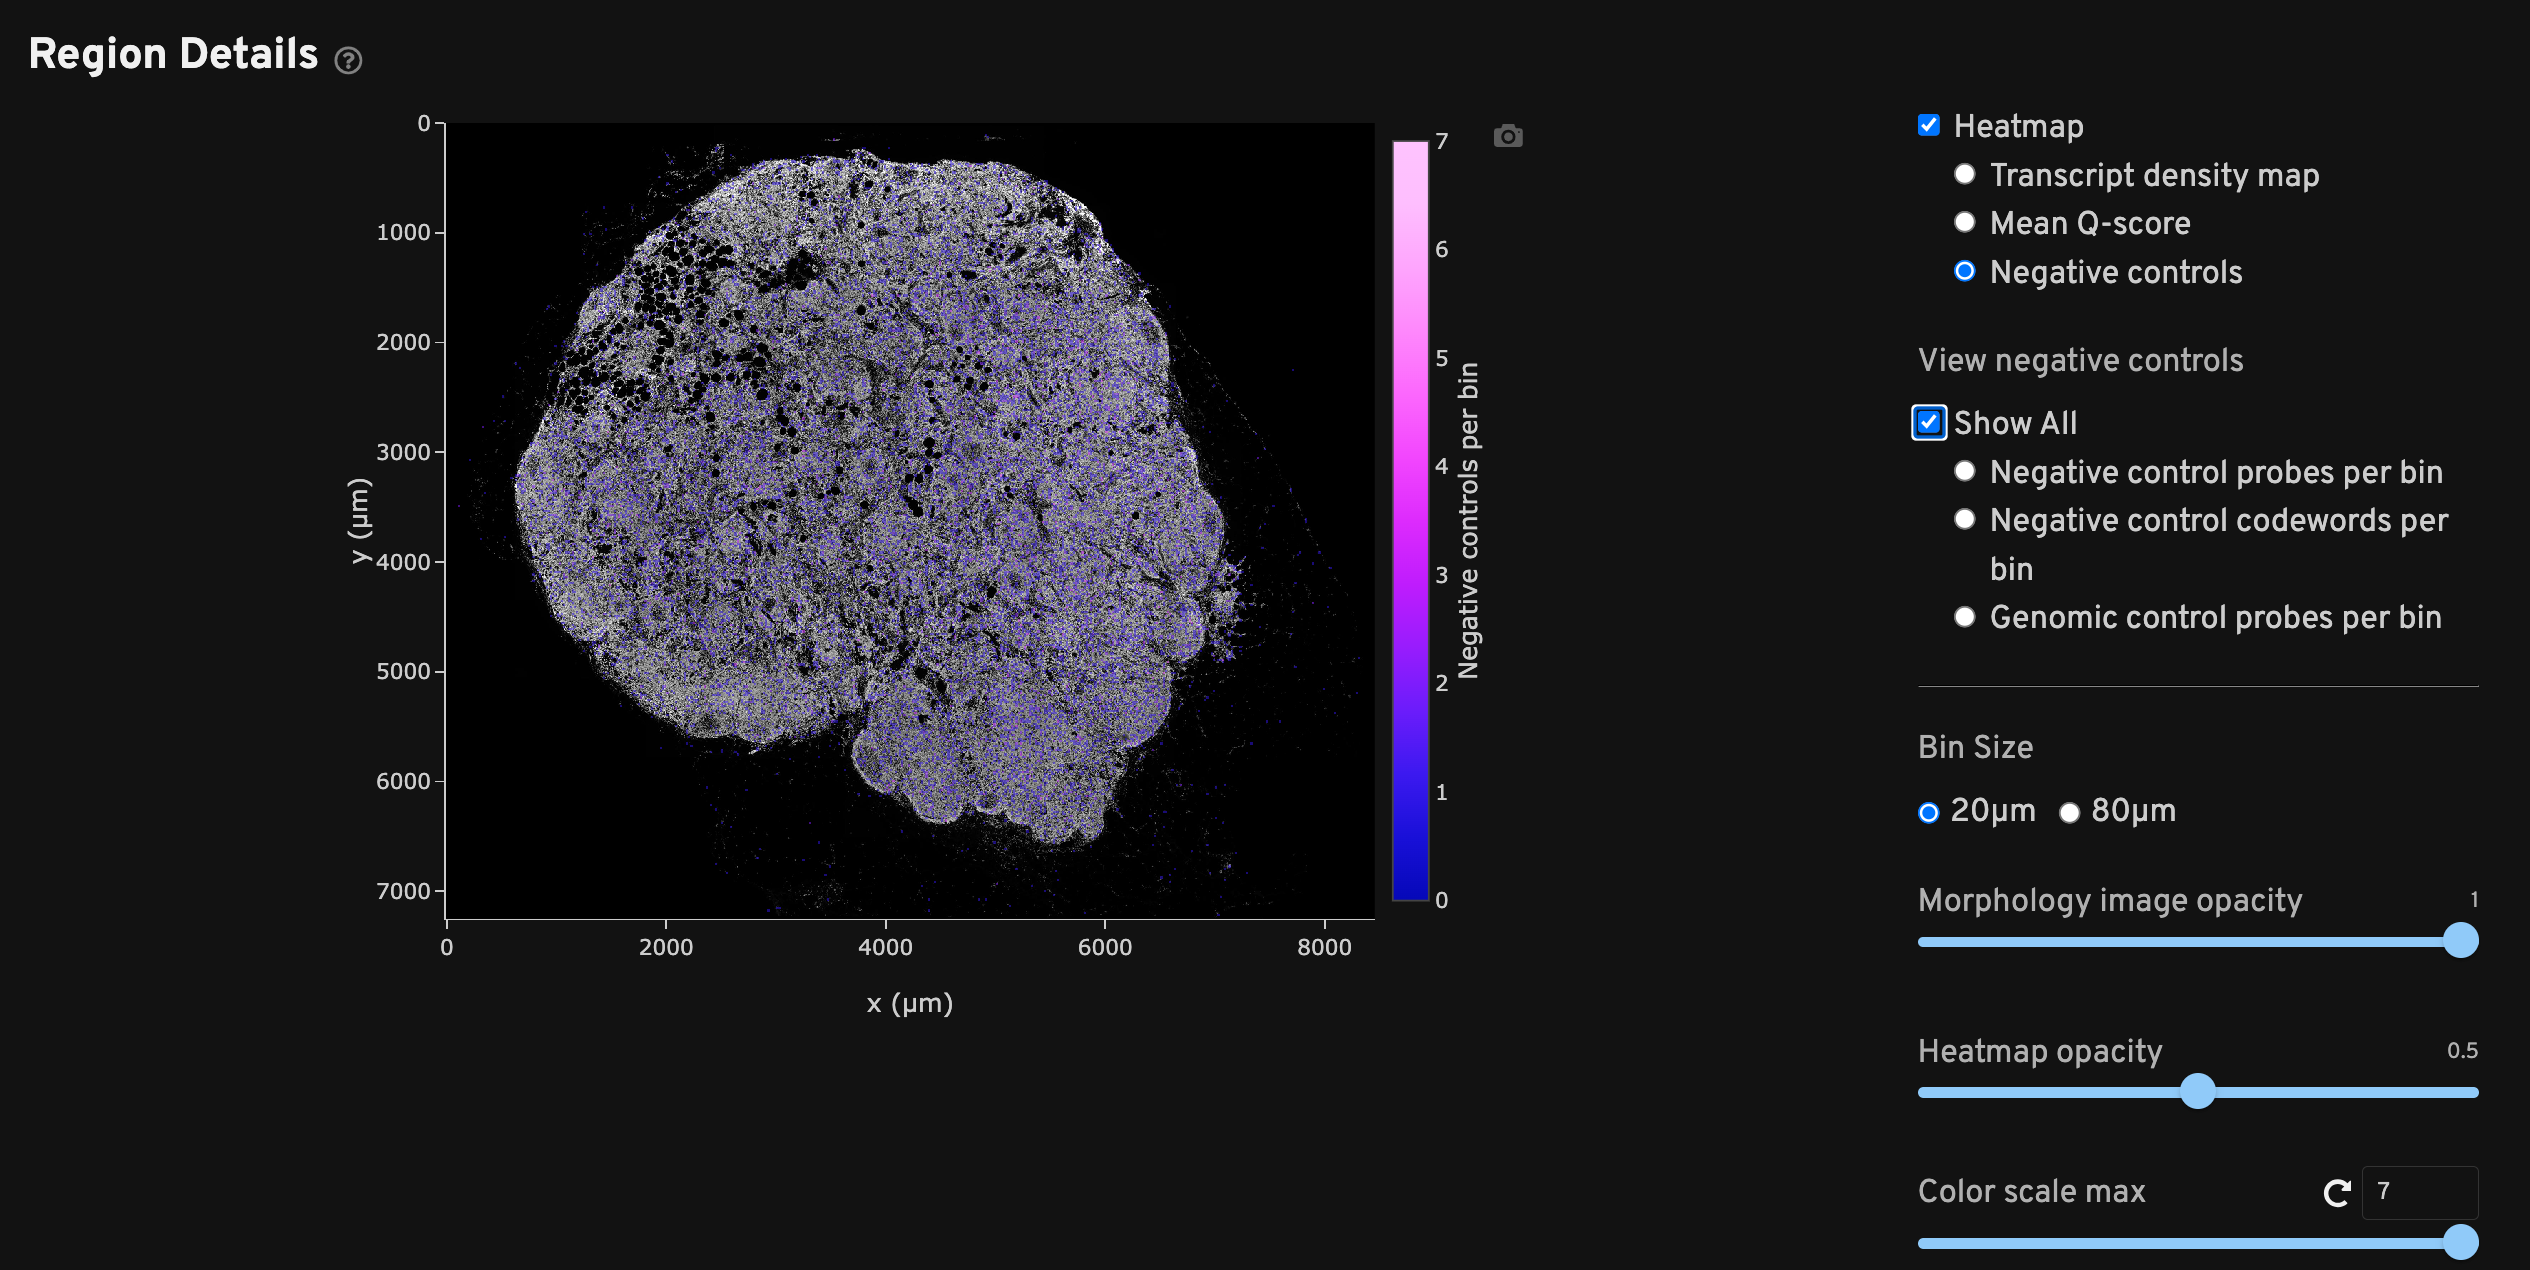
The Region Details view shows a DAPI image of the analyzed region along with a heatmap overlay that provides a spatial distribution of several metrics per bin. Checking each heatmap separately may help troubleshoot issues that aggregated metrics could miss.
Each heatmap can be adjusted to two bin sizes (20 µm x 20 µm or 80 µm x 80 µm length square bins) and various opacities as needed. The 20 µm2 bins generally maintain high resolution while smoothing out noise, while the 80 µm2 bins help when viewing sparse data such as negative control metrics. Scroll to zoom in/out of the DAPI image and show transcript information per bin.
This view can be used to QC a variety of common sample preparation issues:
- Does the DAPI morphology image look as expected?
- Were there any tears in the tissue or detachment of tissues from the slide?
- Depending on sample type, does the general transcript density match the tissue morphology? For example, if the tissue is a mouse brain, one would expect to see particularly high density in the hippocampus.
Transcript density spatial map shows binned high quality decoded transcripts.
The Mean Q-score spatial map shows binned average decoded transcript Q-Scores across the sample area. This plot can be used to identify any technical artifacts associated with one or more fields of view (FOVs). It is normal for mean Q-Score to be low in bins that do not overlap with the tissue and thus have few or no transcripts.
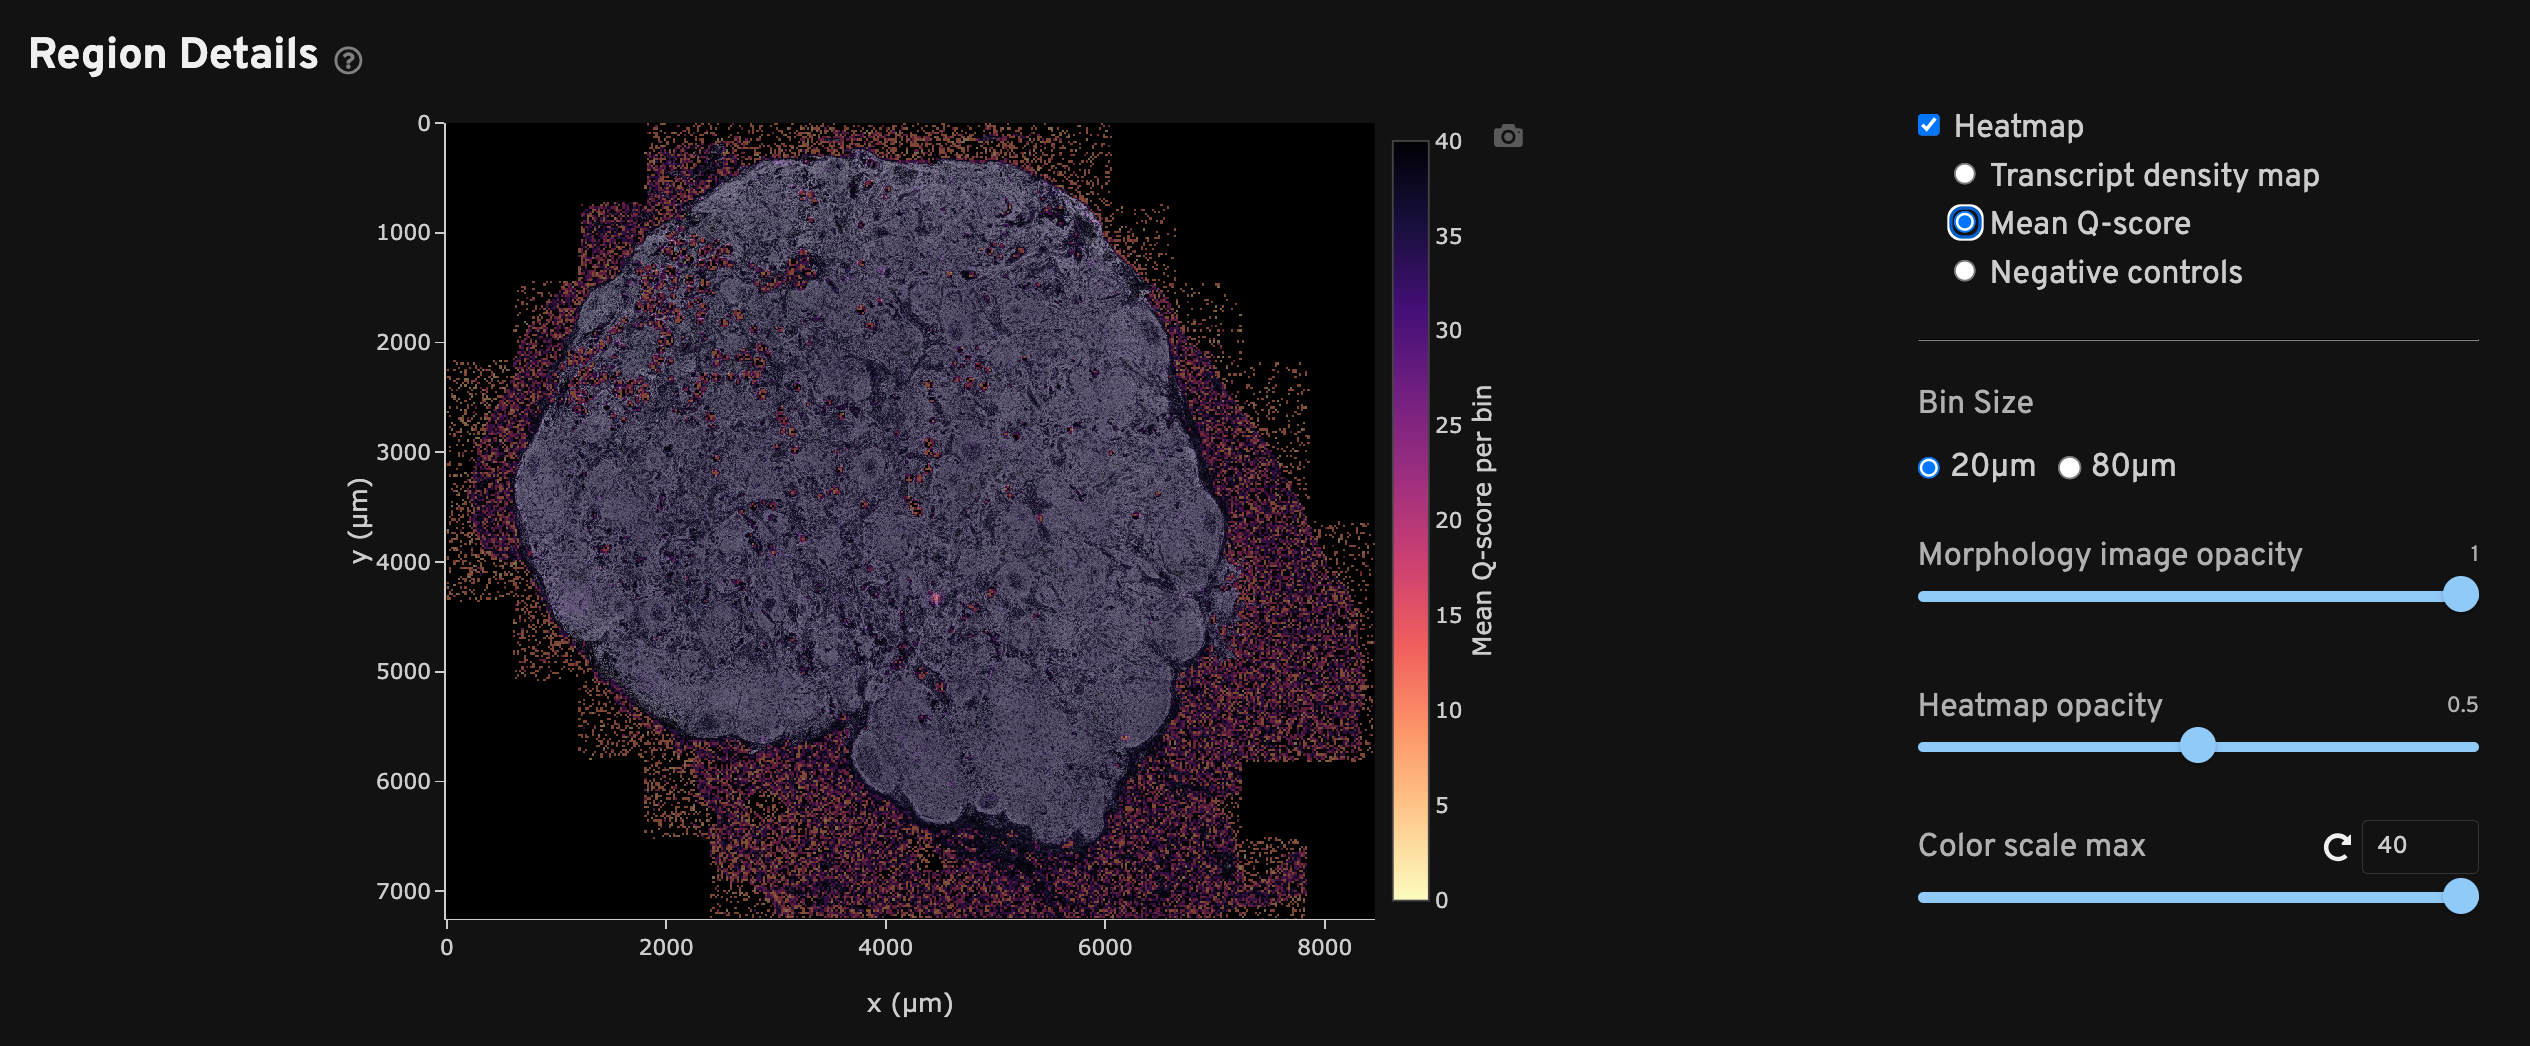
Negative controls spatial map shows binned counts of negative controls. "Show All" displays all negative control categories together. Select the radio buttons to view just the counts per bin for negative control probes, negative control codewords, or genomic control probes separately. This plot should ideally show a roughly equal spatial distribution of low counts across the sample area. The plot may indicate potential issues if counts are localized, outside the tissue area, or if counts are high.
The Run Information section is meant to help researchers quickly determine key metadata regarding the run.
| Metric | Description |
|---|---|
| Run name | A unique identifier that was input in the instrument during the Initialize Instrument step (see the Xenium Analyzer User Guide). |
| Cell segmentation | The stain method used for cell segmentation: "Xenium Multi-Tissue Stain" or "Nuclei (DAPI)". |
| Run start time | The time recorded by the Xenium Analyzer instrument (in UTC). |
| Region area (µm2) | The total area of imaged field of views (FOVs); the area of each FOV with tissue is summed. |
| Total cell area (µm2) | The summed area of detected cells; used for calculating transcript density (Decoded transcripts per 100 µm2). |
The Software section shows key metadata for troubleshooting purposes. 10x Genomics continually updates the instrument and analysis software on the Xenium instrument to introduce new features, fix bugs, and provide the best user experience.
| Metric | Description |
|---|---|
| Instrument software version | The version of firmware software used on the instrument (tracks instrument user interface changes as well). See release notes for updates. This instrument software version may not exactly match the analysis version. For example, the instrument software may be updated, but if no changes are added to the analysis software, the analysis version will not change. |
| Analysis version | The version of the Xenium Onboard Analysis pipeline that performs cell segmentation, decoding, and secondary analysis, and generates output files, including this analysis_summary.html. See release notes for updates. |
| Instrument serial number | A unique ID that may be helpful for troubleshooting with 10x Support. |
The Panel Specification section displays the Xenium panel that was used for the experiment. If the QC metrics look drastically different from what is expected, it may be prudent to double-check that the correct panel was used. The source of the metadata is the gene_panel.json file. If running a pre-designed panel, the JSON is already on the instrument. If running a custom or add-on panel, the JSON file would be produced by the Xenium Panel Designer or 10x support team and loaded onto the instrument during instrument initialization using a USB drive (see the Xenium Analyzer User Guide).
| Metric | Description |
|---|---|
| Panel name | The human-readable panel name. |
| Panel designer version | The version of Xenium Panel Designer software used to generate a custom panel (XPD release notes). |
| Design ID | A unique string ID for the panel. |
| Created by | Indicates who designed the panel. |
| Date created | Indicates when the panel design was created |
| Panel type | Specifies whether the panel is pre-designed, add-on, or fully custom. |
| Species and tissue | Indicates the species and tissue type. |
| Chemistry version | The assay chemistry version. |
| Number of target genes (RNA) | The number of genes targeted by the panel. For add-on panels, this metric is split between the total, number of "Pre-designed genes (RNA)", and number of "Custom genes (RNA)". |
| Total custom targets (RNA) | The number of custom gene targets, including any boosted pre-designed genes in parentheses. Learn more about information for boosted genes on this page |
If the data were analyzed with Xenium Ranger, a new panel will display information about the analysis:
- Run ID
- Run timestamp
- Xenium Ranger software version
- The command(s) used to analyze the data
For more information about transcript decoding, see the decoding, quality scores, and controls section of the Xenium algorithms page.
The Decoding Yield section provides QC metrics at a glance. Biological and experimental context may be needed for interpretation.
| Metric | Description |
|---|---|
| Percent of all gene transcripts that are high quality | The percent of transcripts from all genes that decode with high quality (≥ Q20). For experiments with custom panels, separate metrics are shown for pre-designed and custom genes since QC of custom genes is likely to be particularly important. |
| Total high quality decoded transcripts | The total number of decoded gene transcripts that were decoded with high quality (≥ Q20). |
| Nuclear transcripts per 100 µm2 | The high-quality, decoded-to-gene, nuclear transcript count divided by the total segmented nuclear area. |
| Thickness of high quality decoded transcripts (in µm) | The width in Z of high-quality transcripts measured in microns. The width is calculated as the difference of the 95th and 5th percentiles averaged over all the acquired fields of view (FOV). We exclude FOVs with fewer than 1000 high-quality transcripts before computing the average. This number typically ranges between 3-10 µm in tissues that are sliced at 5-10 µm. This number is proportional to the physical thickness of the tissue that is input into the assay for the same tissue type. The median high-quality transcripts per cell can be lowered when the measured thickness is lower than expected. Decoding quality scores may be affected if the tissue thickness is higher than expected. |
| Cellular transcripts per 100 µm2 | The high-quality, decoded-to-gene, cellular transcript count (including nuclear transcripts) divided by the total segmented cellular area. |
Below are descriptions for the Negative Controls metrics.
- The adjusted negative control probe rate measures both erroneous decoding and off-target binding, so it will always be greater than or equal to the adjusted negative control codeword rate. Both depend on the total number of high-quality transcripts detected, so a high value may result from lower detection of gene transcripts rather than nonspecific binding.
- Genomic control metrics are output when the gene panel includes genomic control probes and provide a more comprehensive measure of FDR as they measure erroneous decoding, off-target binding, and binding to genomic DNA (gDNA). Xenium Prime panels include genomic control probes. While the Xenium Prime assay is designed to avoid denaturing gDNA, there are other sources of gDNA that could explain high levels in some Xenium Prime data. These include sample condition (i.e., necrotic regions), sample preparation method (i.e., under fixation for FFPE tissues, tissue arrays), and/or the biology of the sample (i.e., cancerous tissues). For examples of genomic control metrics measured across a variety of samples, see the Xenium Prime 5K Gene Expression Workflow, Analysis & Data Highlights Technical Note.
For more information about negative controls, see the decoding, quality scores, and controls section of the Xenium algorithms page.
| Metric | Description |
|---|---|
| Adjusted negative control codeword rate | The estimated rate of false positives caused by erroneous decoding among high-quality (≥ Q20) transcripts. Estimated using negative control codewords such that any decoding to these codewords is definitively erroneous, and adjusted to estimate the rate of errors amongst all codewords. The rate is calculated as the fraction of high-quality transcripts that were assigned to negative control codewords, divided by the fraction of codewords in the panel that are negative control codewords. |
| Adjusted negative control probe rate | The estimated rate of false positive transcript signal caused by erroneous decoding and off-target binding among high-quality (≥ Q20) transcripts. Estimated using negative control probes that should not bind to any transcript sequence present in the tissue, and adjusted to estimate the rate of errors amongst all probes. The rate is calculated as the fraction of high-quality transcripts that were assigned to negative control probes, divided by the fraction of probe-associated codewords in the panel that belong to negative control probes. |
| Negative control probe counts per control per cell | This is the mean number of high-quality transcripts (≥ Q20) assigned to cells that were decoded as negative control probes, which are probes that should not bind to any transcript sequence present in the tissue. The mean is taken across all cells and all negative control probes. More on metric calculations here. |
| Estimated number of false positive transcripts per cell | This is the estimated mean number of high-quality transcripts per cell that do not represent true expression ("false positives"). It is estimated using the "Negative control probe counts per control per cell" metric and adjusted to estimate the number of false positives amongst all gene probes. It should be considered in the context of the total number of transcripts expressed per cell. |
| Adjusted genomic control probe rate | The estimated rate of false positive transcript signal from probes binding to genomic DNA among high quality (Phred quality score ≥ Q20) transcripts. Estimated using intergenic genomic control probes that would bind to intergenic genomic DNA but should not bind to any transcript sequence present in the tissue, and adjusted to estimate the rate of errors amongst all probes. The rate is calculated as the fraction of high quality transcripts that were assigned to genomic control probes, divided by the fraction of probe-associated codewords in the panel that belong to genomic control probes. (Provided in Xenium Onboard Analysis v3.0) |
| Genomic control probe counts per control per cell | The mean number of high-quality transcripts that were decoded as genomic control probes, which are probes that should only bind to intergenic genomic DNA. The mean is taken across all cells and all genomic control probes. More on metric calculations here. (Provided in Xenium Onboard Analysis v3.0) |
| Estimated number of false positive transcripts per cell including genomic counts | The estimated mean number of high-quality transcripts per cell that do not represent true expression ("false positives") due to decoding, non-specific probe binding, and genomic DNA binding errors. It is estimated using the "genomic control probe counts per control per cell" metric, and adjusted to estimate the number of false positives amongst all gene probes. (Provided in Xenium Onboard Analysis v3.0) |
For each gene, the Gene-Specific Transcript Quality plot shows the total number of decoded transcripts of any quality (x-axis) against the mean quality of those decoded transcripts (y-axis). The x-axis (total transcripts per gene) is plotted on a log10 scale, while the y-axis is on a linear scale. Click on a gene or negative control category in the legend to hide it from view.
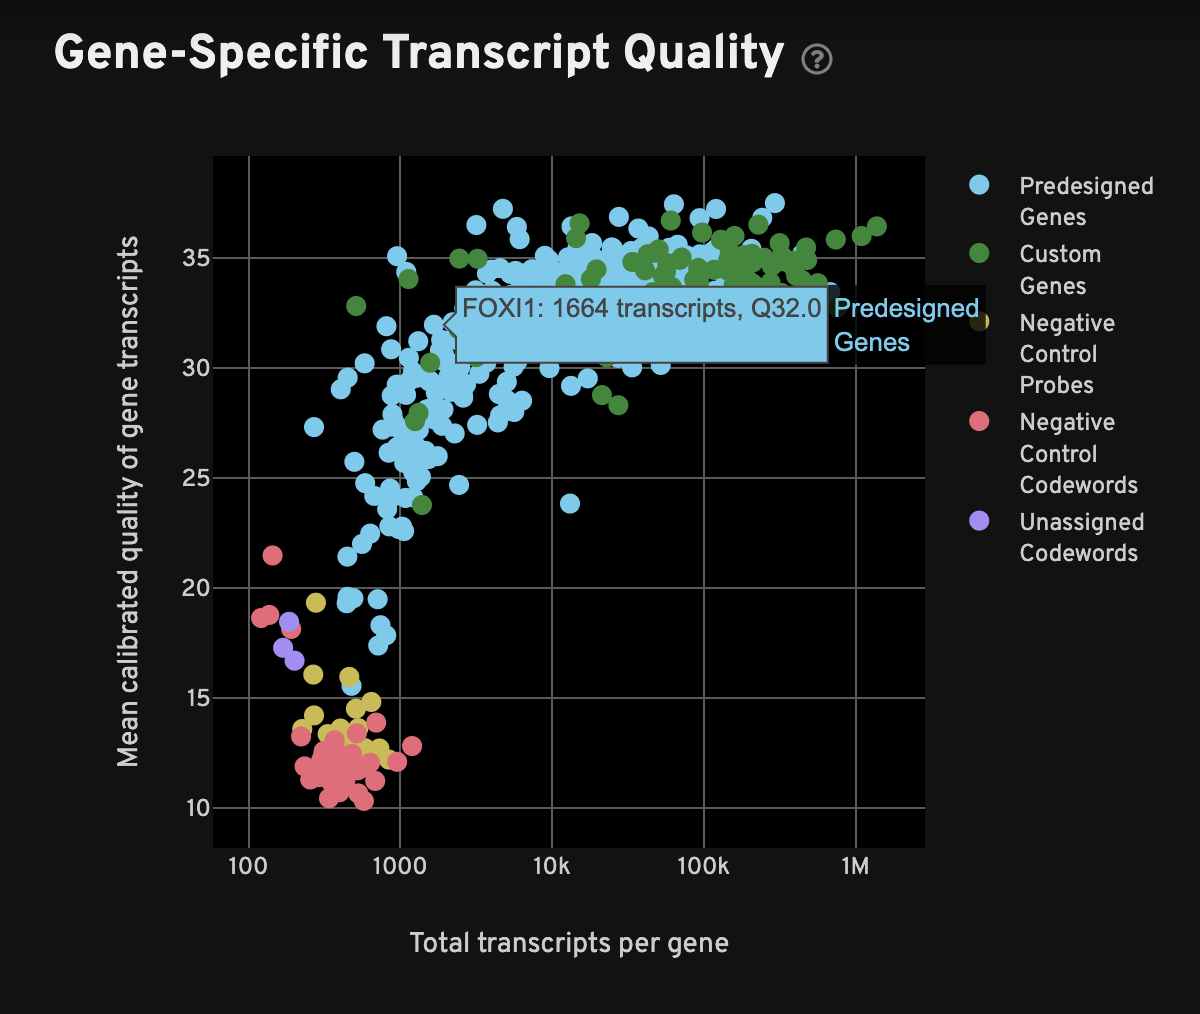
When interpreting this plot, one would typically expect to see all or most genes have mean quality scores ≥ 20, and the controls should be < 20; in other words, genes should be at the top-right quadrant and controls should be in the bottom-left quadrant. Examine genes, especially custom genes, in the panel for any performance problems (i.e., low density or low mean Q-Score may indicate problems in the performance of a given gene).
Negative controls for both decoding and probes should have low transcript counts and low quality:
- A high rate of negative control codewords may indicate possible imaging issues, such as autofluorescence in one or more cycle-channels that are part of a negative control codeword. Check the RNA images in the
aux_outputs/directory. - High quality and count of all negative control probes may indicate assay workflow issues, such as nonspecific probe hybridization or ligation conditions. It is ok if only a few negative control probes show high quality and/or count.
Data with quality scores < 20 are filtered from the cell-feature matrix, and downstream analyses using the matrix file, but these filtered transcripts can still be found in the transcripts files. For more information, see Understanding Xenium Outputs.
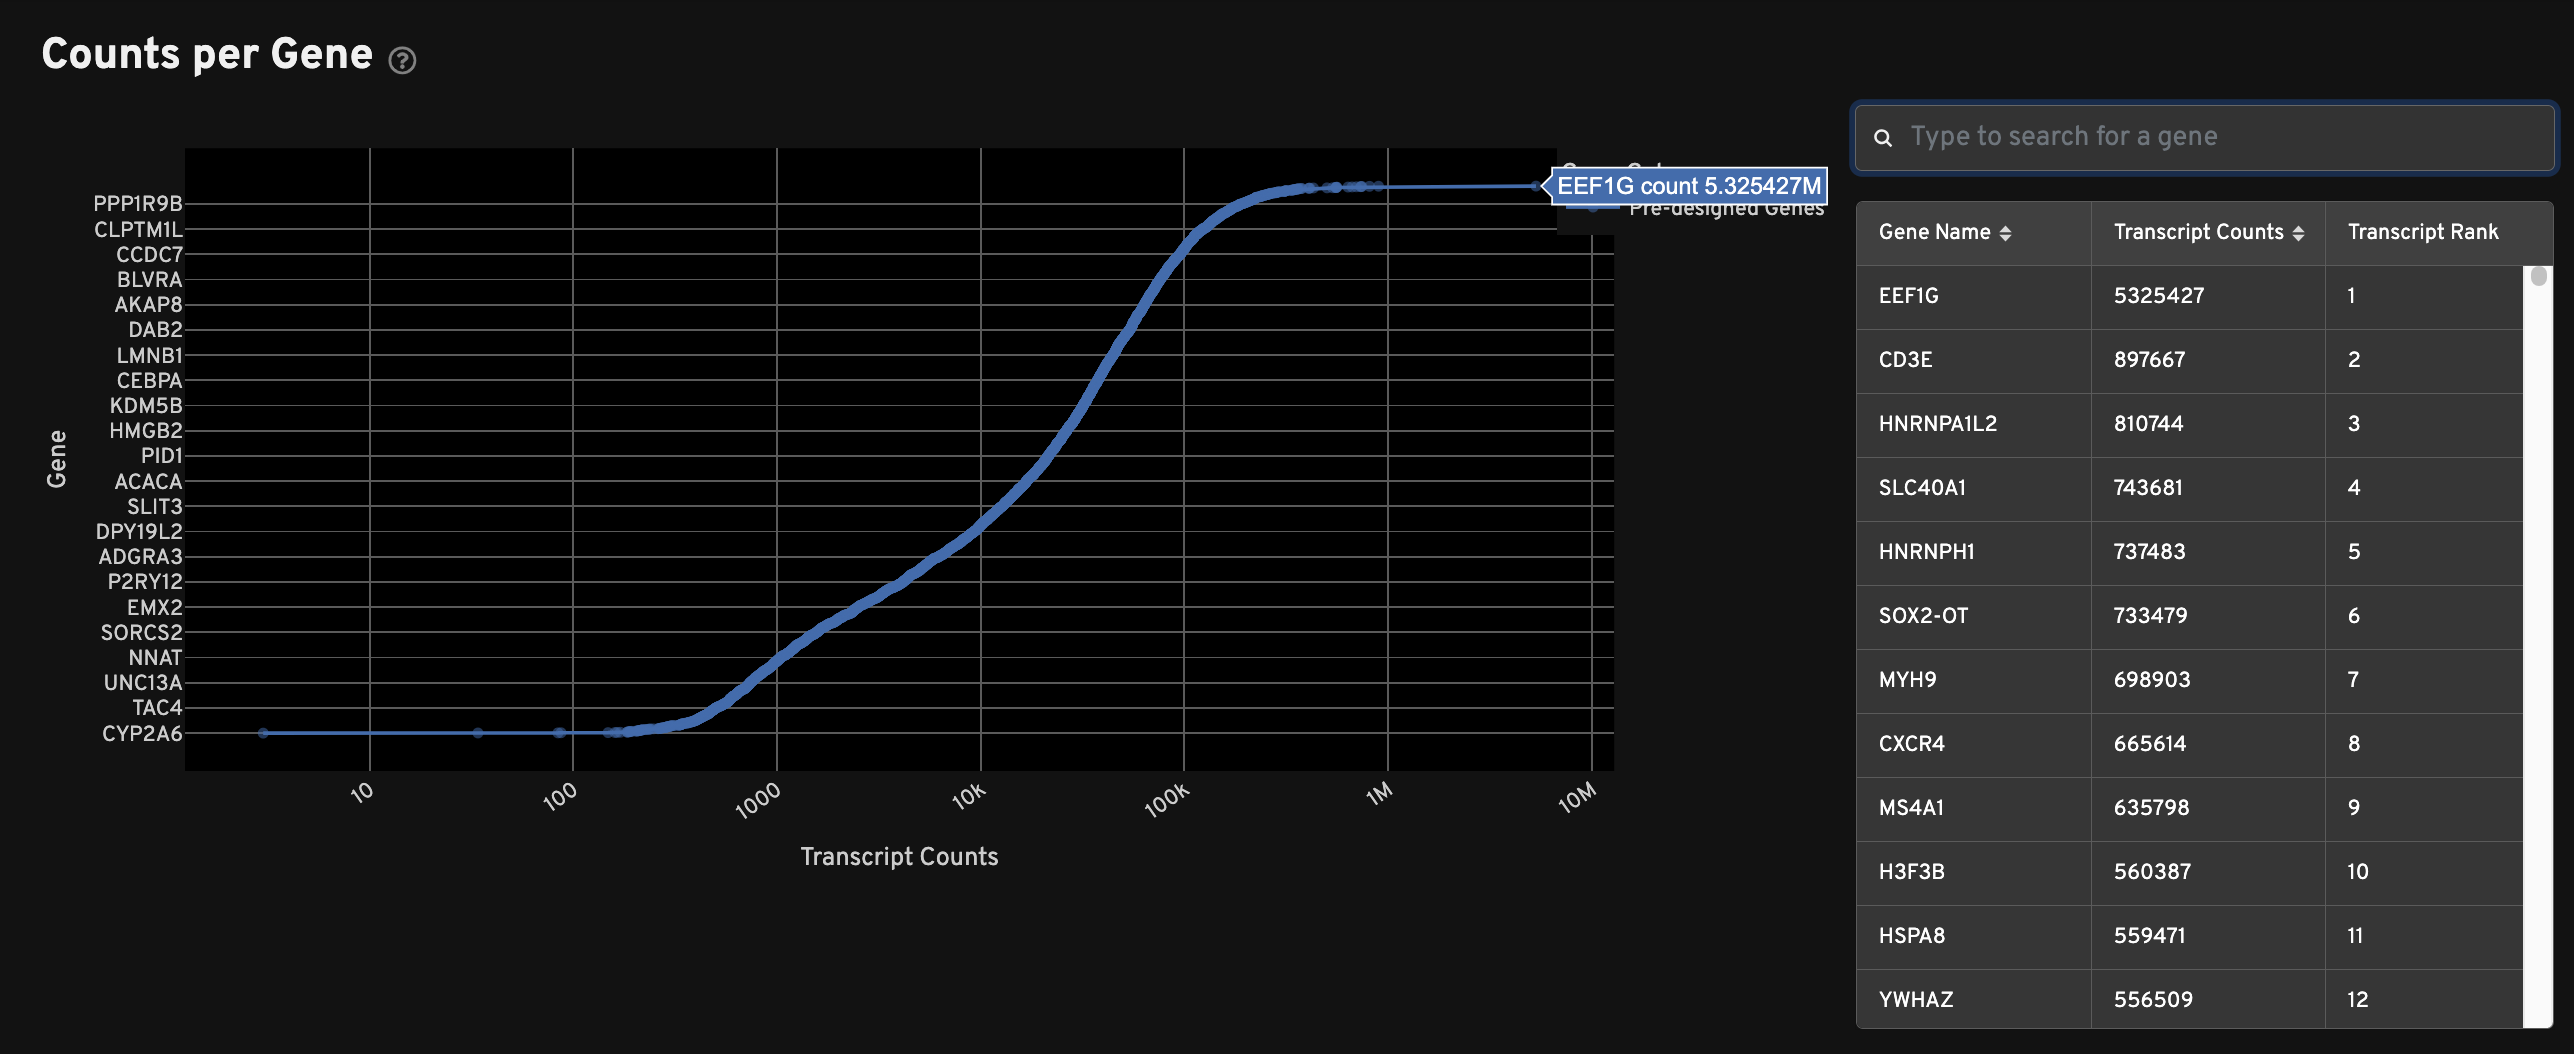
The Counts per Gene plot shows the total number of transcripts passing quality thresholds for every gene in the panel. This plot shows absolute counts of decoded transcripts (x-axis) by gene (y-axis). Genes are ranked by transcript count. Search for specific genes in the search window to the right of the plot. Sort by gene name or transcript count. The "Transcript Rank" column indicates a gene's place in the overall rank of transcript counts.
This plot can be used to quickly compare multiple samples analyzed with the same panel, or to quickly compare pre-designed vs. custom panels.
The purpose of cell segmentation is to approximate cell boundaries so that transcripts can be assigned to cells. Downstream, these results will be used to produce a cell-feature matrix, similar to those output by existing single cell and spatial technologies. For more information, see the cell segmentation section of the Xenium algorithms page.
Here are descriptions for the Segmentation Metrics:
| Metric | Description |
|---|---|
| Number of cells detected | The total number of cells detected. |
| Percent of transcripts within cells | Percent of high-quality transcripts that are found within cells. Low values can be caused by underdetection of cells or sample preparation issues leading to mis-localized transcripts. Unassigned transcripts are excluded from the cell-feature matrix. |
| Cells per 100 µm2 | The density of cells per 100 microns squared. This metric may vary by tissue type and cell size. |
| Median genes per cell | The median number of unique genes detected per cell. Cells with zero transcripts are excluded from the calculation. For add-on panels, this metric is split between median pre-designed genes or custom genes per cell. |
| Median transcripts per cell | The median number of high-quality transcripts per cell (≥ Q20). Cells with zero transcripts are excluded from the calculation. For add-on panels, this metric is split between median pre-designed or custom transcripts per cell. If present, the median pre-designed transcript per cell metric includes the combined inputs of pre-designed and add-on probes for boosted genes (learn more here). |
| Percent of empty cells | Percent of all cells with no decoded high-quality transcripts. This should typically be a low value but an acceptable range for each region is dependent on the gene panel and tissue sample. |
Segmentation method metrics are provided for data generated with the multimodal cell segmentation workflow.
| Metric | Description |
|---|---|
| Cells segmented by boundary stain | Number and percent of cells where the cell segmentation boundary is derived from the boundary stain. |
| Cells segmented by interior stain | Number and percent of cells where the boundary is from expansion of the nucleus using interior stain information. |
| Cells segmented by nucleus expansion | Number and percent of cells where the boundary is an isotropic expansion from the nucleus boundary. Distance is 5.0 µm by default, or a user-input value if reanalyzed with Xenium Ranger resegment. |
| Total number of cells detected | The total number and percent of cells detected. The sum of the cell categories above. |
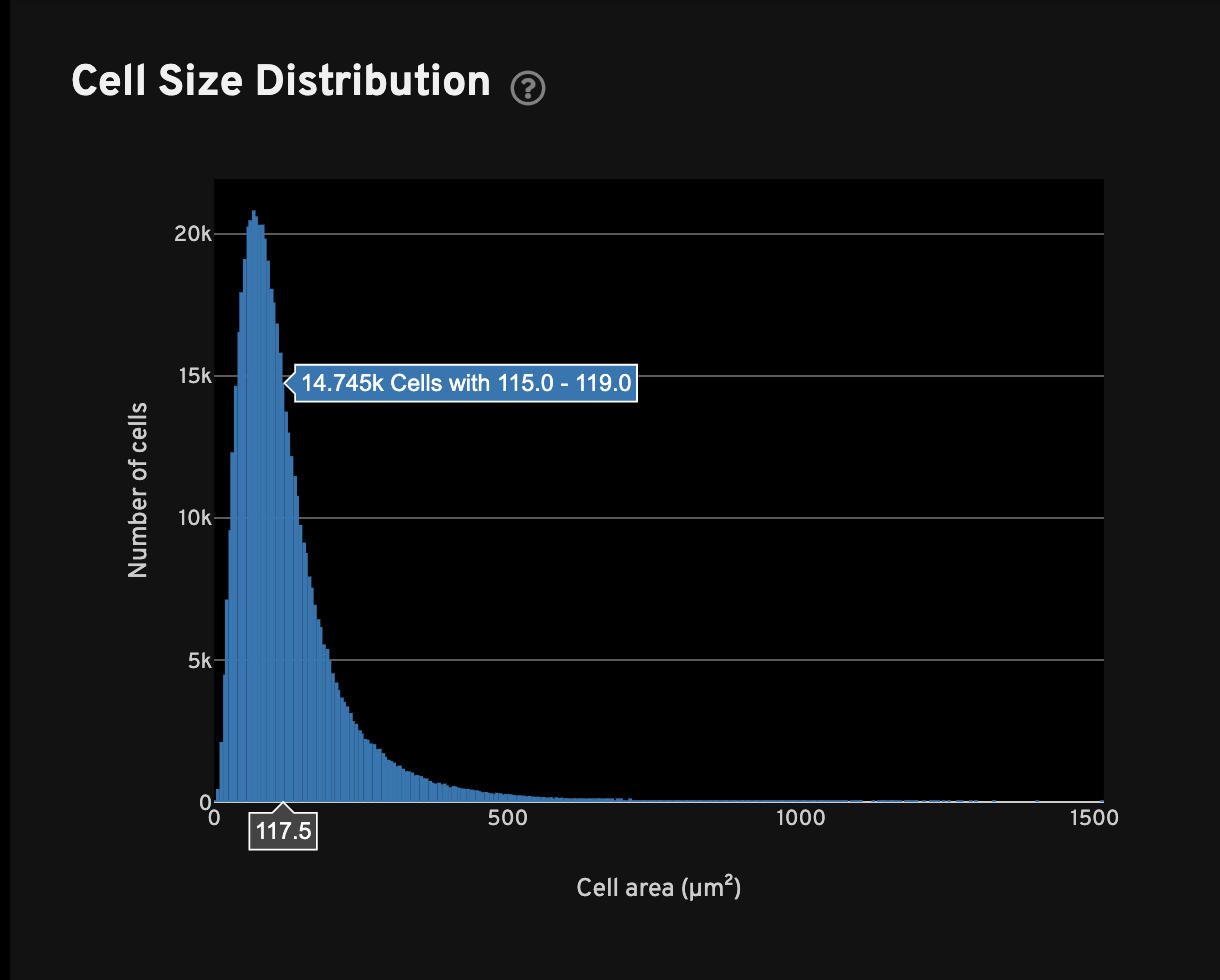
For all cells with transcripts, the Cell Size Distribution view shows a histogram of cell area in µm2. The area is computed from the cell segmentation mask.
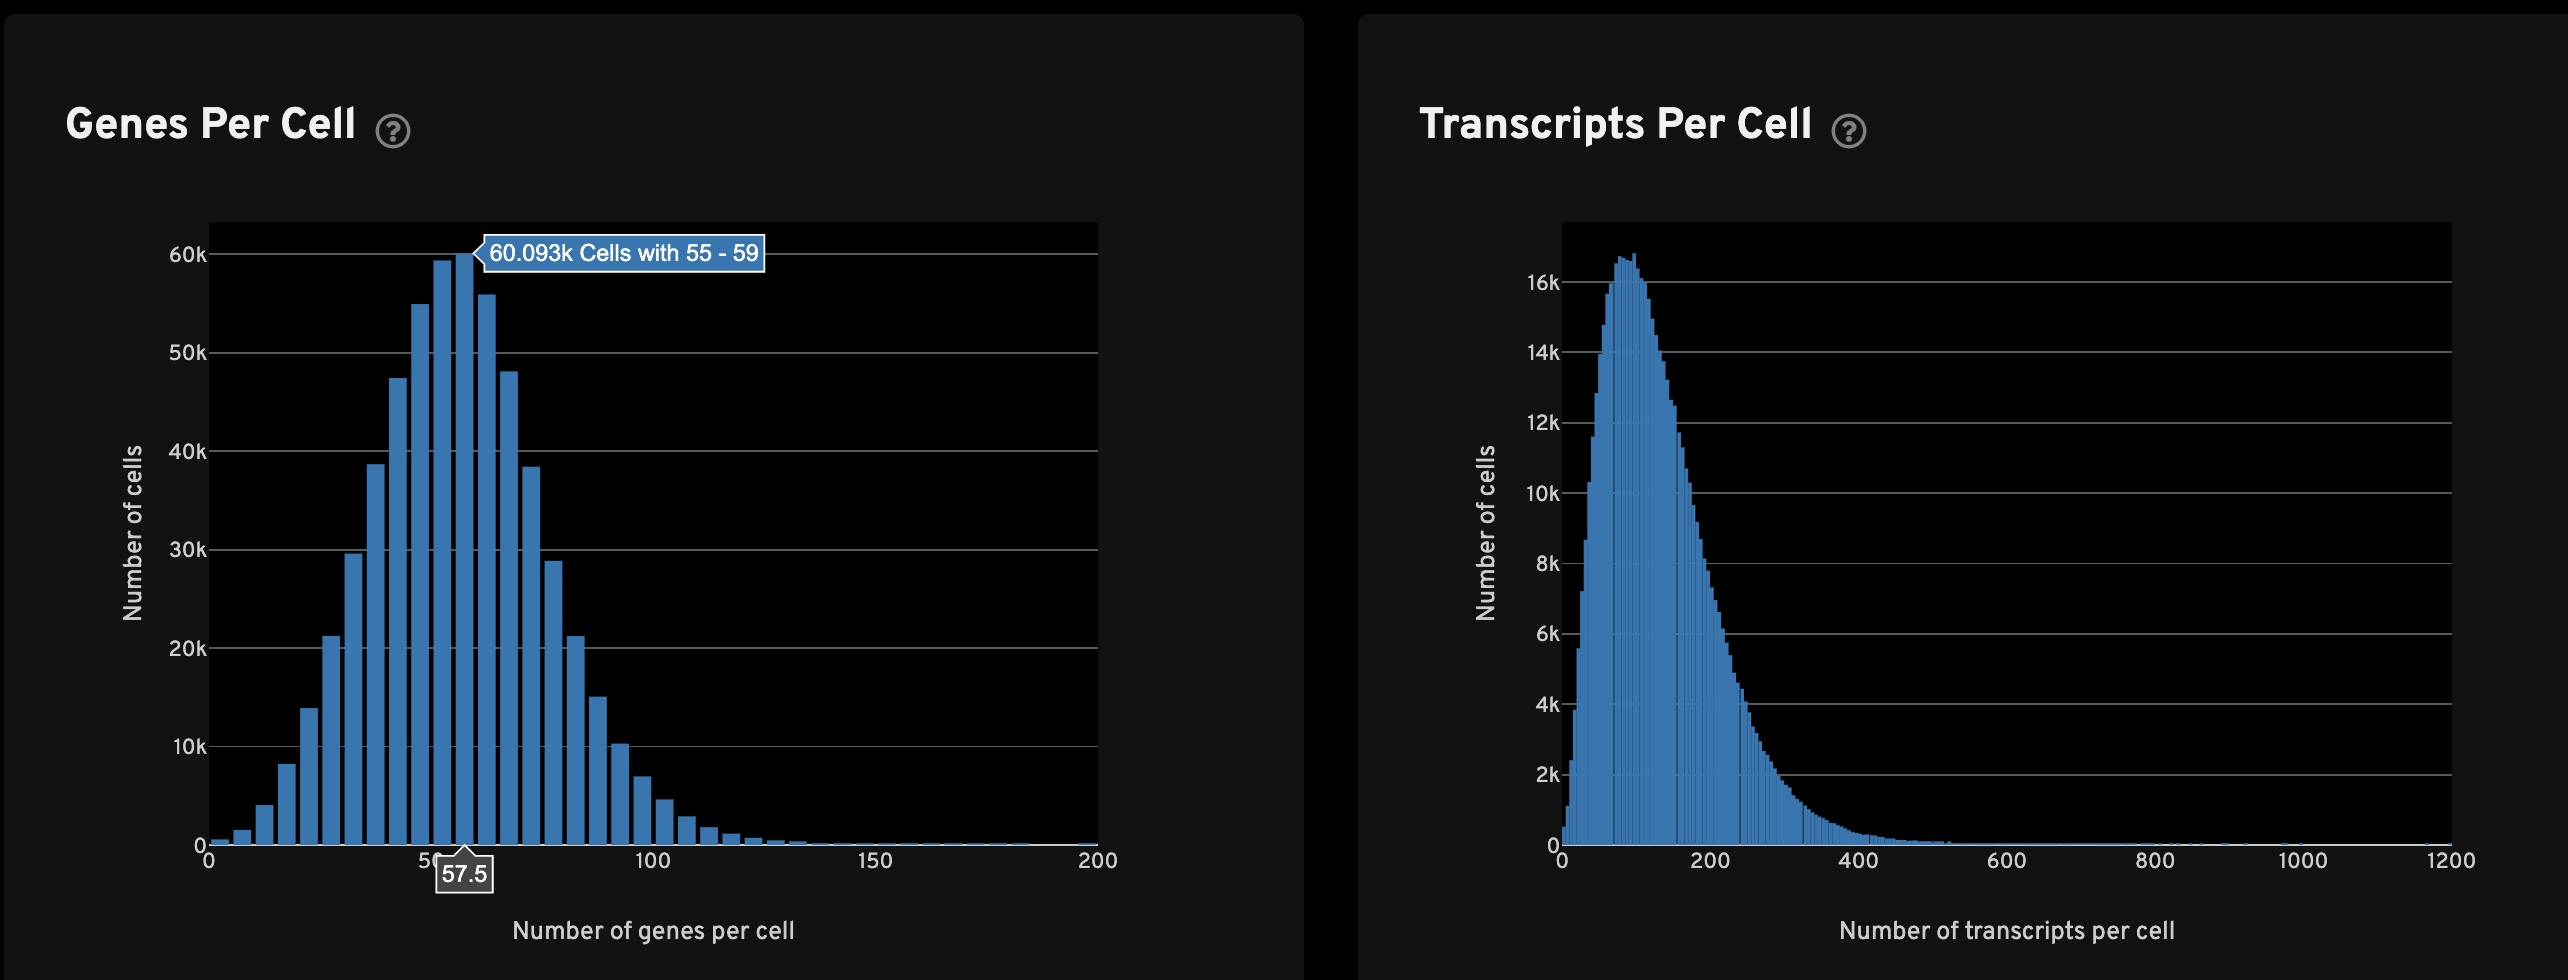
The Genes per cell view shows a histogram of the total number of unique, panel (non-control) genes found in each cell for all cells with transcripts. The Transcripts per cell view shows a histogram of the total number of transcripts found in each cell over all panel (non-control) genes for all cells with transcripts.
The Transcripts Per Cell view shows the spatial distribution (left) and UMAP projection (right) of cells colored by the total number of transcripts detected in each cell. For performance reasons, a subset of cells may be plotted for very large samples.
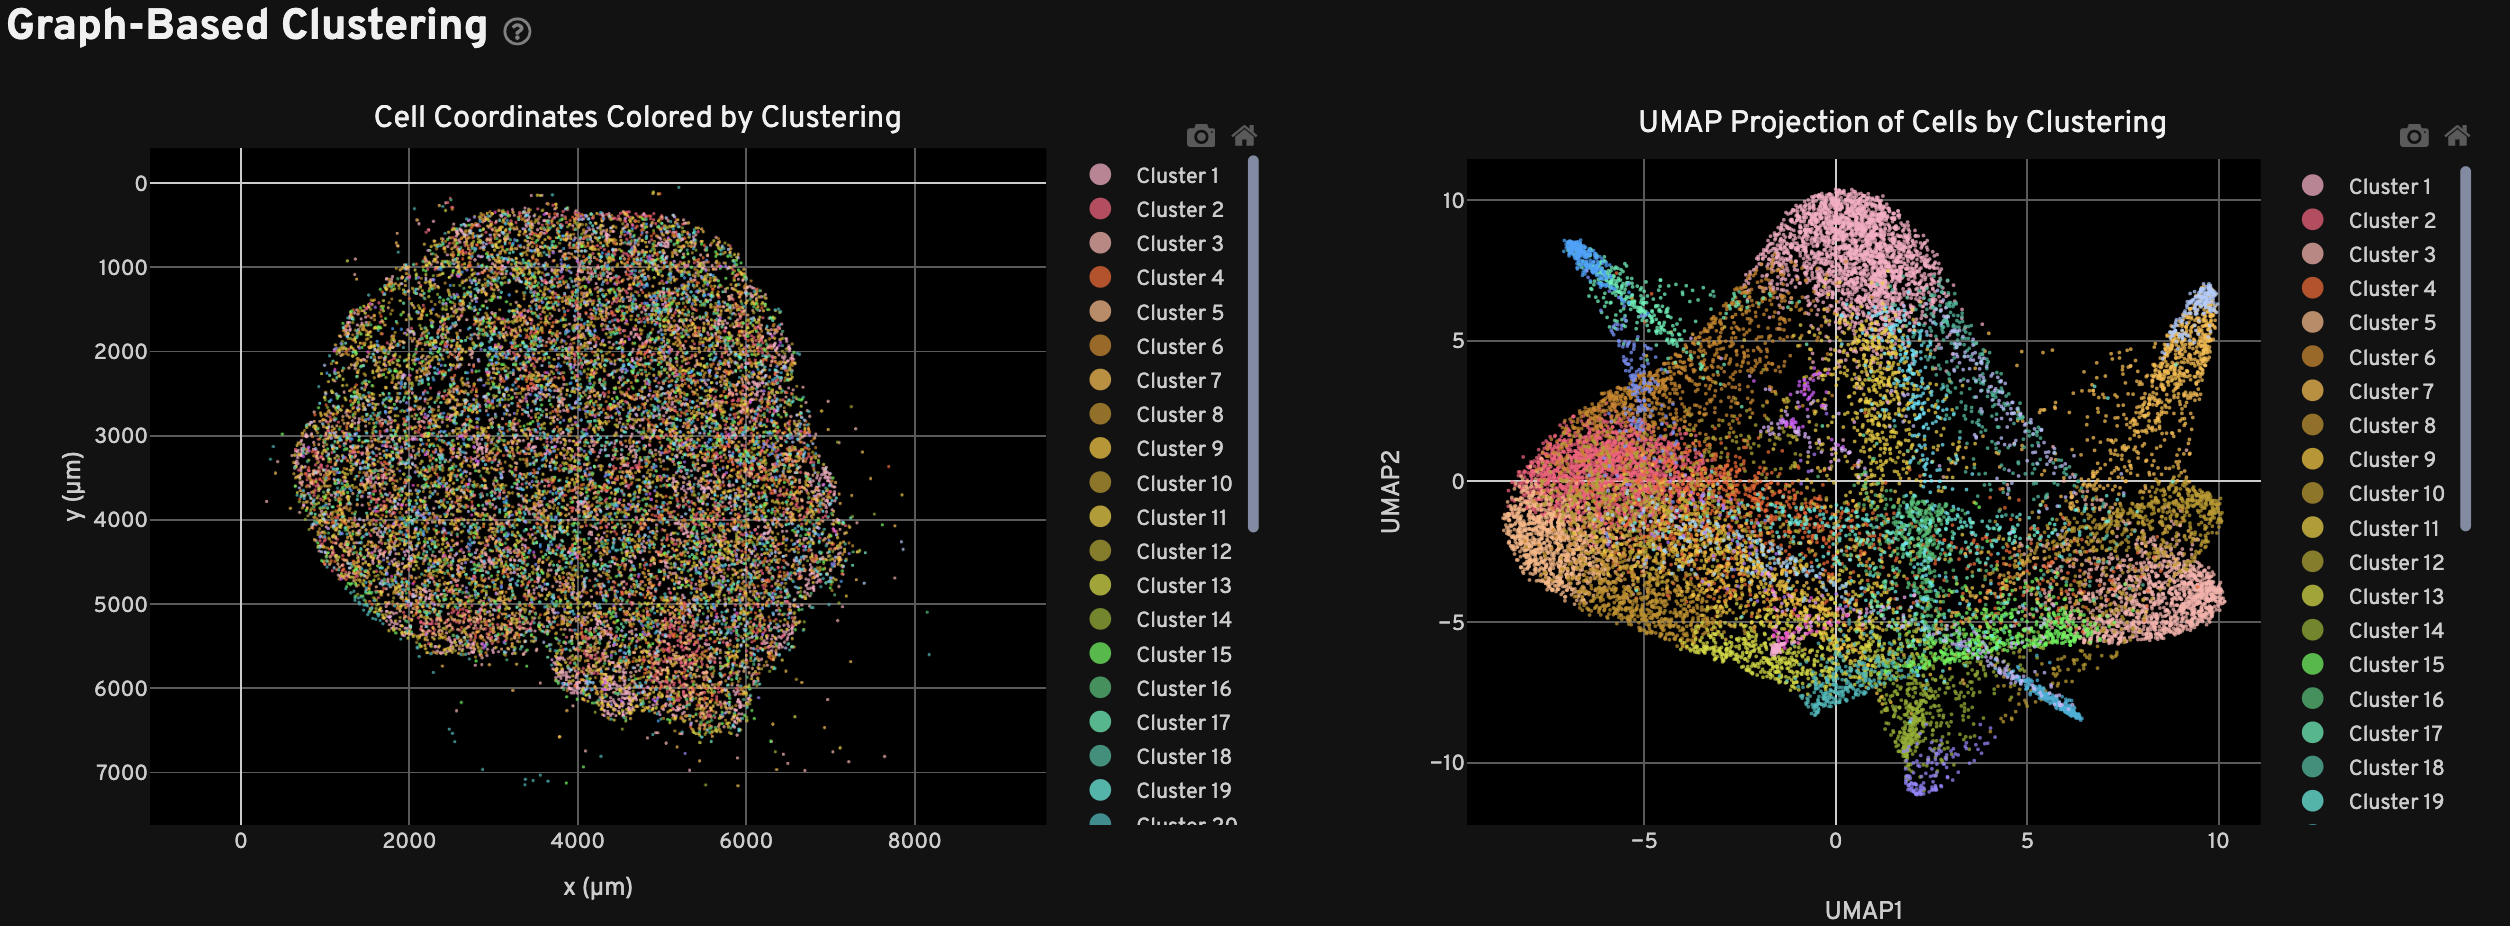
The Clustering view shows the spatial distribution (left) and UMAP projection (right) of cells colored by cluster assignment using the Onboard Analysis pipeline's automated clustering algorithm. The clusters should reflect groups of cells that have similar expression profiles. In the left plot, cells are colored according to their cluster assignment and plotted in their spatial location. Only cells with a nucleus detected by the DAPI stain are used in the clustering algorithm.
In the right plot, the axes correspond to the 2-dimensional embedding produced by the UMAP algorithm. In this space, pairs of cells that are close to each other have more similar gene expression profiles than cells that are distant from each other. For performance reasons, a subset of cells may be plotted for very large samples.
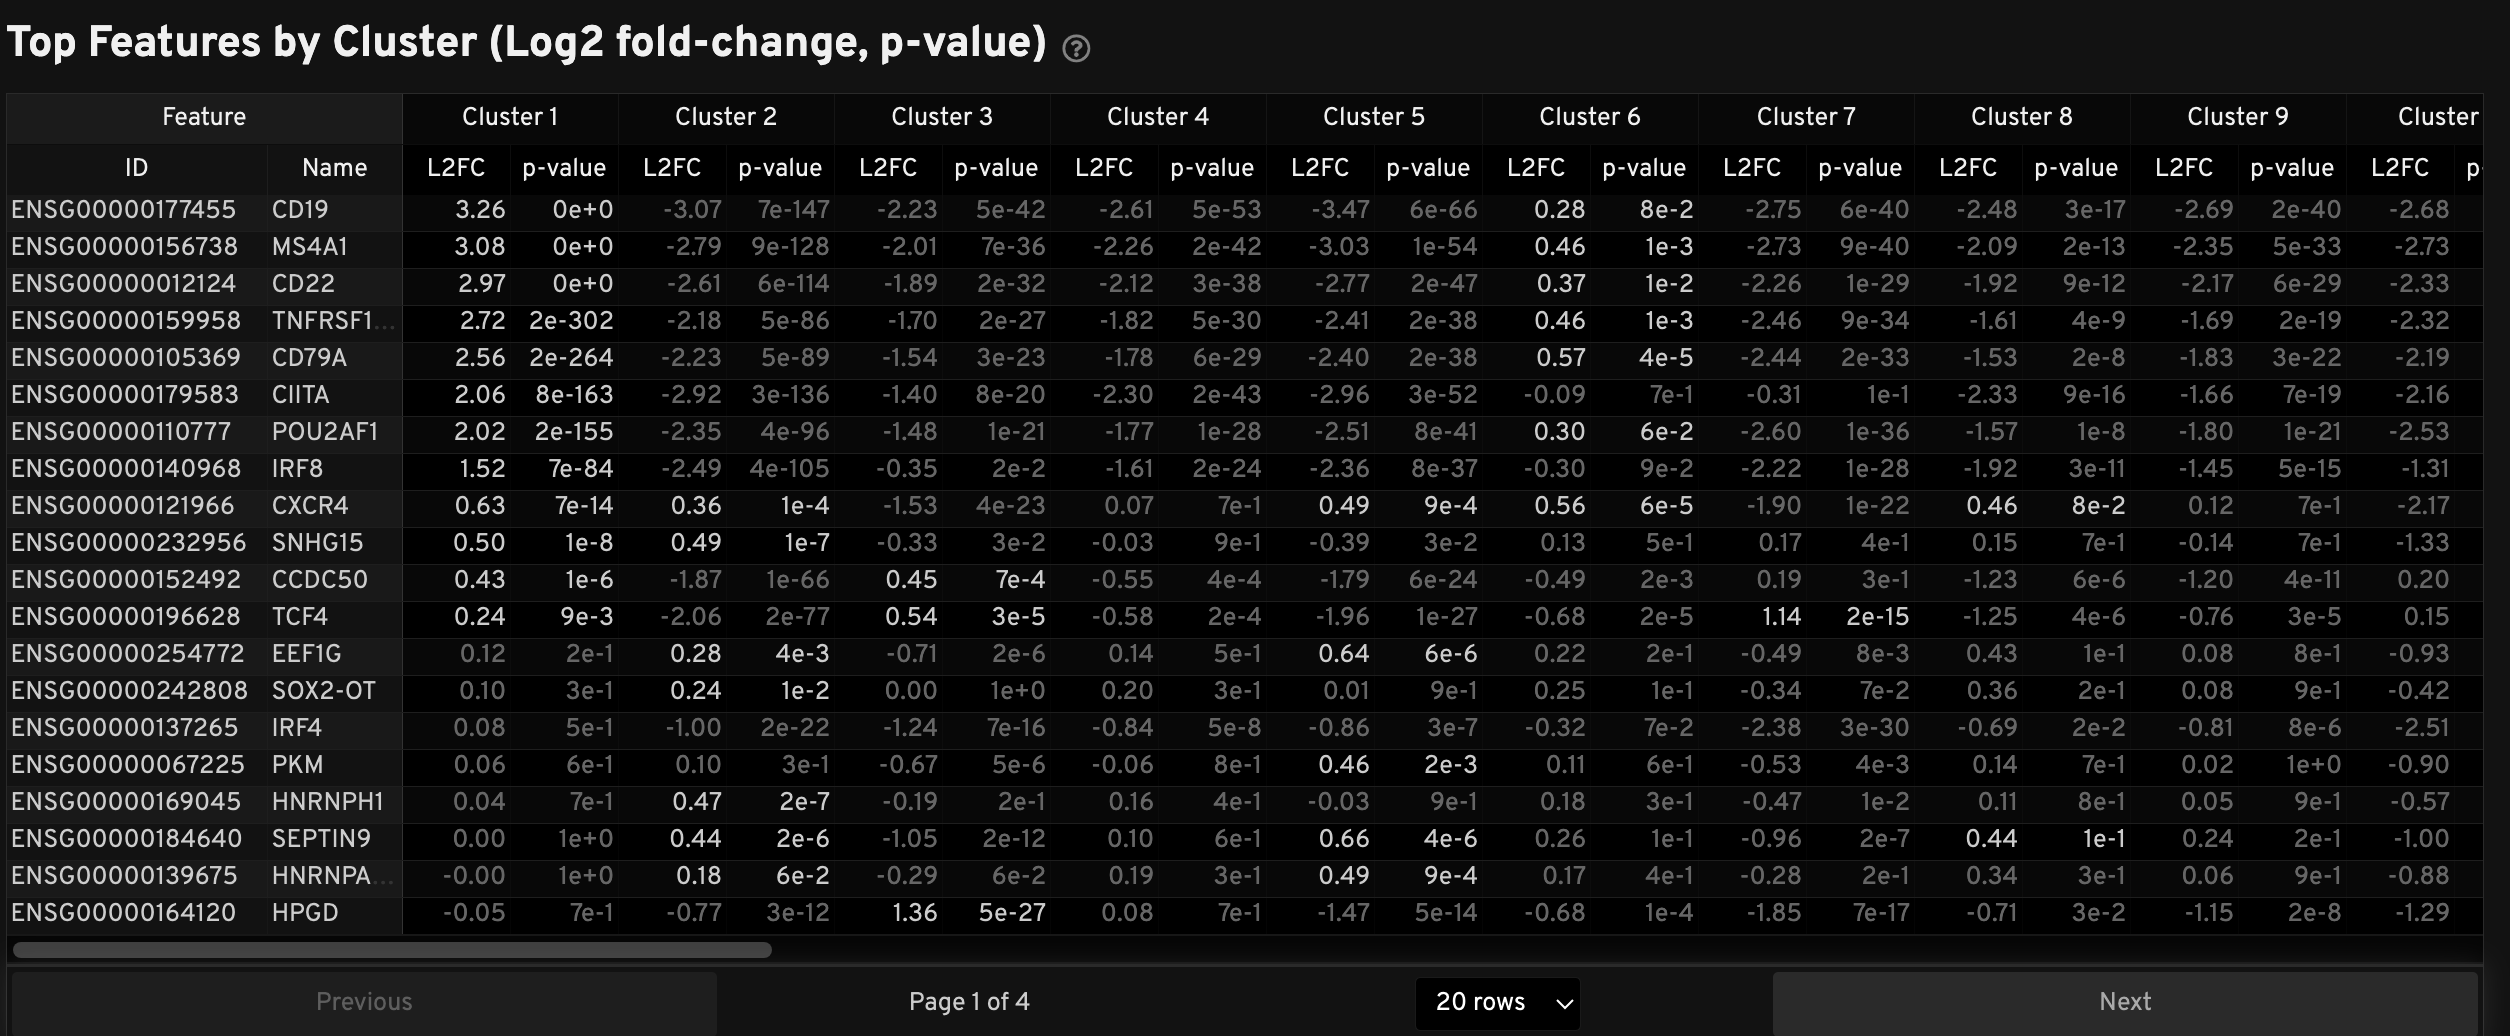
The Top Features by Cluster table displays results from the Onboard Analysis pipeline's automated differential expression analysis. For each cluster, the table shows features that are more highly expressed in that cluster relative to the rest of the sample.
A differential expression test was performed between each cluster and the rest of the sample for each feature.
- The Log2 fold-change (L2FC) is an estimate of the log2 ratio of expression in a cluster to that in all other cells. A value of 1.0 indicates a 2-fold greater expression in the cluster of interest.
- The p-value is a measure of the statistical significance of the expression difference and is based on a negative binomial test. The p-value reported here has been adjusted for multiple testing via the Benjamini-Hochberg procedure.
In this table, you can click on a column to sort by L2FC or p-value for each cluster. Features were filtered (mean object counts > 1.0) and the top N features by L2FC were retained for each cluster. Features with L2FC < 0 or adjusted p-value ≥ 0.10 are grayed out. The number of top features shown per cluster, N, is set to limit the number of table entries shown to 10,000 (N=10,000/K2 where K is the number of clusters). N can range from 1 to 50. For the full table, please refer to the differential expression CSV files produced by the pipeline.
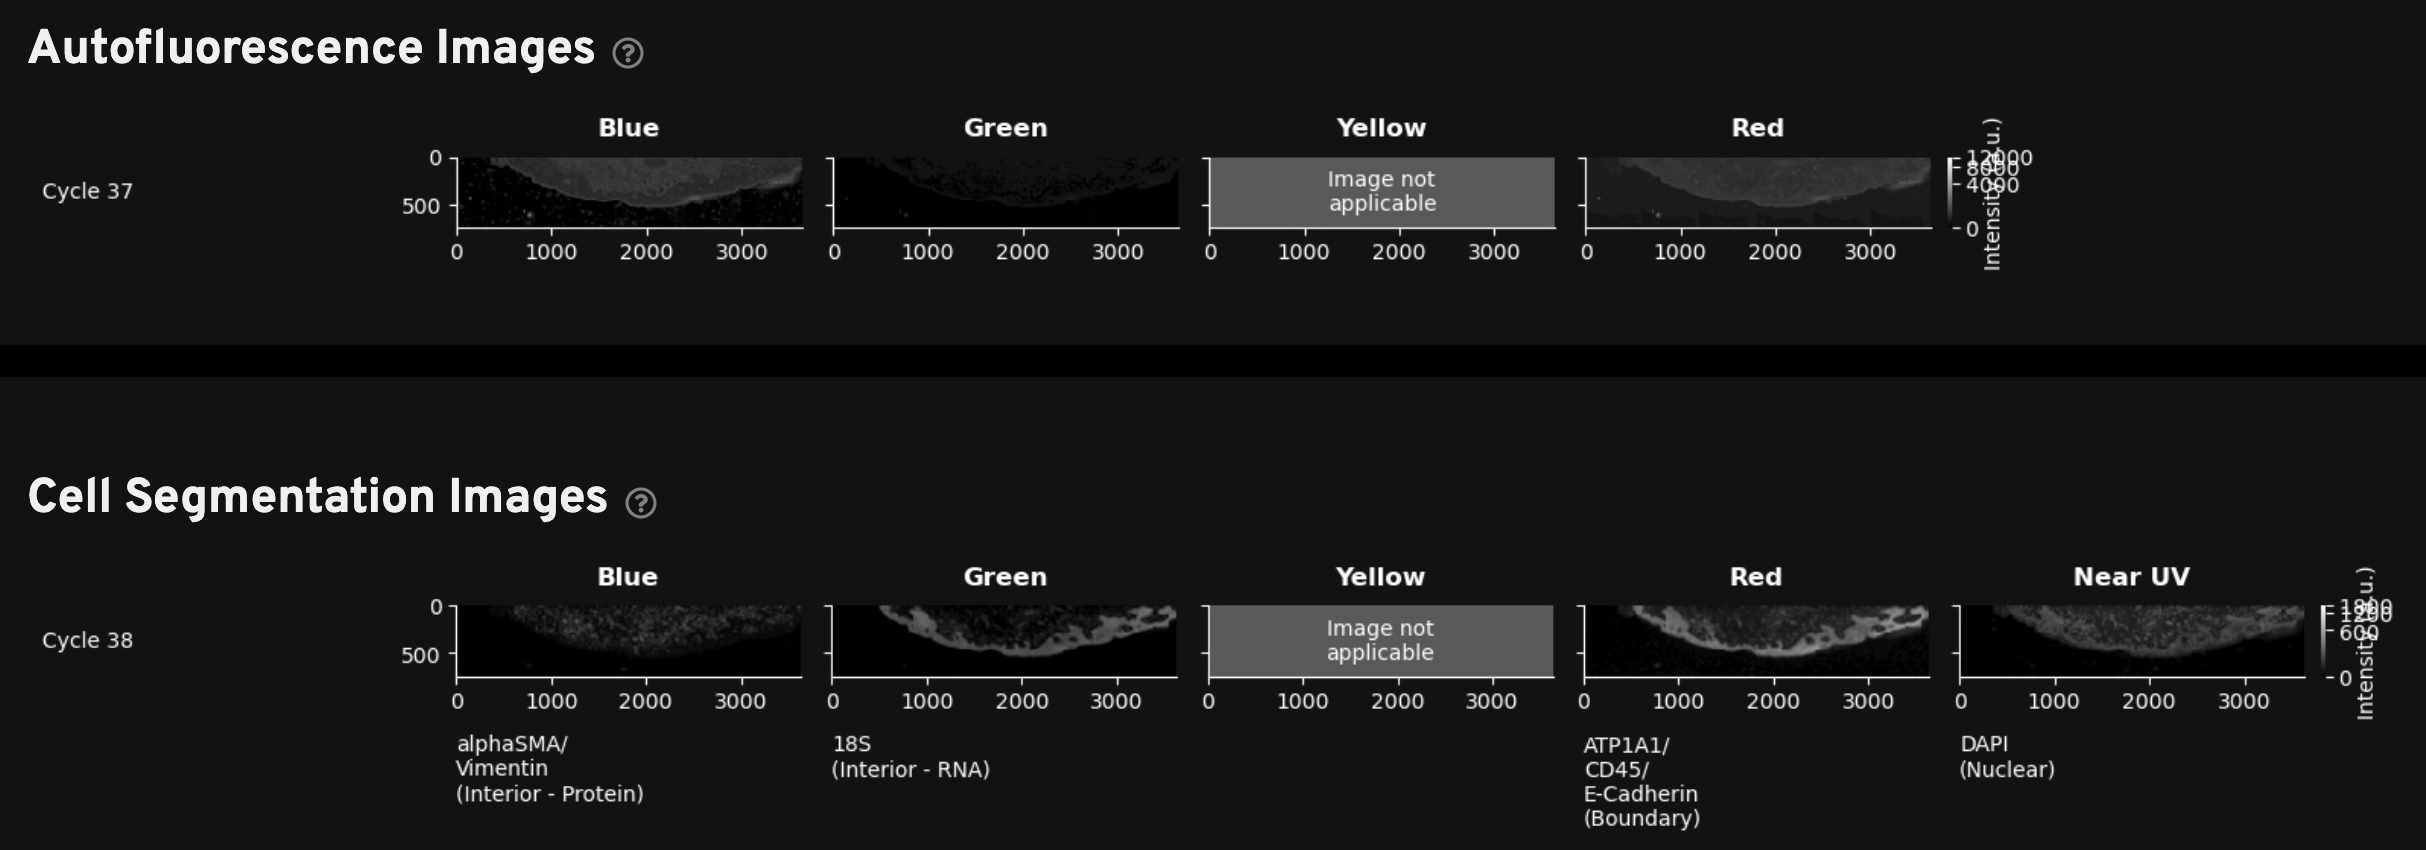
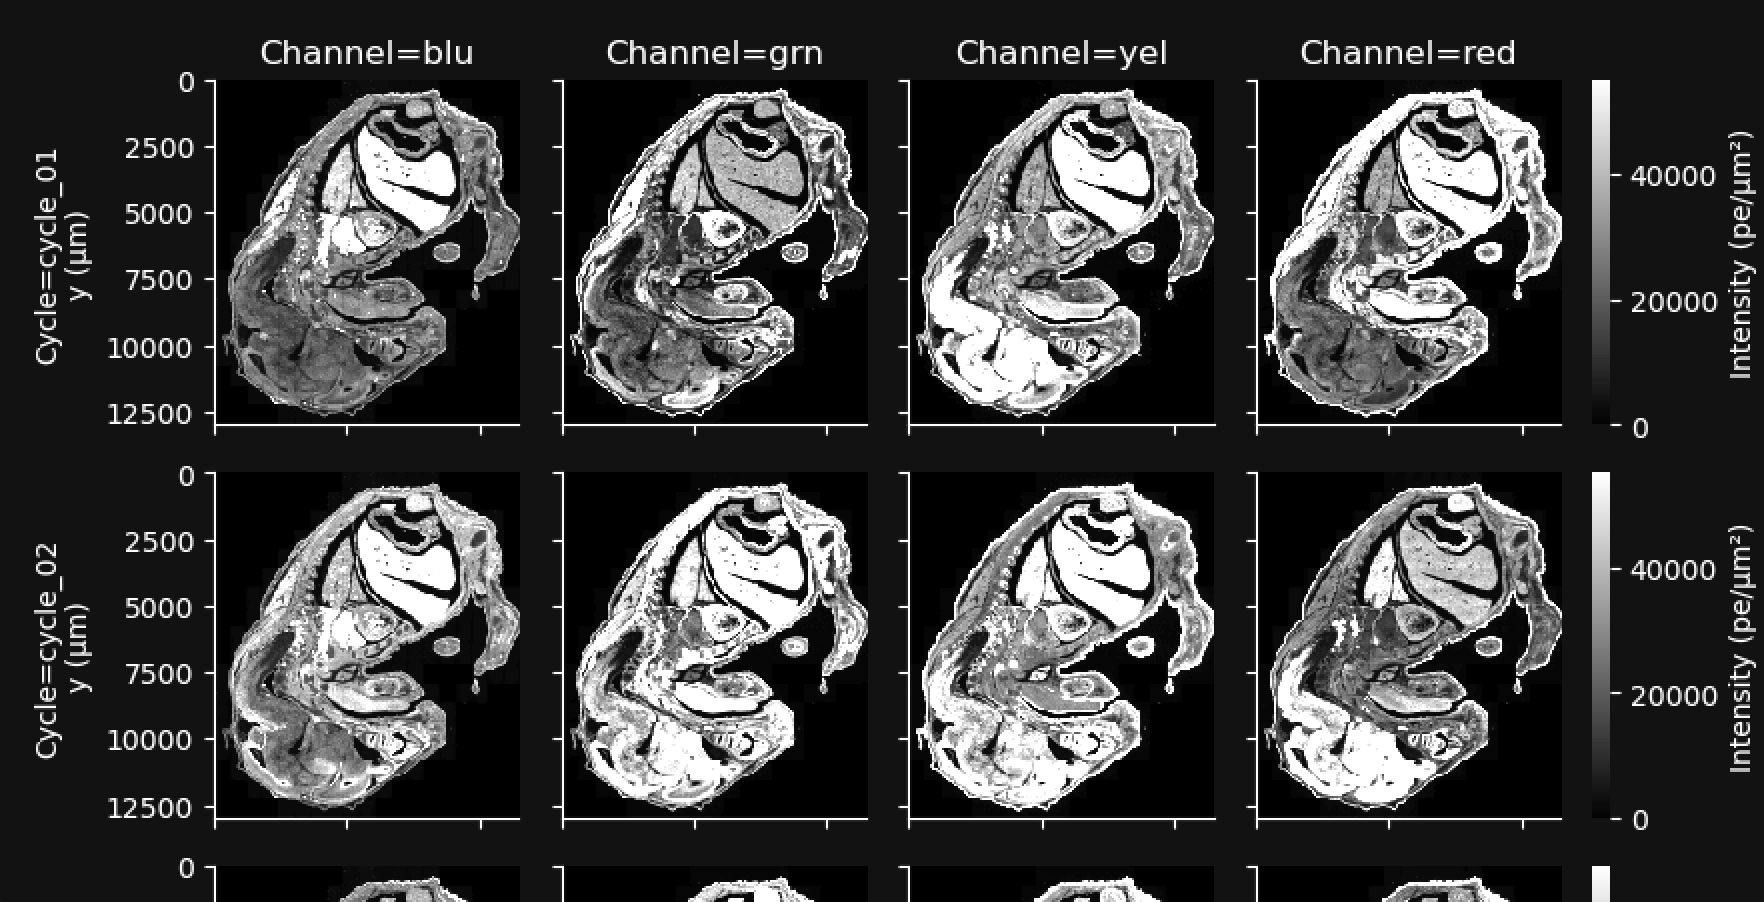
This gallery shows a stitched and reconstructed fluorescence image of the analyzed region obtained by downsampling and processing the internal sensor data for each cycle (row) and channel (column).
The intensity values in the thumbnail image give the average fluorescence intensity measured by the sensor in units of photoelectrons (pe) per square micron of tissue area. They are downsampled to 200 x 200 pixels from the high-resolution images available in aux_outputs/per_cycle_channel_images/.
This gallery can be useful for quick data QC, such as checking for stitching errors, total cycle dropouts or oversaturation, debris, or low transcript density areas. Patterned changes in fluorescence intensities across cycle-channel plots are a signal of good image quality. For example, in the images below, certain tissue areas are dim in some cycles and bright in others. Fluorescence signals that are always high in the same location in all cycles indicate tissue autofluorescence and may affect transcript data at that location.
For Xenium outputs generated with the multimodal cell segmentation assay workflow, this tab includes two rows of morphology images to help with troubleshooting. Note that the blank yellow channel is displayed to maintain the same order of channels presented in all sections of the Image QC gallery as you review the images vertically.
-
Autofluorescence Images: Thumbnail plots of the autofluorescence images (maximum intensity projection (MIP) images; not deconvolved). These images are subtracted from the raw stain images to produce the autofocused images in the Cell Segmentation images gallery. Use these images to review any debris or autofluorescence artifacts that were automatically subtracted during morphology image processing. Downsampled images are available in the
aux_outputs/background_qc_images/background_01_[channel].tiffdirectory. -
Cell Segmentation Images: Thumbnail plots of the autofocused, downsampled, and processed morphology images. The DAPI image in this gallery is from cycle 1. The interior and boundary stain images in this gallery have undergone background subtraction and stitching (described in the imaging algorithms page).
Very dim images may indicate problems during the morphology staining workflow. Full resolution images can be found in the
morphology_focus/directory, which contains multi-file OME-TIFF autofocus files.
Here is an example for a Xenium Prime 5K dataset: