The resegment pipeline allows you to generate a new segmentation of the morphology image space by rerunning the Xenium Onboard Analysis (XOA) segmentation algorithms with modified parameters.
Adjustable parameters:
- Nucleus expansion distance (e.g., to make a nucleus-only count matrix (set to distance to 0 µm) or to use a more conservative expansion distance).
- Minimum DAPI intensity (e.g., to rescue dim nuclei that are filtered by default).
- Cell boundary or interior stain (e.g., to specify or disable cell segmentation stain used in multimodal cell segmentation algorithms).
- Resegment with multimodal cell segmentation and large cell segmentation algorithms.
The input files for resegment are:
- The Xenium output bundle generated by the Xenium Onboard Analysis pipeline (see Input overview).
The xeniumranger resegment command line arguments are described on the Xenium Ranger command line arguments page.
Below are some example uses of the resegment pipeline. Make sure to edit the paths to input/output files in the examples below for your own datasets. The examples provide the recommended settings for --localcores and --localmem parameter values (see Resource limits for more details).
The XOA software version updates may include algorithm improvements to the nucleus segmentation model (i.e., in v2.0, see release notes). XOA segmentation algorithm changes by software version are summarized in this table.
If you want to run the XOA DAPI segmentation model that corresponds to the Xenium Ranger version you are running and adjust nuclei expansion distance, use --expansion-distance. Here are some example scenarios that are addressed by the code examples below when run with the latest version of Xenium Ranger:
-
If the input data is from XOA v1.1, run with Xenium Ranger v2.0 to generate segmentation results with the XOA v2.0 pipeline segmentation algorithms (i.e., new default 5 µm expansion distance).
# An example of changing the default expansion distance in a XOA v1.y dataset to new default 5 µm xeniumranger resegment --id=demo \ --xenium-bundle=/path/to/xenium/files \ --localcores=32 \ --localmem=128 -
Change the default nuclear expansion distance (5 µm) for a multimodal cell segmentation dataset and keep the default boundary and interior stains. The
resegmentpipeline will rerun the multimodal cell segmentation algorithm to generate the new results for any cells that are segmented via isotropic nuclear expansion.# An example of changing the expansion distance, in this case to 3 µm xeniumranger resegment --id=demo \ --xenium-bundle=/path/to/xenium/files \ --expansion-distance=3 \ --localcores=32 \ --localmem=128
--resegment-nuclei=false. In Xenium Ranger v2.0 and later, the --resegment-nuclei parameter is deprecated and will be removed in future releases.To adjust the nuclear expansion distance without altering nuclei detection:
- For DAPI-only data, see this
import-segmentationexample for the preferred method. Xenium Ranger v2.0 and later will automatically runimport-segmentationfor commands withxeniumranger resegment --resegment-nuclei=false --id=demo --xenium-bundle=/path/to/xenium/files. - For multimodal cell segmentation data, this is unsupported. Nuclei are detected using information from the DAPI stain and then some nuclei may be split by the boundary stain segmentation method. In this case, importing the previously detected nuclei and adjusting the expansion will have different results from resegmenting the DAPI image. To replicate DAPI-only nucleus segmentation, see the example below that disables the boundary and interior stain methods.
To generate a cell x gene matrix with nuclei-only counts, see this import-segmentation example.
The DAPI filter allows you to increase or decrease the amount of nuclei data used for reanalysis by adjusting a pixel intensity threshold. Pixel intensity is measured in units of photoelectrons (pe), as seen in the morphology images.
For datasets where the DAPI signal is clearly dimmer across the entire imaged area, you can adjust the minimum peak intensity to use more nuclei in the DAPI image for nucleus segmentation. This parameter is not designed for fine-tuning datasets that only have a few missing nuclei.
--dapi-filter value specifies the threshold to use for the 2D DAPI image and if the 2D image is deconvolved, XR v4.0 automatically calculates the corresponding threshold for the DAPI Z-stack by multiplying by 7. Default: 15 pe for deconvolved DAPI and 100 pe for non-deconvolved DAPI.To visually estimate pixel intensity, you can open the dataset in Xenium Explorer. However, note that Xenium Explorer does not currently provide a way to directly measure the pe value in regions of interest and this is meant as an approximation. Zoom in to view any nuclei that were not detected by the original analysis and use the DAPI intensity threshold slider to adjust the minimum photoelectron (pe) value.
In this example, any nucleus for which 95% or more of its pixel intensity is less than an intensity threshold of 400 photoelectrons will be removed.
xeniumranger resegment --id=demo \
--xenium-bundle=/path/to/xenium/files \
--dapi-filter=400 \
--localcores=32 \
--localmem=128
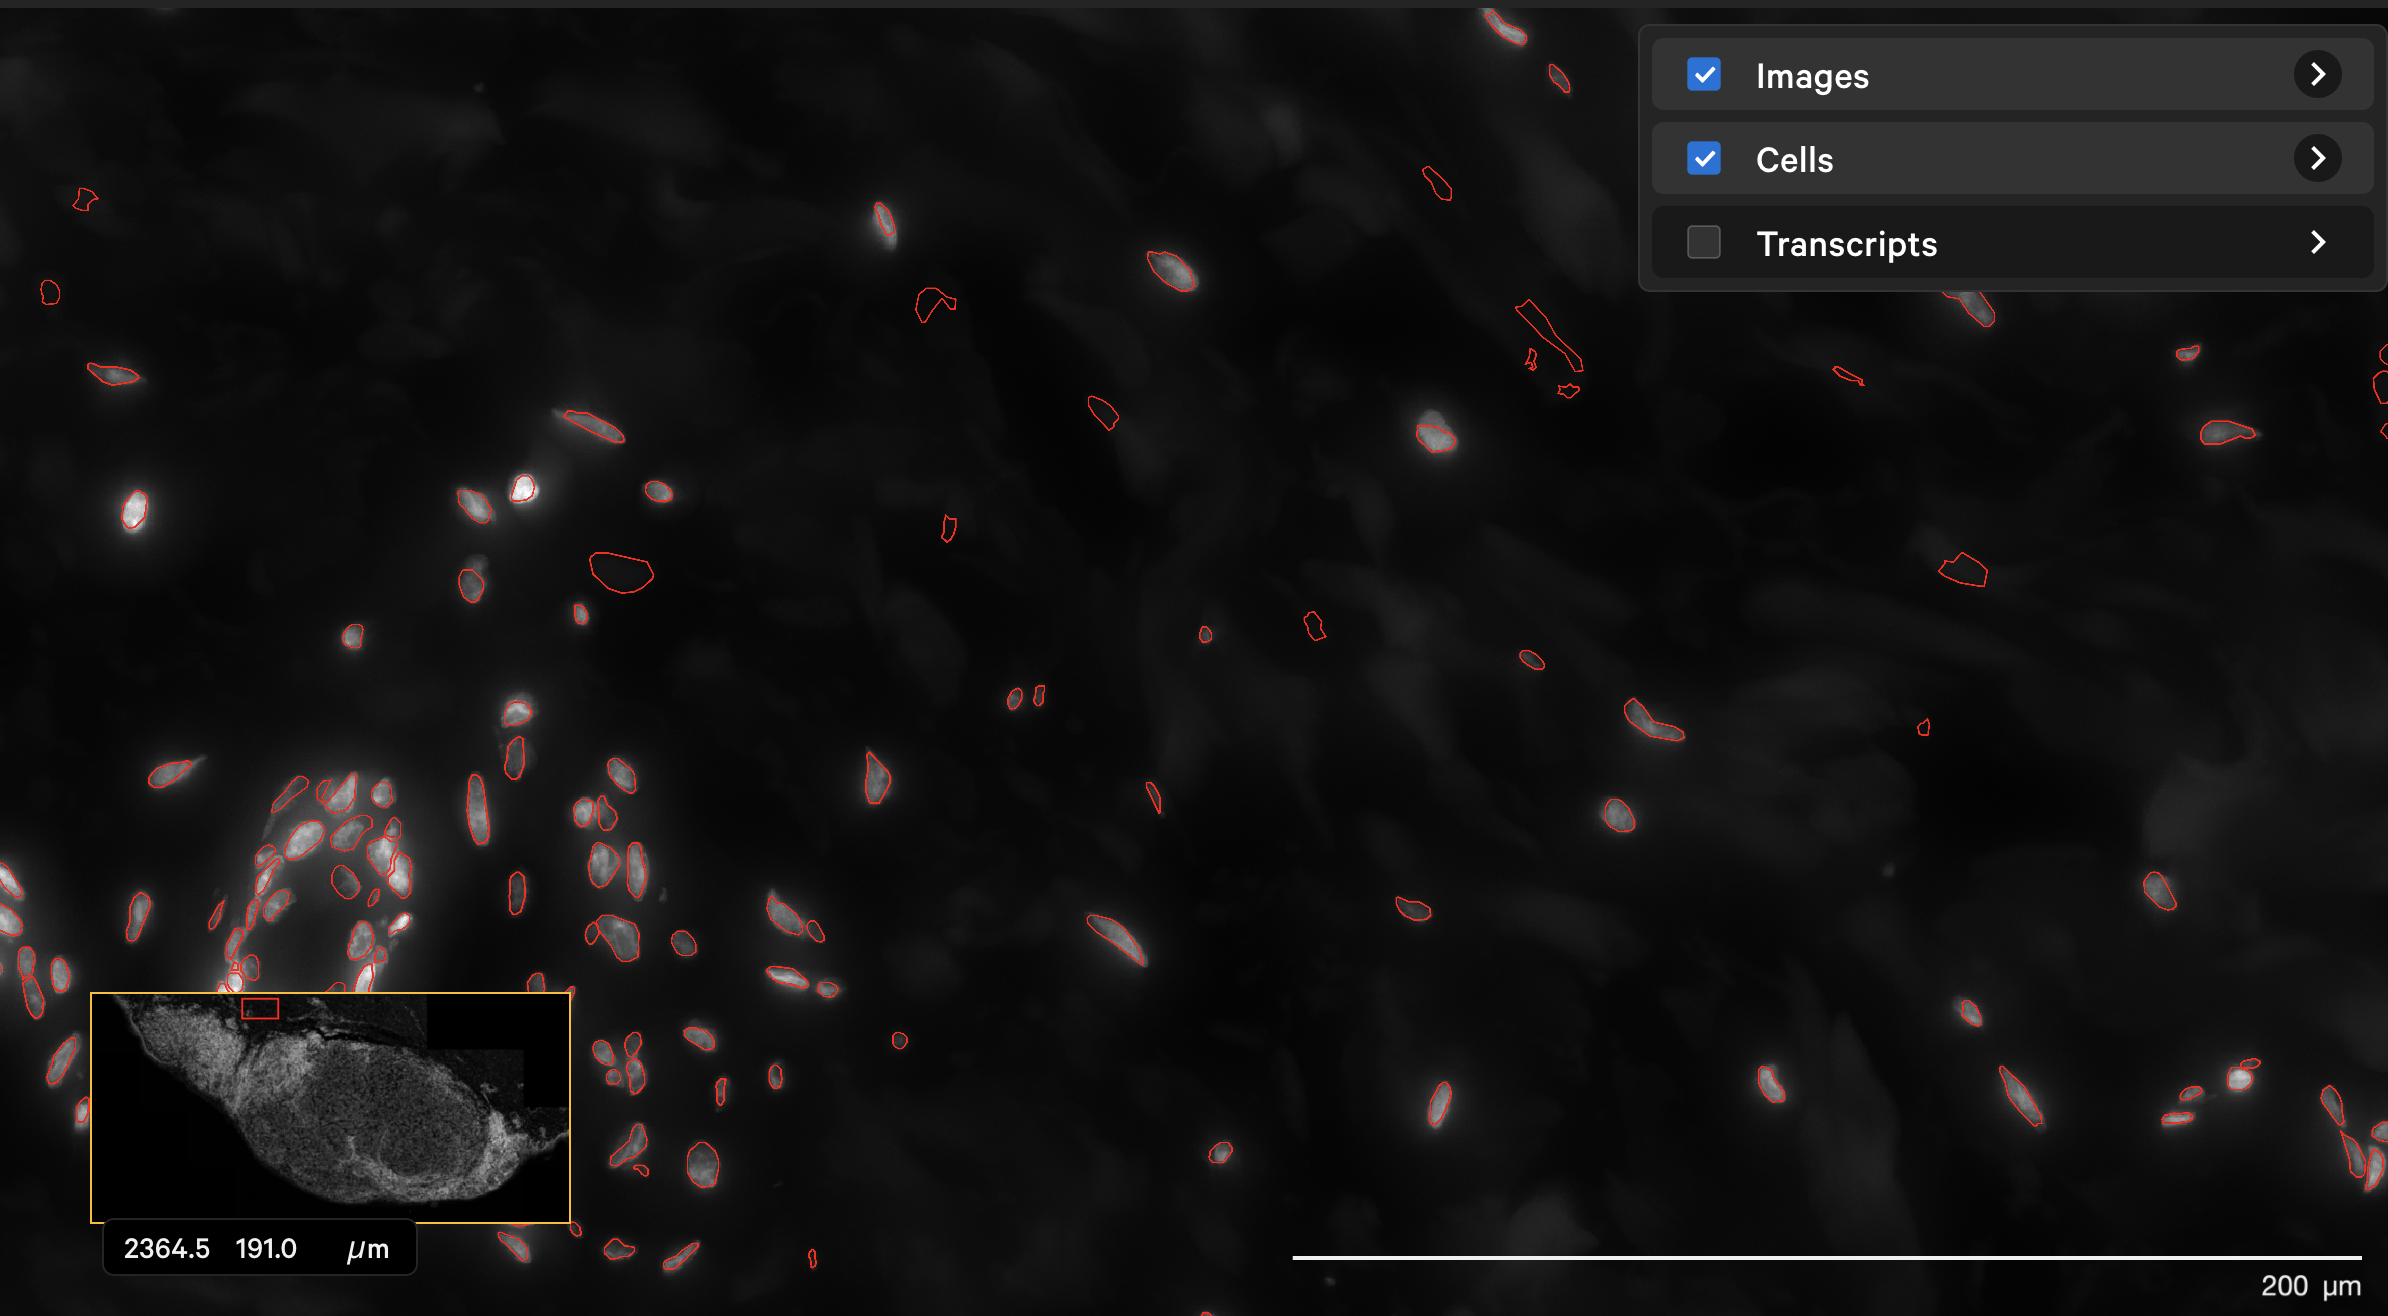
The dapi-filter parameter can also be used to reduce false positives in cell calling. For this example, the onboard analysis pipeline (XOA v1.7) identified cells in the dermis in this human skin dataset that are not likely to be true cells. The original DAPI image shown with outlined nuclei in Xenium Explorer looked like this with a DAPI filter of 100 pe:
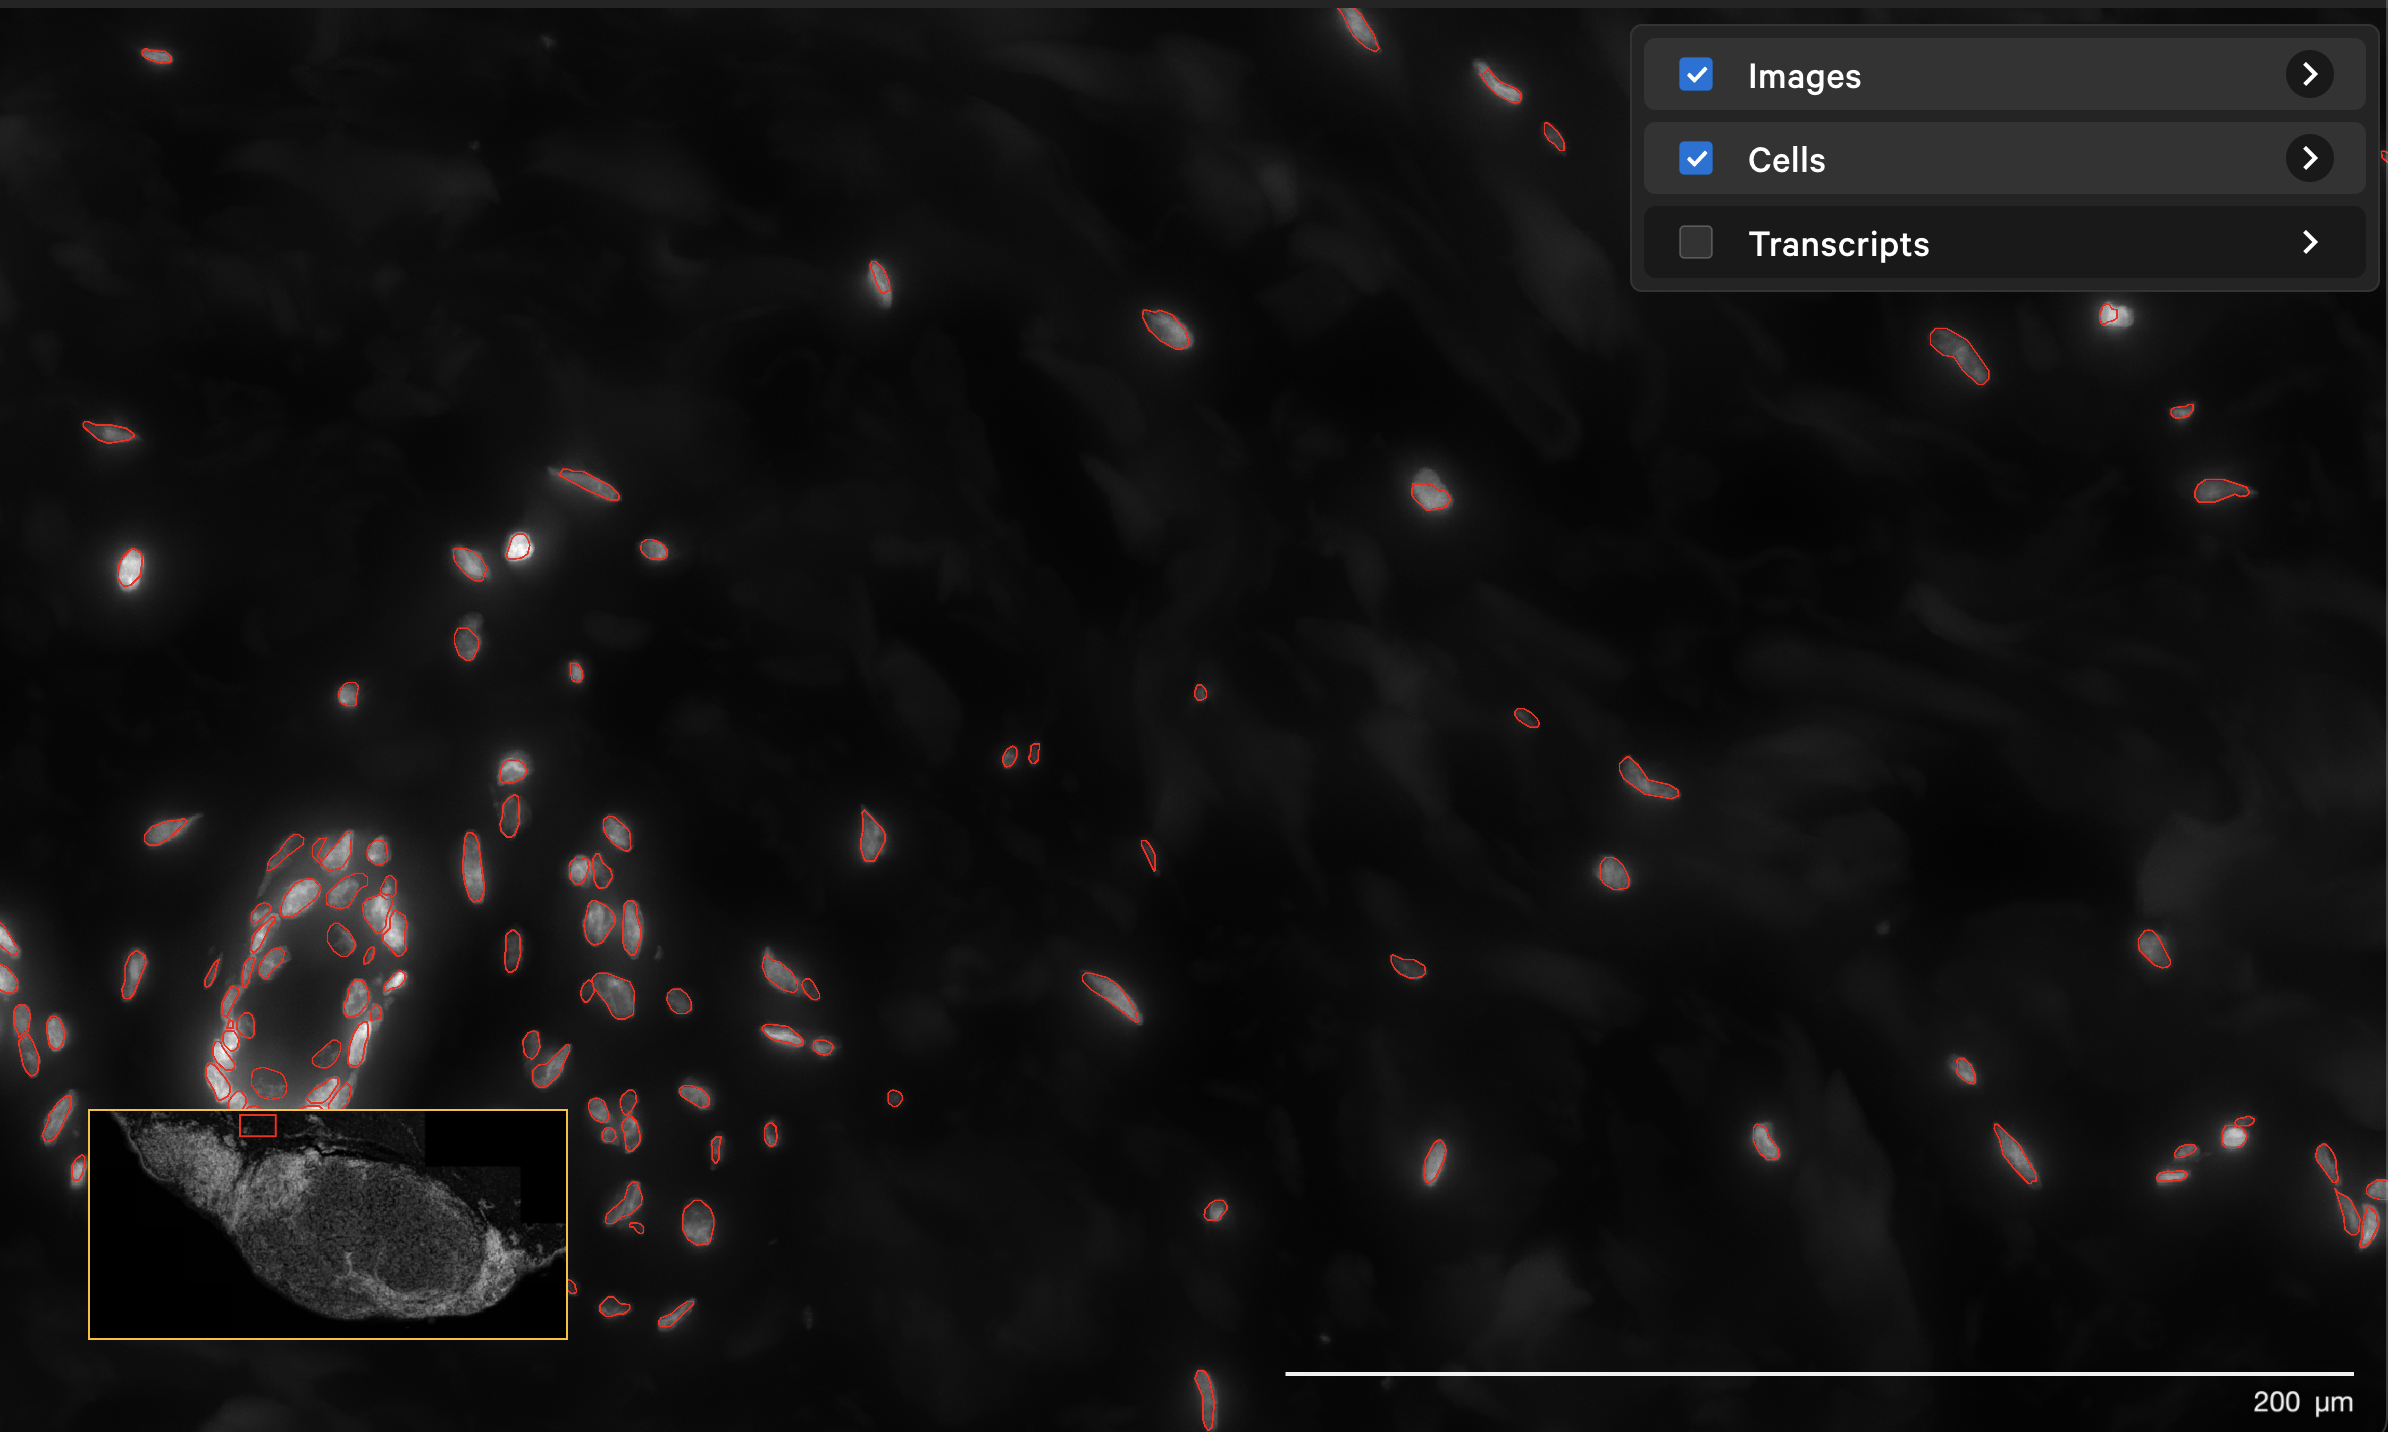
The resegment result with dapi-filter=400 for the same area now looks like this:
In Xenium Ranger v2.0 and later, you can rerun the multimodal cell segmentation algorithms on datasets prepared with a Cell Segmentation Staining User Guide (CG000749, CG000760, or CG000819).
Data can be rerun to remove suboptimal stains and/or adjust the default nuclear expansion distance. For example, if fewer than 50% of cells are segmented by boundary and interior RNA methods combined, it is a sign that staining was suboptimal or the sample is potentially unsuitable for the multi-tissue stain. A suboptimal stain may indicate a workflow or instrument error, or poor sample quality. See Xenium Ranger algorithms page for more details.
Here are a few example scenarios:
-
Do not use boundary stain in analysis, but keep default interior stain and DAPI:
xeniumranger resegment --id=demo \ --xenium-bundle=/path/to/xenium/files \ --boundary-stain=disable \ --localcores=32 \ --localmem=128 -
Do not use interior stain in analysis, but keep default boundary stain and DAPI:
xeniumranger resegment --id=demo \ --xenium-bundle=/path/to/xenium/files \ --interior-stain=disable \ --localcores=32 \ --localmem=128 -
Do not use either boundary or interior stain and only use DAPI for nuclear expansion (e.g., to compare analysis metrics from a cell segmentation staining dataset to a DAPI-only dataset):
xeniumranger resegment --id=demo \ --xenium-bundle=/path/to/xenium/files \ --boundary-stain=disable \ --interior-stain=disable \ --localcores=32 \ --localmem=128Note: For multimodal cell segmentation data, nuclei are detected using information from the DAPI stain and then some nuclei may be split by the boundary stain segmentation method. As a result, nucleus resegmentation results from disabling boundary and interior stains can differ from the original nucleus segmentation performed with these stains.
In some cases, other morphological stains in a XOA dataset may perform better for boundary and/or interior cell segmentation of certain cell types. The --boundary-stain and --interior-stain parameters can be set to specify a different stain than the defaults used for multimodal cell segmentation. See command help text for options (xeniumranger resegment --help), described here.
Here is an example of replacing the default boundary and interior stains with protein markers in Xenium Protein datasets. Internal testing suggests this combination can work well for segmenting cells in human colon tissue:
xeniumranger resegment --id=demo \
--xenium-bundle=/path/to/xenium/files \
--boundary-stain=Beta-catenin \
--interior-stain=Vimentin \
--localcores=32 \
--localmem=128
Starting in Xenium Ranger v4.0, the resegment pipeline can be run with the --segment-large-cells option to run multimodal cell segmentation with the standard cell boundary method, as well as a large cell segmentation method. The large cell segmentation algorithm is described here.
As described above, you can specify the same options for substituting boundary and interior stains for multimodal cell segmentation with large cell segmentation.
Example:
xeniumranger resegment --id=demo \
--xenium-bundle=/path/to/xenium/files \
--segment-large-cells=true \
--localcores=32 \
--localmem=128
Cells segmented by the large cell segmentation algorithm will be labeled "Segmented by boundary stain at 0.25x" when viewed in Xenium Explorer.
Here is an example of the cell boundaries from a human dorsal root ganglion (DRG) spinal cord dataset† before and after analyzing with the large cell segmentation option. The region in the screenshots below contains cells segmented by both the standard and large cell segmentation methods (cell color by segmentation method in Xenium Explorer).
| Description | Example in Xenium Explorer |
|---|---|
| Morphology image |  |
| Multimodal cell segmentation |  |
| Multimodal cell segmentation & large cell segmentation | 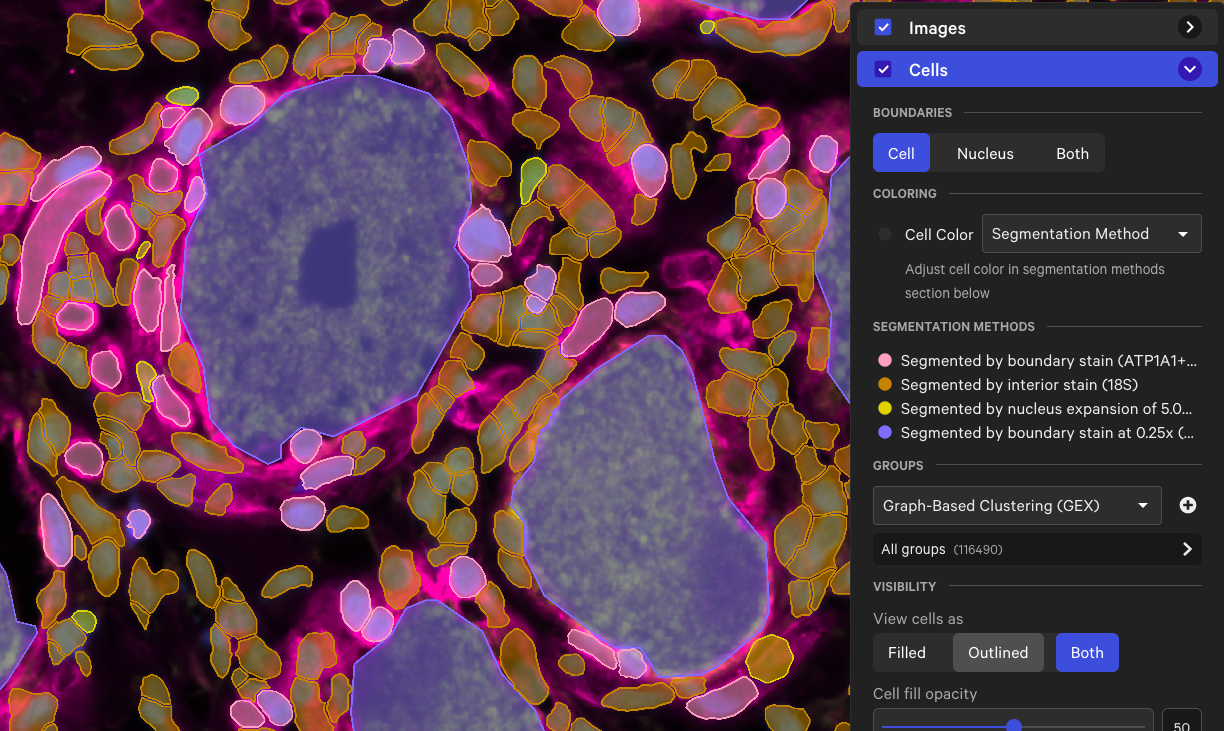 |
† Dorsal root ganglion tissue dataset provided by researchers in Dr. Theodore Price’s laboratory at the University of Texas at Dallas.
After the pipeline completes, check the output outs/ directory (see Output overview). For example, look at these files:
- Analysis summary: check metrics and plots on the Cell Segmentation tab
- All secondary analysis files
- All cell and transcript files
Morphology images are unchanged. The updated segmentation results can be visualized in Xenium Explorer.