Human Colon Preview Data (Xenium Human Colon Gene Expression Panel)
In Situ Gene Expression dataset analyzed using Xenium Onboard Analysis 1.6.0

Learn about Xenium Analysis
Overview
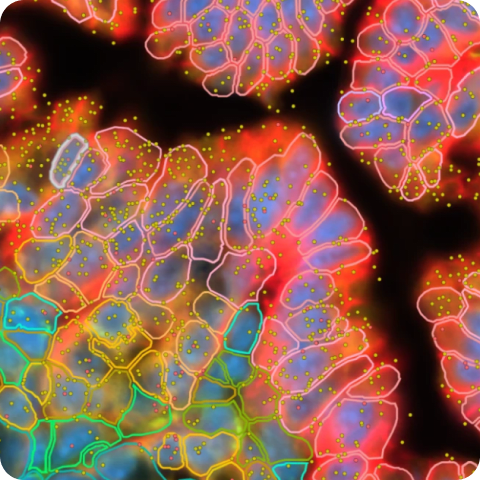
Preview of Xenium In Situ Gene Expression data for adult human colon sections, using a development version of the Xenium Human Colon Gene Expression Panel.
Biomaterials
FFPE-preserved tissues were purchased from Avaden Biosciences (non-diseased) and from Discovery Life Sciences (cancer; stage 2A adenocarcinoma).
Tissue preparation
Tissues were prepared following the Xenium In Situ for FFPE - Tissue Preparation Handbook (CG000578).
Post-instrument processing followed the Demonstrated Protocol Xenium In Situ Gene Expression - Post-Xenium Analyzer H&E Staining (CG000613).
Gene panels
The Xenium Human Colon Gene Expression Panel (325 genes) was pre-designed by 10x Genomics. Genes were chosen to prioritize identification of absorptive enterocytes, enteroendocrine cells, goblet cells, Paneth cells, fibroblasts, and vascular endothelial cells in human colon. The pre-designed panel was supplemented with an additional 100 genes including signaling genes, chemokine genes, and markers for stromal cells.
Xenium Analyzer
The instrument run was performed following the Xenium Analyzer User Guide (CG000584). The on-instrument analysis was run with Xenium Onboard Analysis version 1.6.0.
| Metric | Non-diseased, pre-designed panel | Non-diseased, pre-designed + add-on panel | Cancer, pre-designed panel | Cancer, pre-designed + add-on panel |
|---|---|---|---|---|
| Median transcripts per cell | 53 | 85 | 65 | 95 |
| Cells detected | 270,984 | 275,822 | 647,524 | 587,115 |
| Decoded transcripts per 100 µm² | 69.3 | 89.4 | 106.1 | 141.3 |
| Total high quality decoded transcripts | 23,484,253 | 32,106,157 | 56,506,816 | 70,596,272 |
| Region area (µm²) | 49,731,580 | 51,498,757 | 58,844,126 | 60,177,828 |
How to view data
Interactively explore data with Xenium Explorer by downloading the Xenium Output Bundle (or Xenium Explorer subset) file. The subset bundle contains the experiment.xenium, morphology_mip.ome.tif, analysis_summary.html, cells.zarr.zip, cell_feature_matrix.zarr.zip, transcripts.zarr.zip, and analysis.zarr.zip files. See the Getting Started with Xenium Explorer page for more details. Follow these instructions to view the post-Xenium H&E image or image alignment file in Xenium Explorer for the non-diseased pre-designed panel and cancer pre-designed + add-on panel samples.
This dataset is licensed under the Creative Commons Attribution 4.0 International (CC BY 4.0) license. 10x citation guidelines available here.