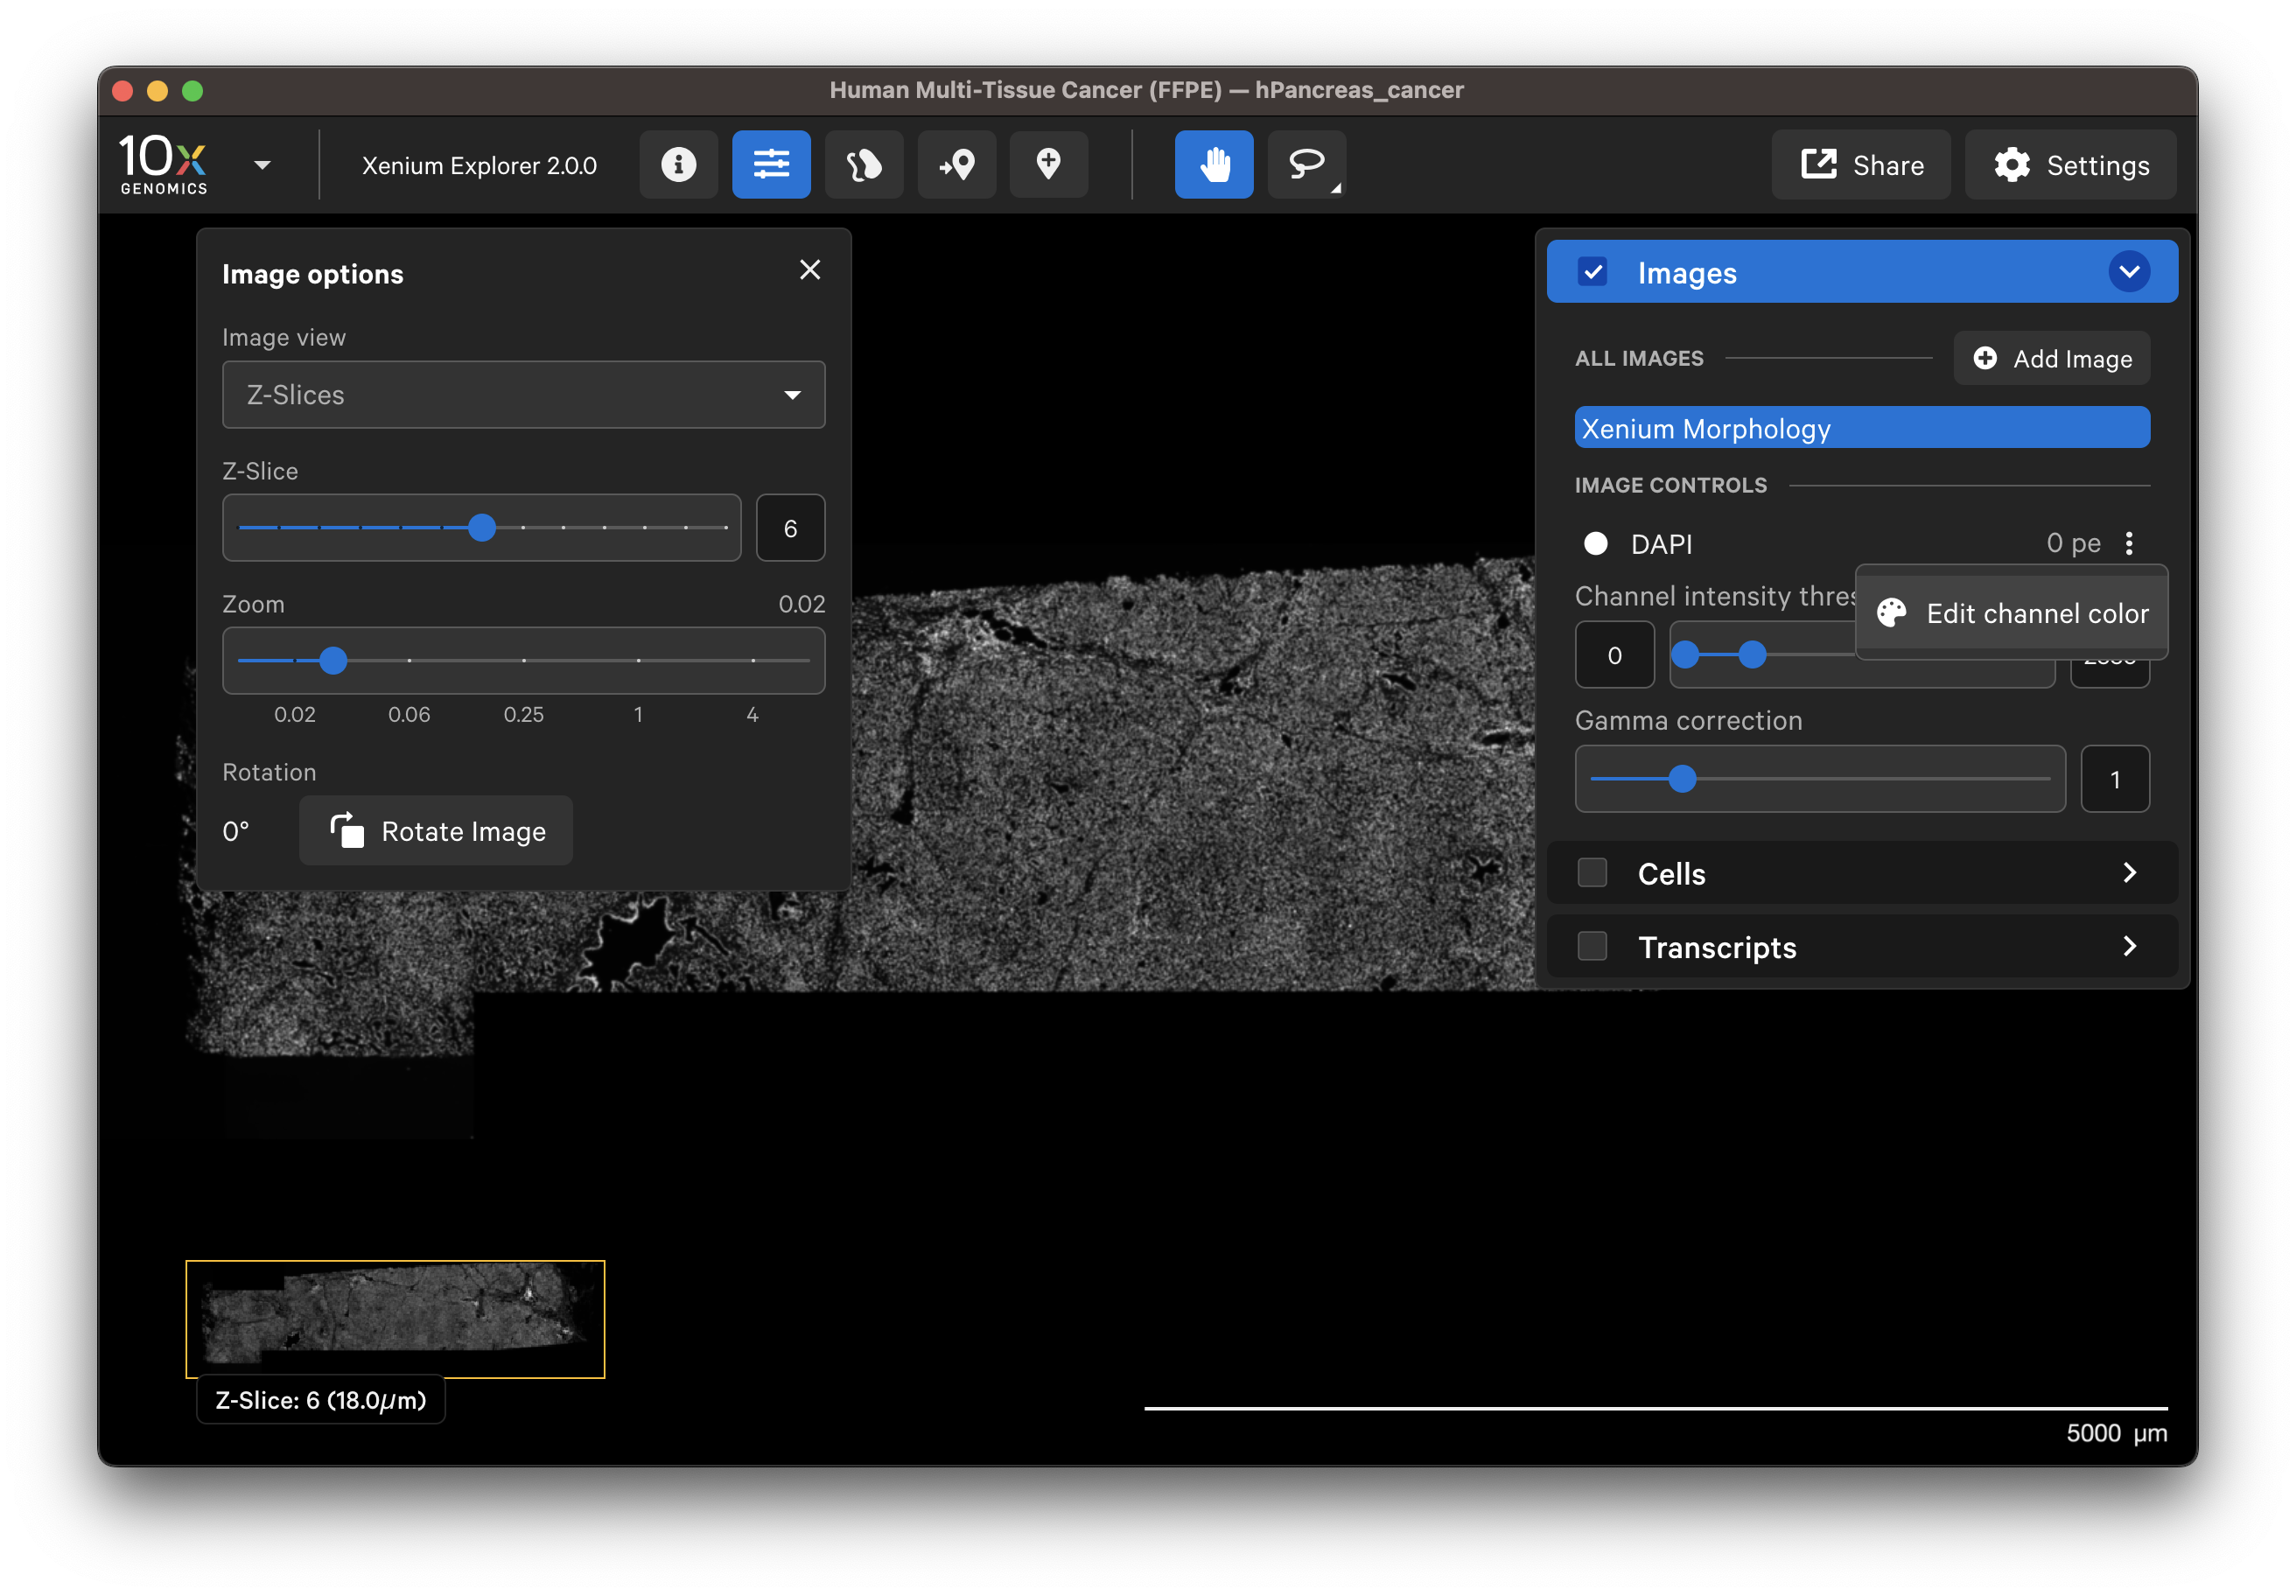
The Xenium Analyzer captures vertical stacks of images every cycle and in every channel for multiple fields of view. The stacks are processed and stitched together to build a single image of the tissue section. Xenium Explorer displays the X-Y dimensions of the image. The Image options panel allows you to explore the Z-dimension.
- Zoom: The zoom slider controls zooming in/out on the image. As you zoom in on pyramidal multi-file OME-TIFF images, Xenium Explorer changes which pyramid level to visualize. As downsampled images are inherently smoother than the full resolution image, the zoomed-out image will look smoother than the zoomed-in image.
- Rotation: All data in the main Xenium Explorer window can be rotated in 90 degree increments by clicking the Rotate Image button (Per-Gene Localization images cannot be rotated at this time).
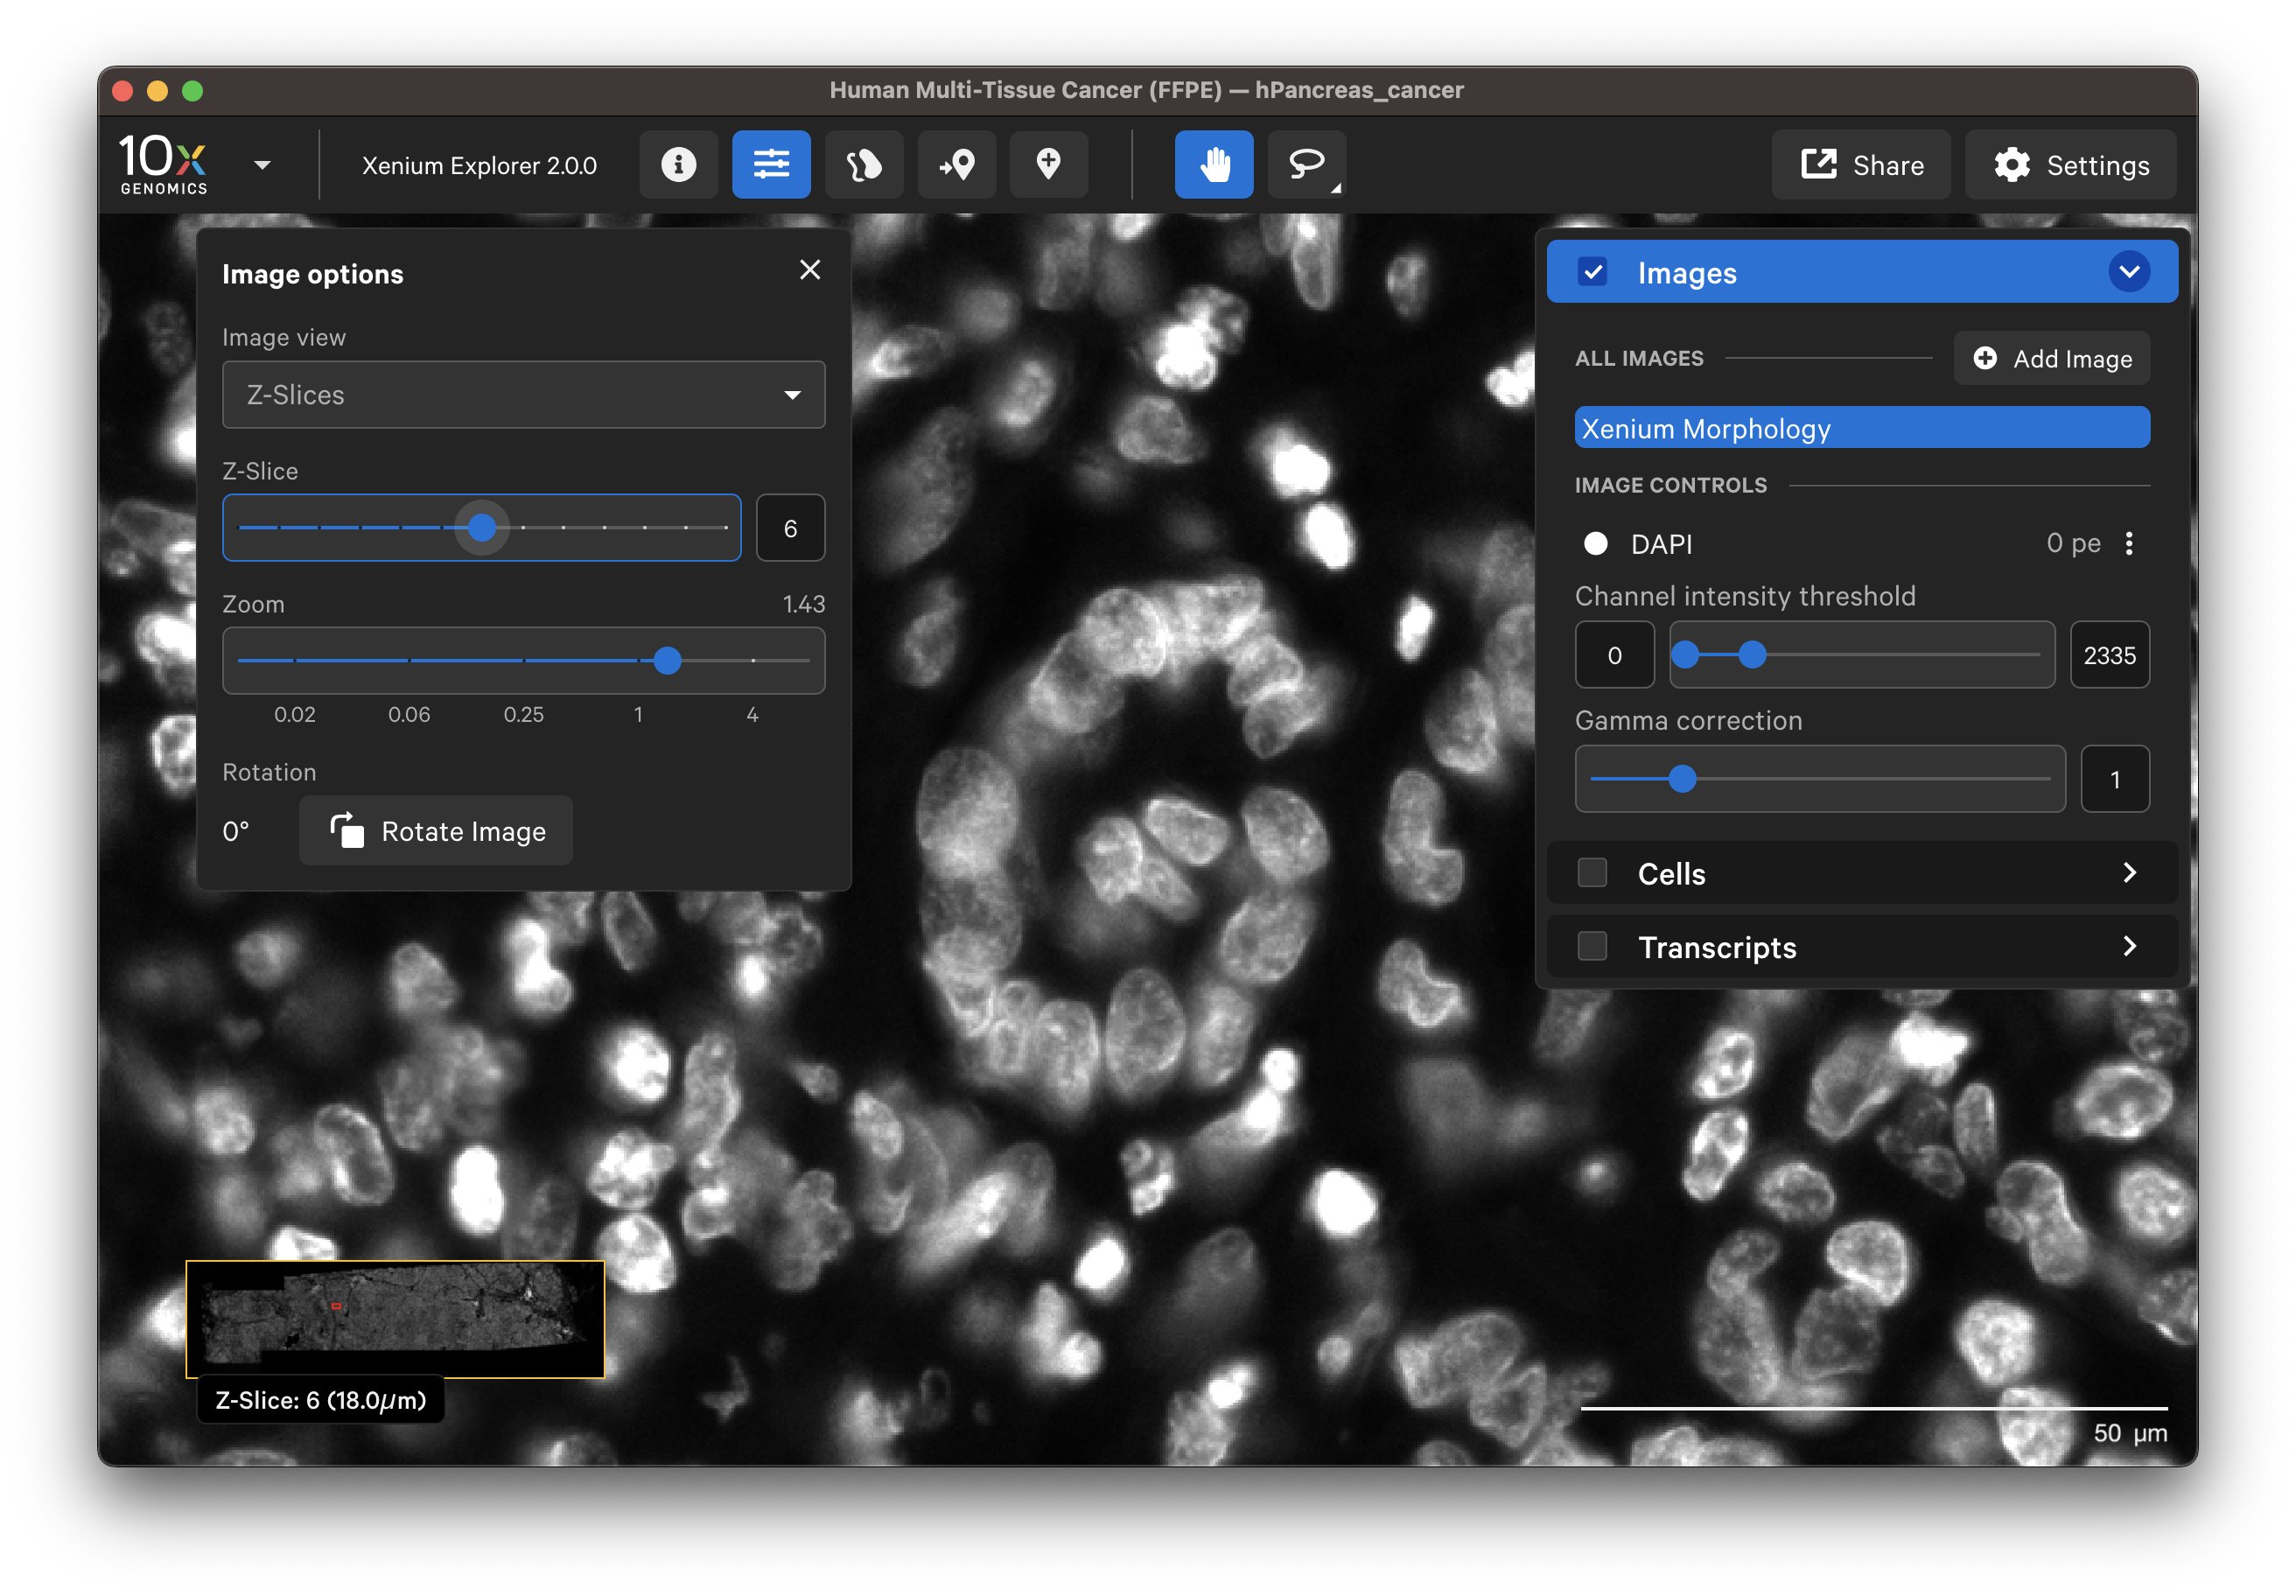
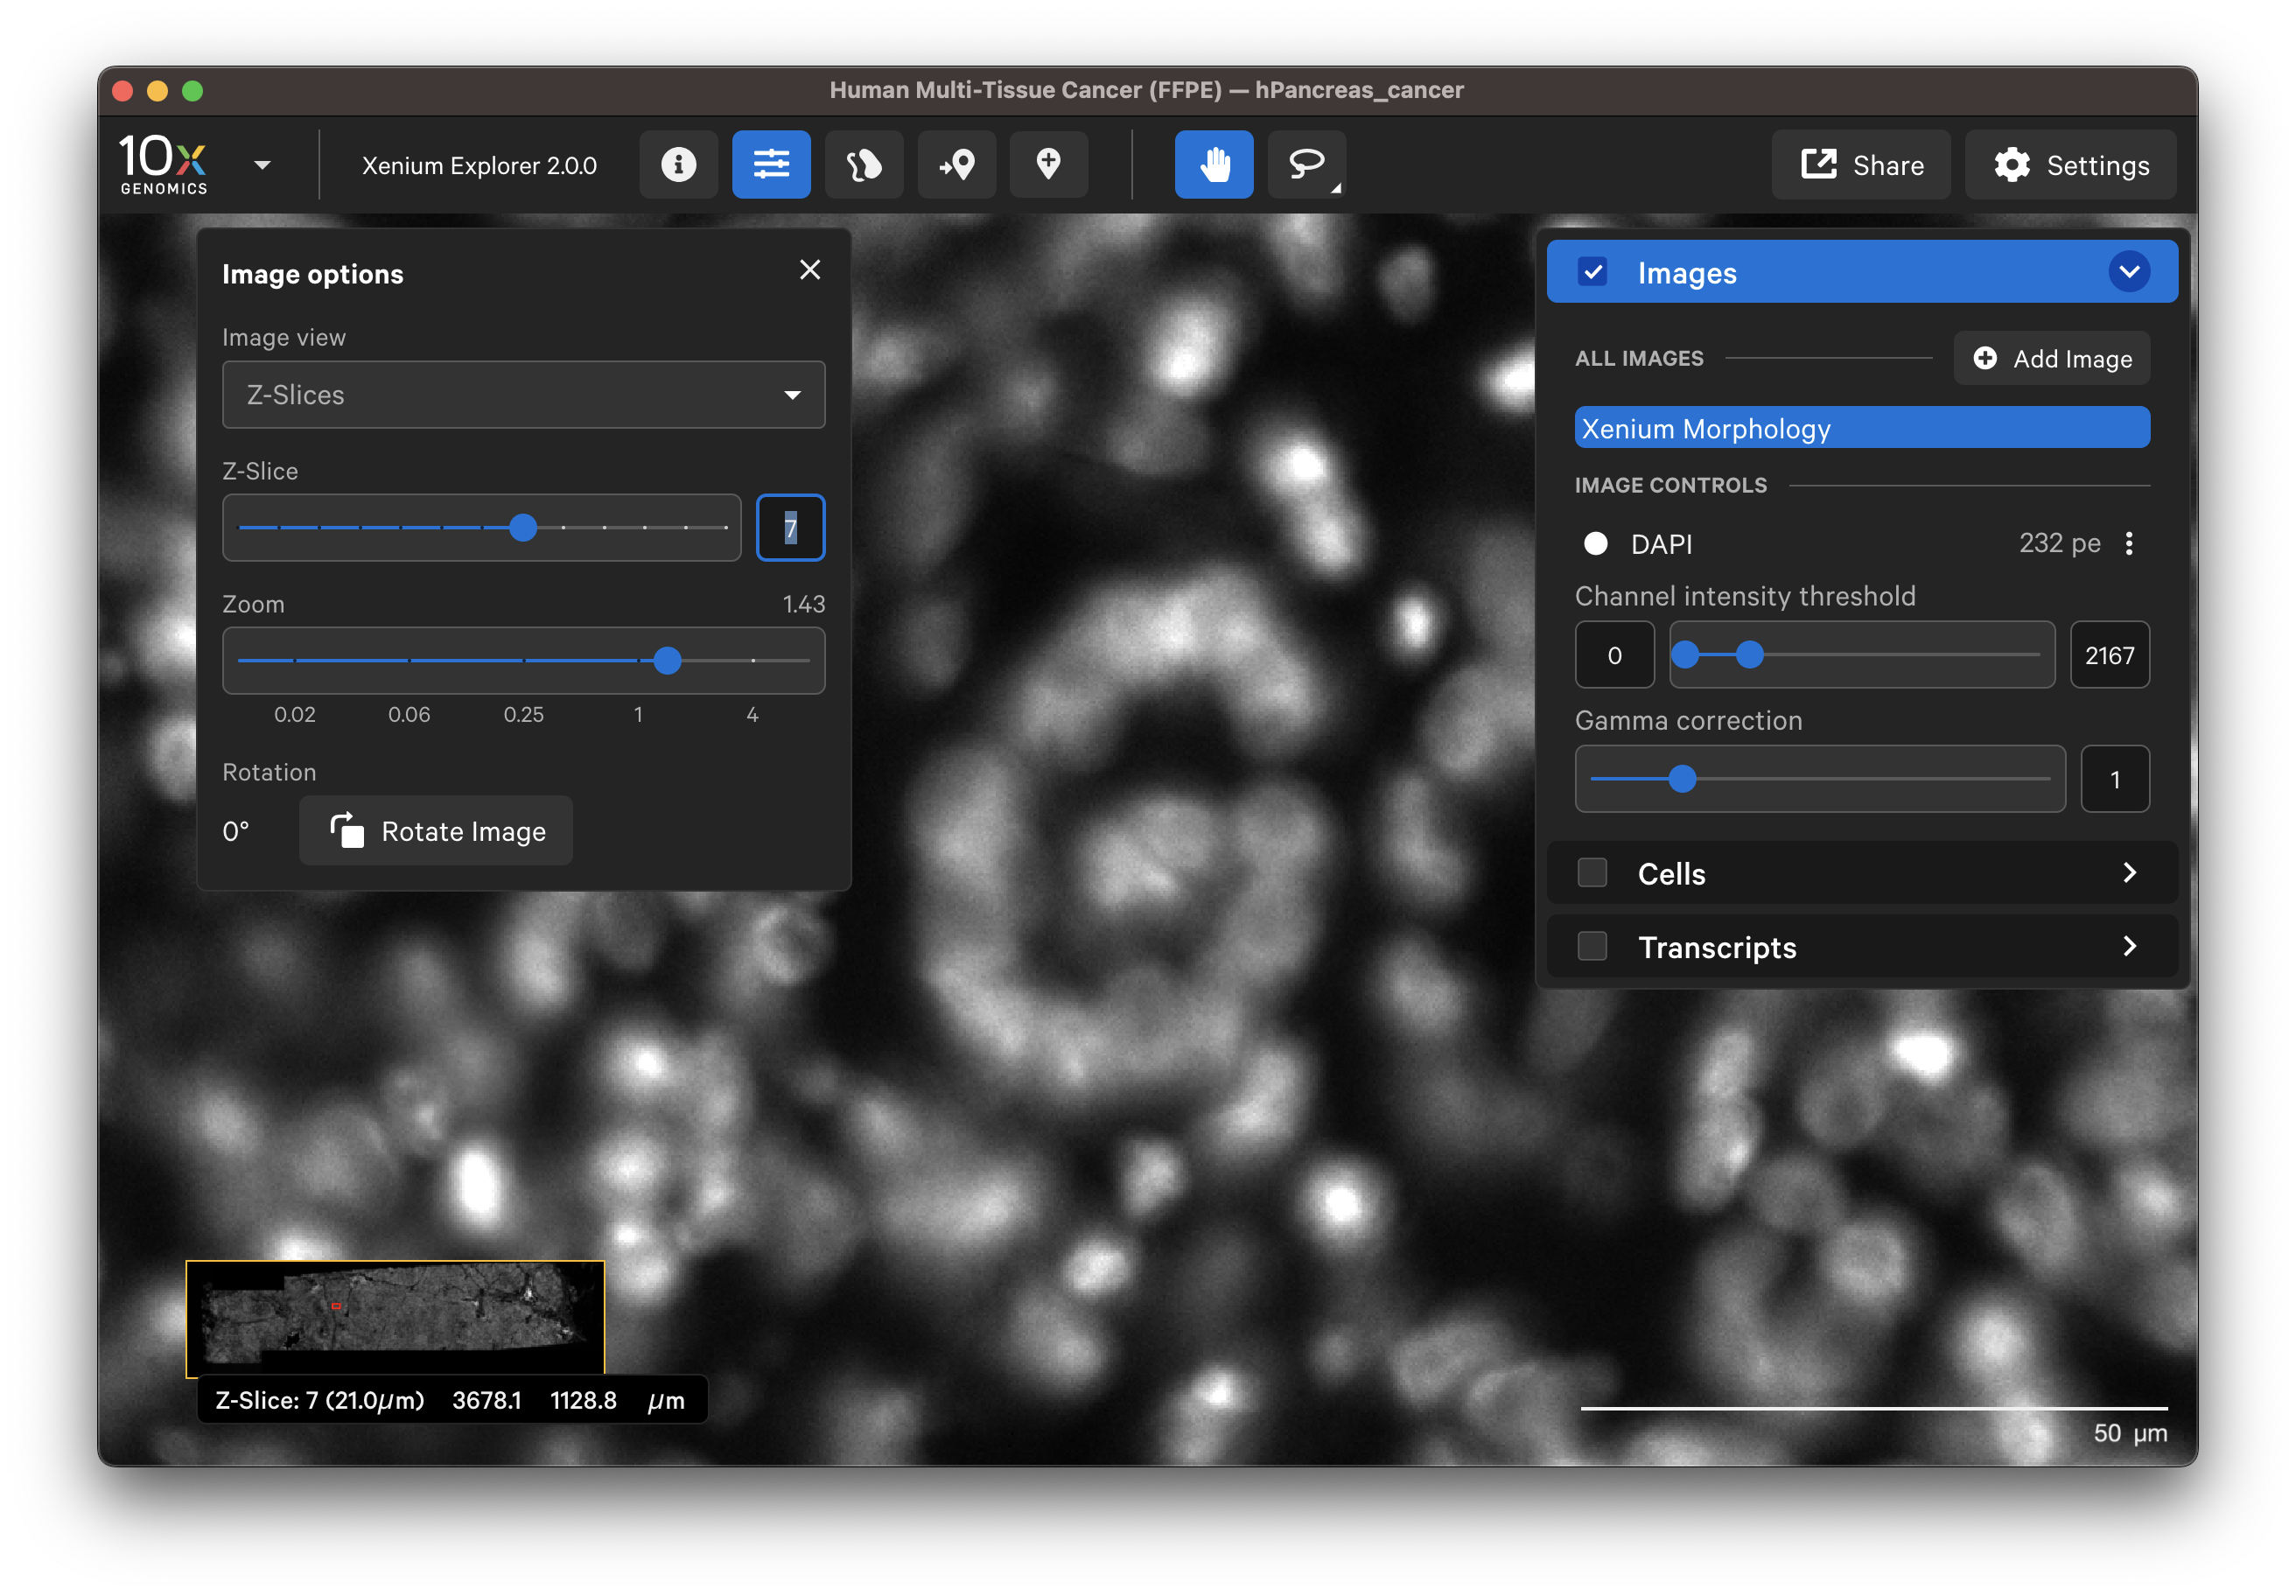
When Z-Slices is selected as the image view, you can view the 3D DAPI morphology.ome.tif tissue images from different Z-plane depths. The Z-slice depth in µm is shown in the lower left-hand corner. Zoom in to a region of the image, and click through different Z-slices. The nuclei should look fuzzy, come into focus, and then go out of focus again as you sweep through the Z-plane of that region of the tissue. This feature can be useful for examining cell structure within the tissue volume.
The Autofocus option displays the single best-focus Z-plane from the morphology stain Z-stack morphology_focus/ch[xxxx]_[marker name].ome.tif images. The background is minimized in this image. It works best for cells in the tissue that approximate a monolayer, while cells above or below the focal Z-plane may be missed.
- In XOA v4.0, the directory contains the DAPI-stained image, as well as additional image files depending on the assay. Multimodal cell segmentation workflow data include boundary and interior cell images. Xenium Protein workflow data include cell segmentation, protein, and autofluorescence channel images.
- Previous versions: In XOA v2.0 - 3.3, the directory contains the DAPI-stained image, as well as boundary and interior cell images for the multimodal cell segmentation workflow. In XOA v1.0 - 1.9, the autofocus output file is called
morphology_focus.ome.tifand it is the DAPI stained image.
For multimodal cell segmentation datasets, the DAPI ch0000_dapi.ome.tif file must be present in the directory to load the dataset. To load data without the DAPI image, the OME-XML metadata information must be modified. Python tools such as ome-types can be used to view and modify metadata if needed.
This option is only available for data generated in XOA v1.0 - 1.9.
The maximum intensity projection technique converts a 3-dimensional stack of microscope images into a 2-dimensional image. The Maximum Intensity Projection of the DAPI Z-stack morphology_mip.ome.tif image displays the brightest pixel from each layer. All the cells will be visible, however there may be higher background from out-of-focus light.
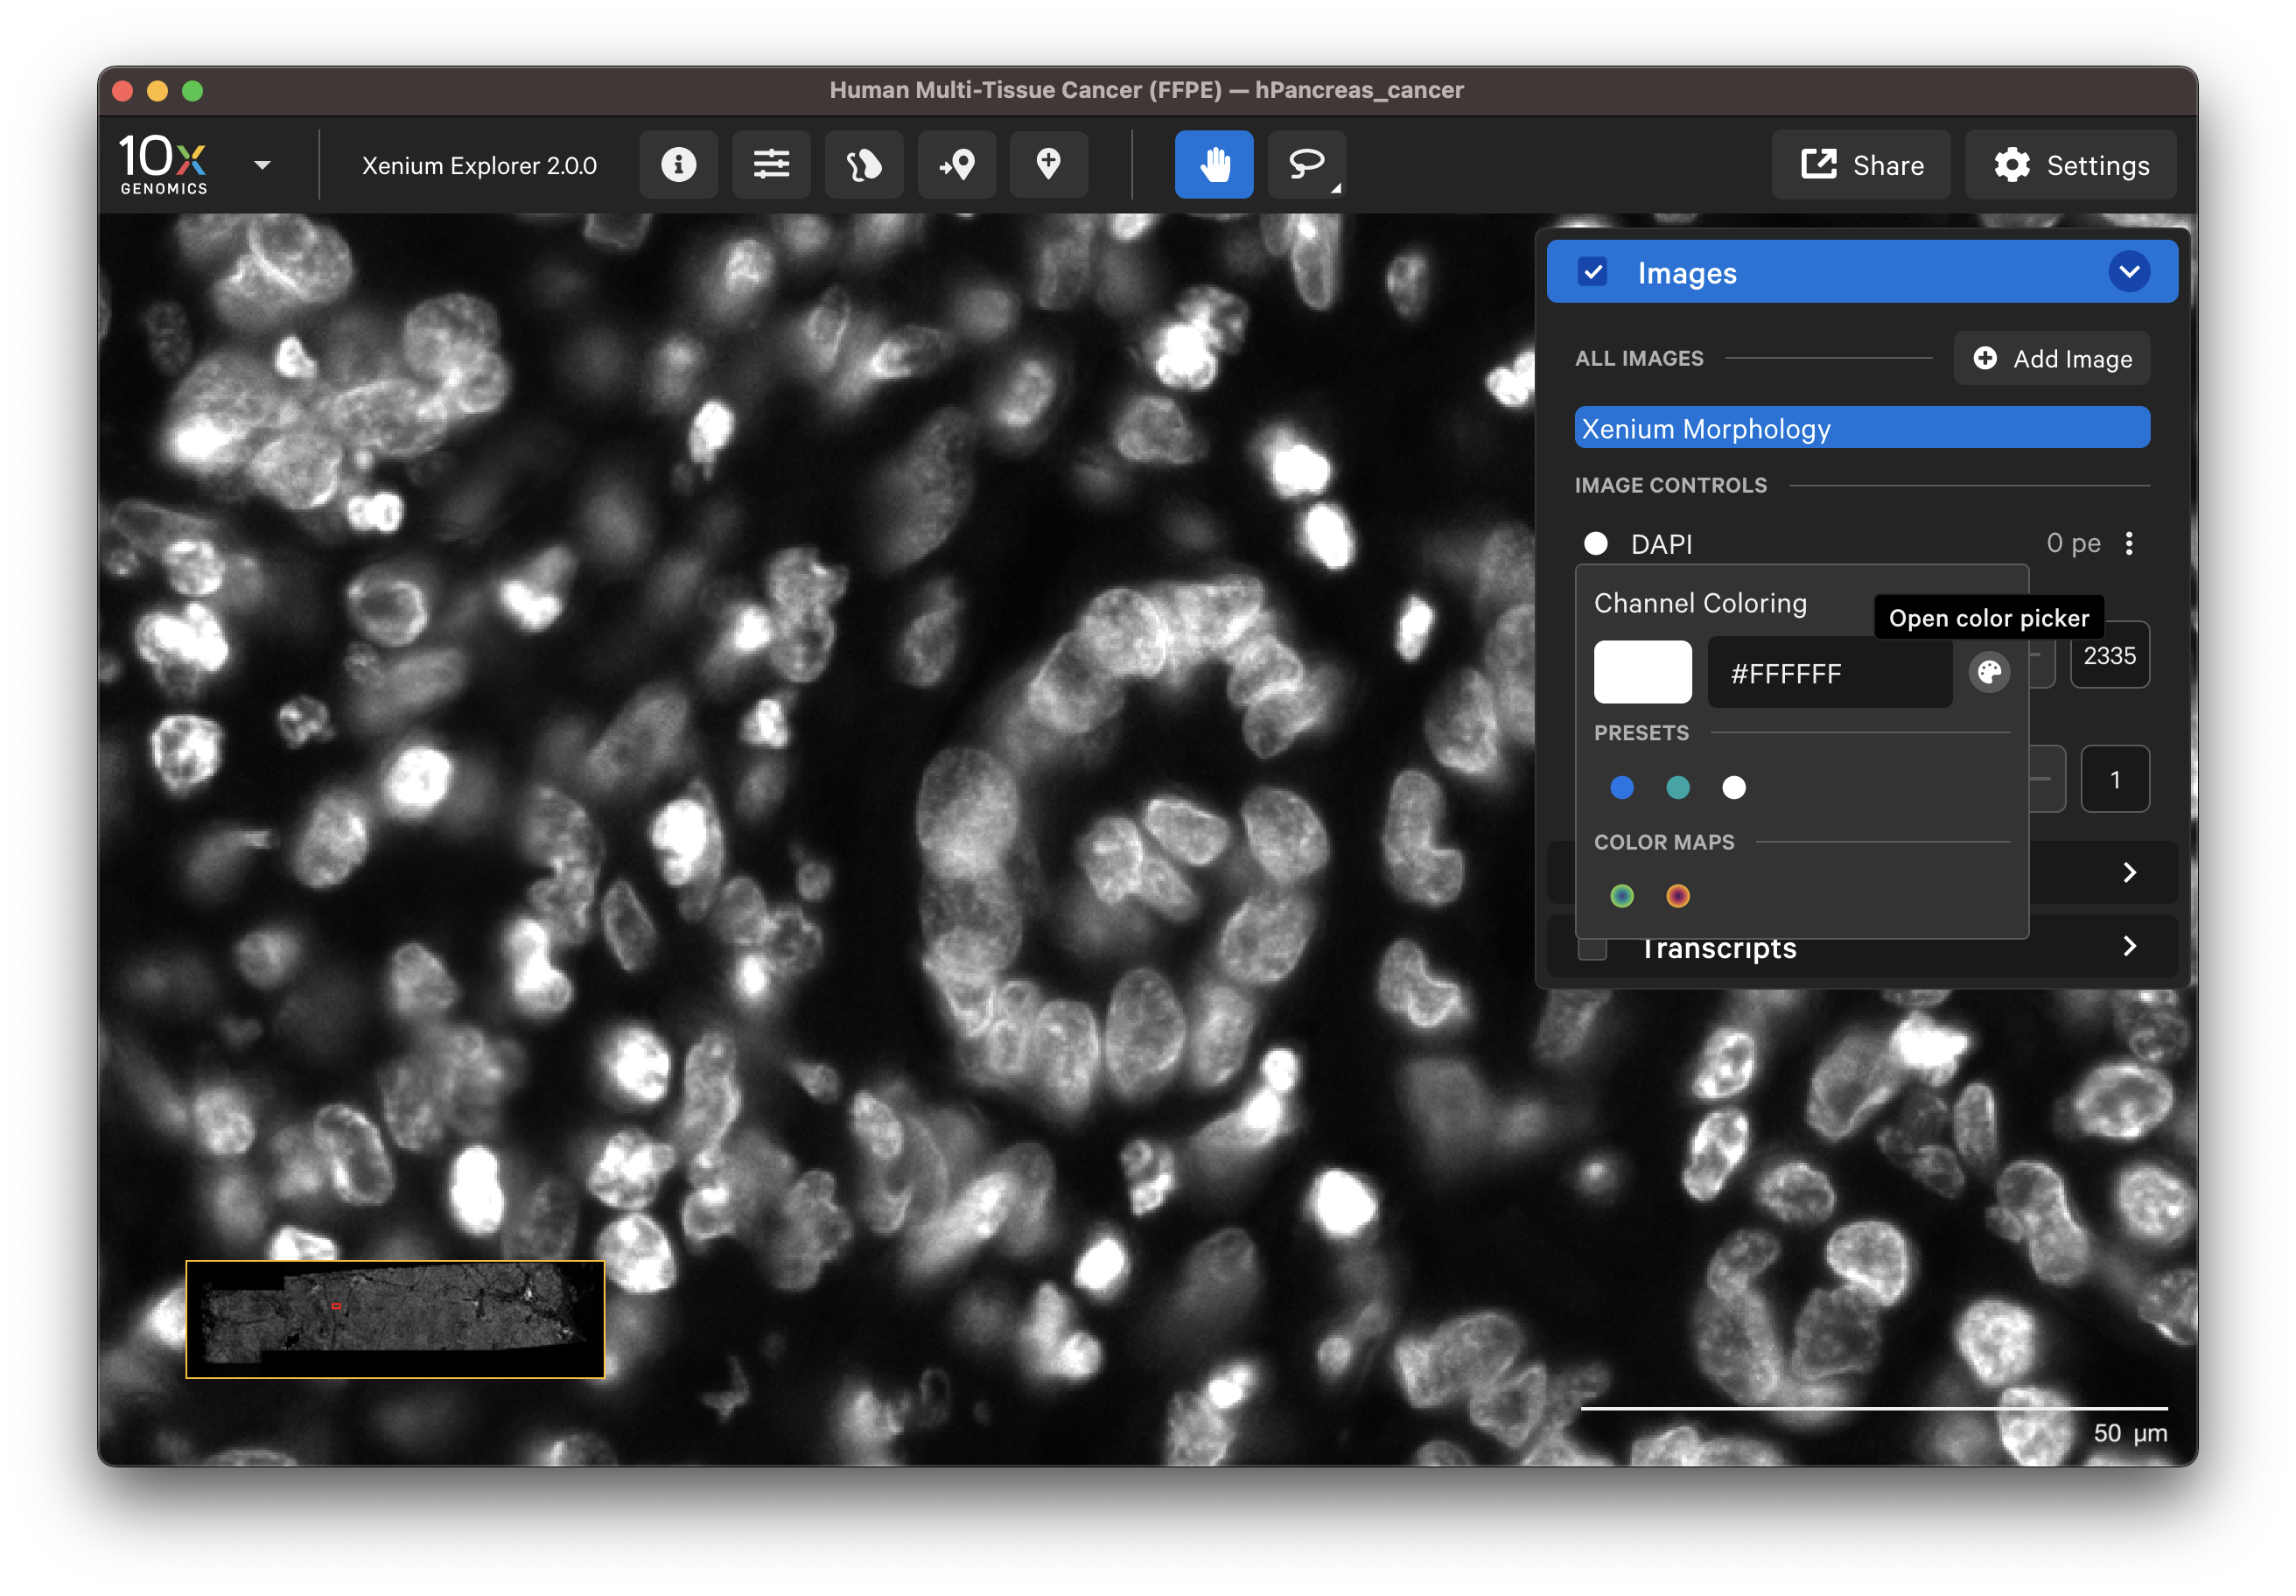
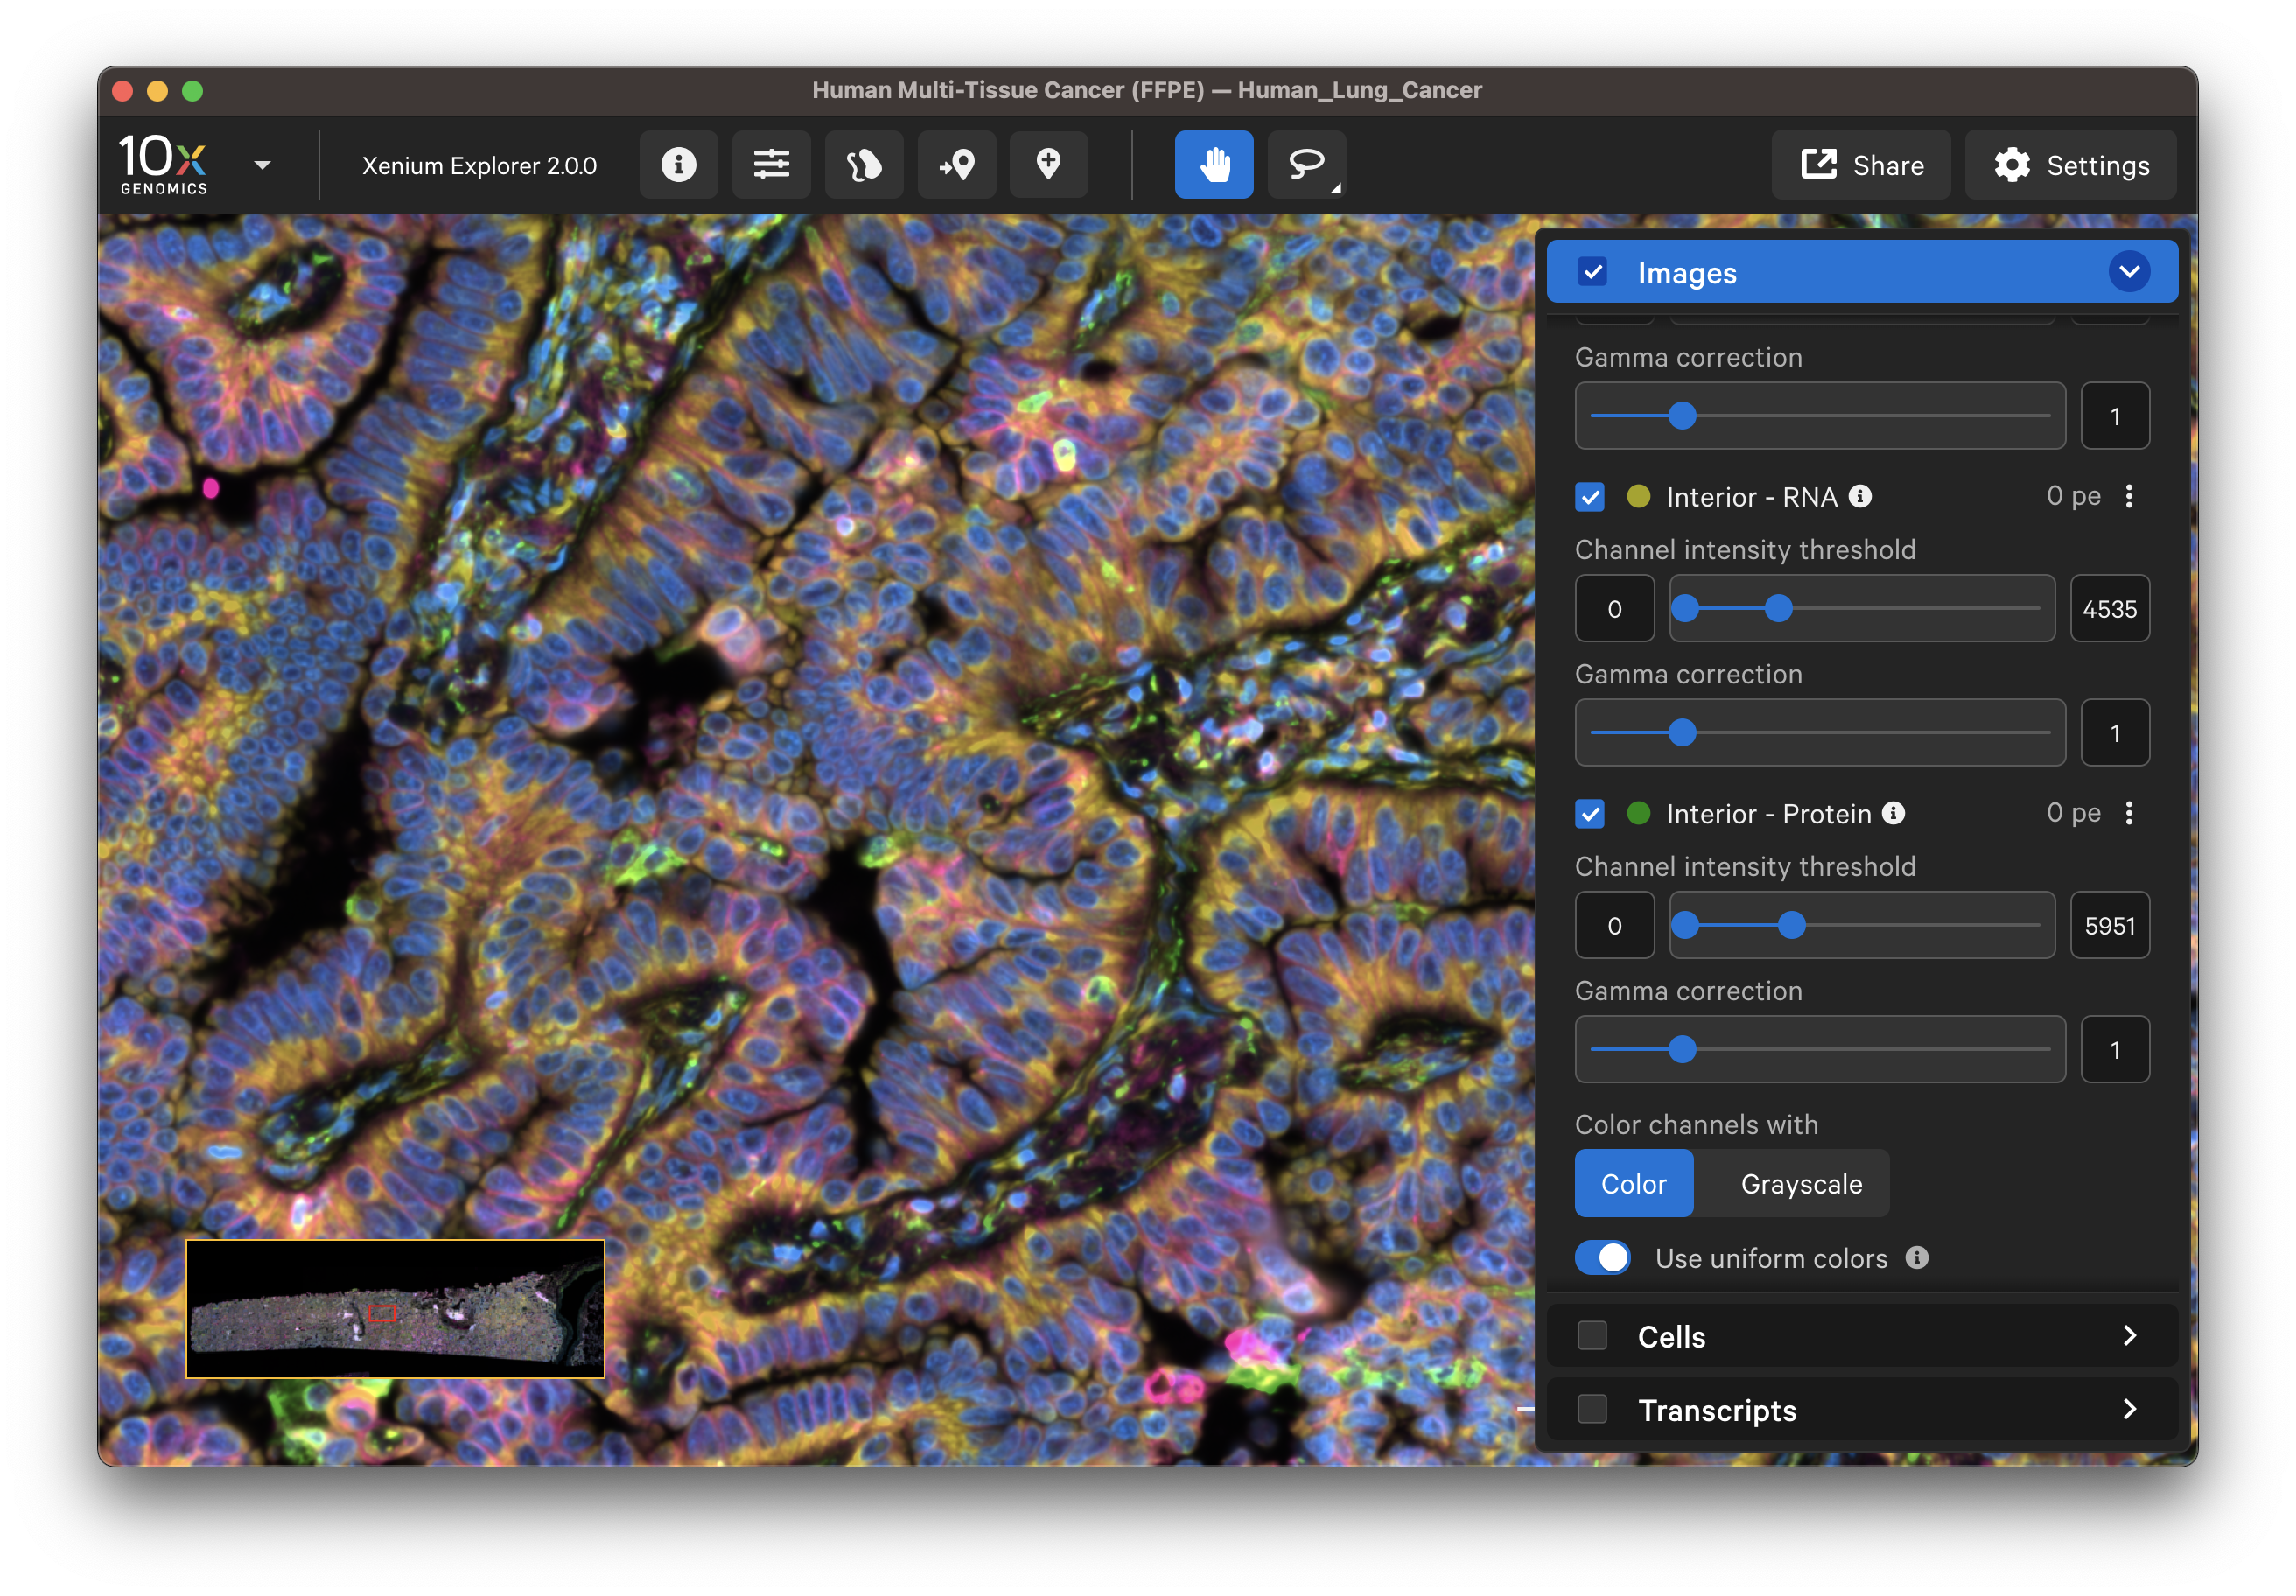
You can change the image channel intensity and contrast (gamma correction) with sliders. The channel color can be changed either by clicking the three vertical dots or the current color circle. The channel intensity is auto-leveled by default; click the three dots and select Auto-level channel to reset.
Post-Xenium H&E images (Xenium Explorer v1.2+) and IF images (Xenium Explorer v1.3+) can be viewed and aligned in the UI. See the Image alignment tutorial for details. In v2.0 and later, Xenium Explorer can open IF images with more than six channels and display six at a time (check box next to stain name to select).
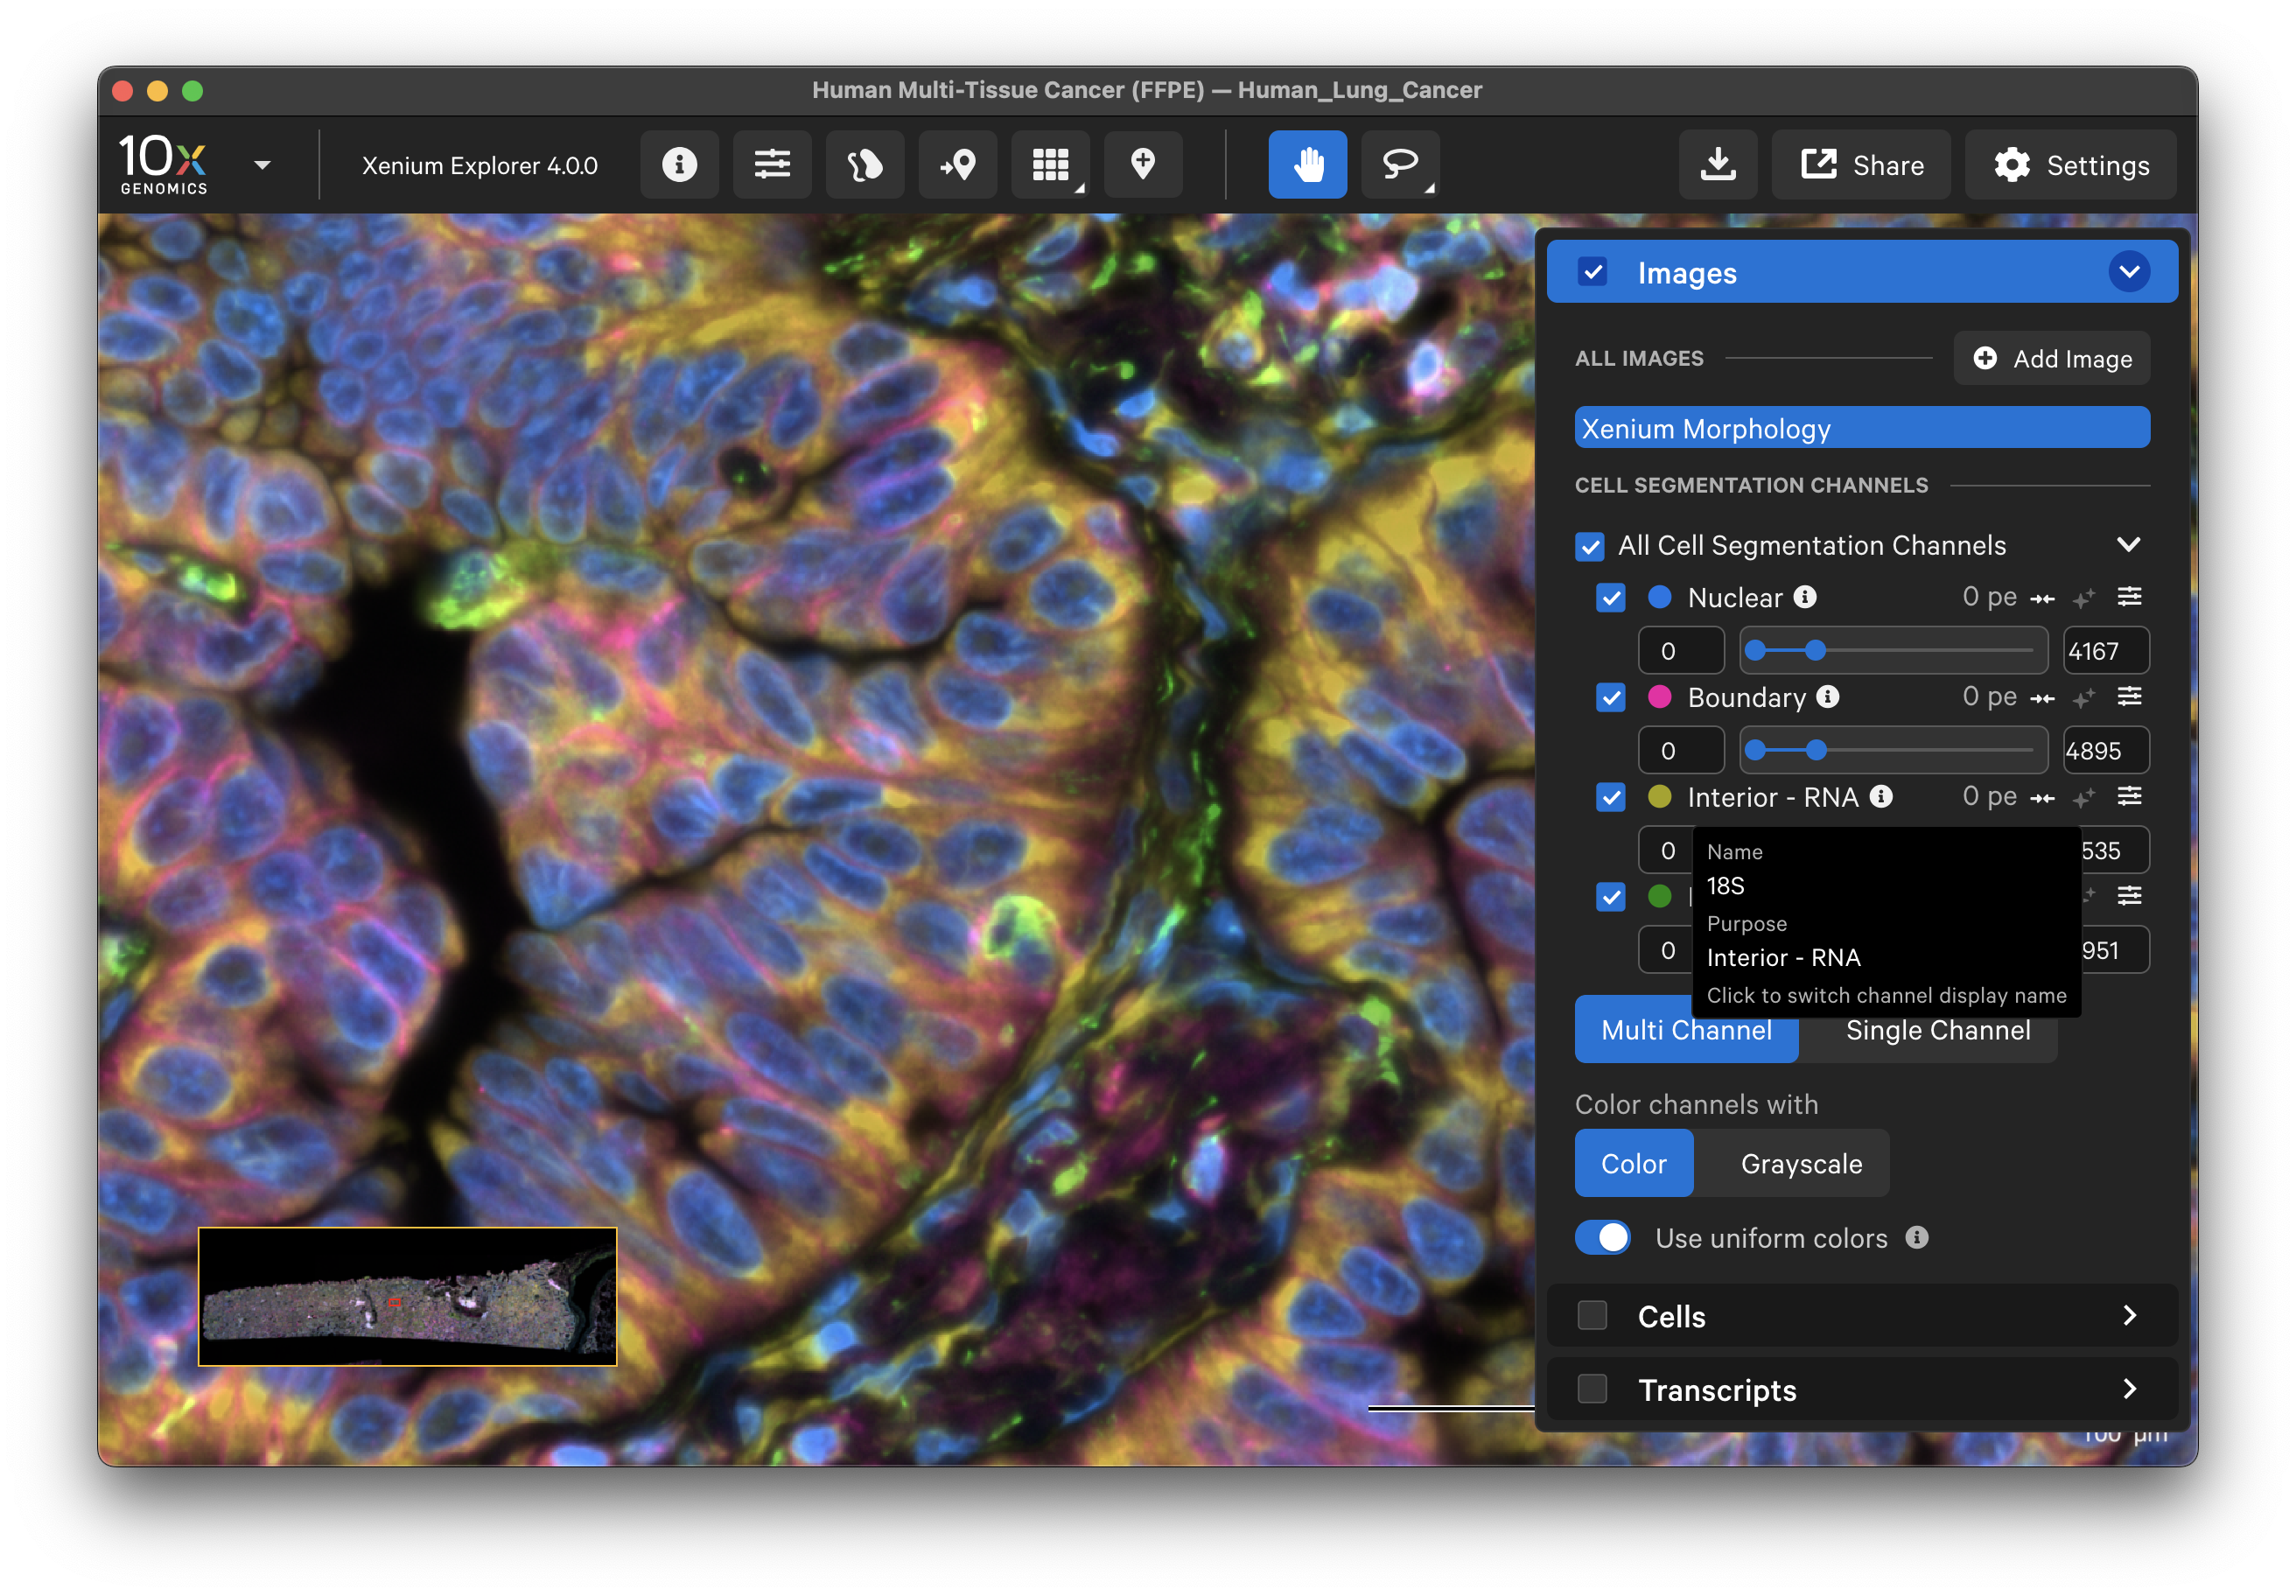
In Xenium Explorer v2.0 and later, the Images layer loads all morphology channels for 2D multichannel images. Select and layer all channel images to view them simultaneously (Multi Channel) or view one channel at a time (Single Channel).
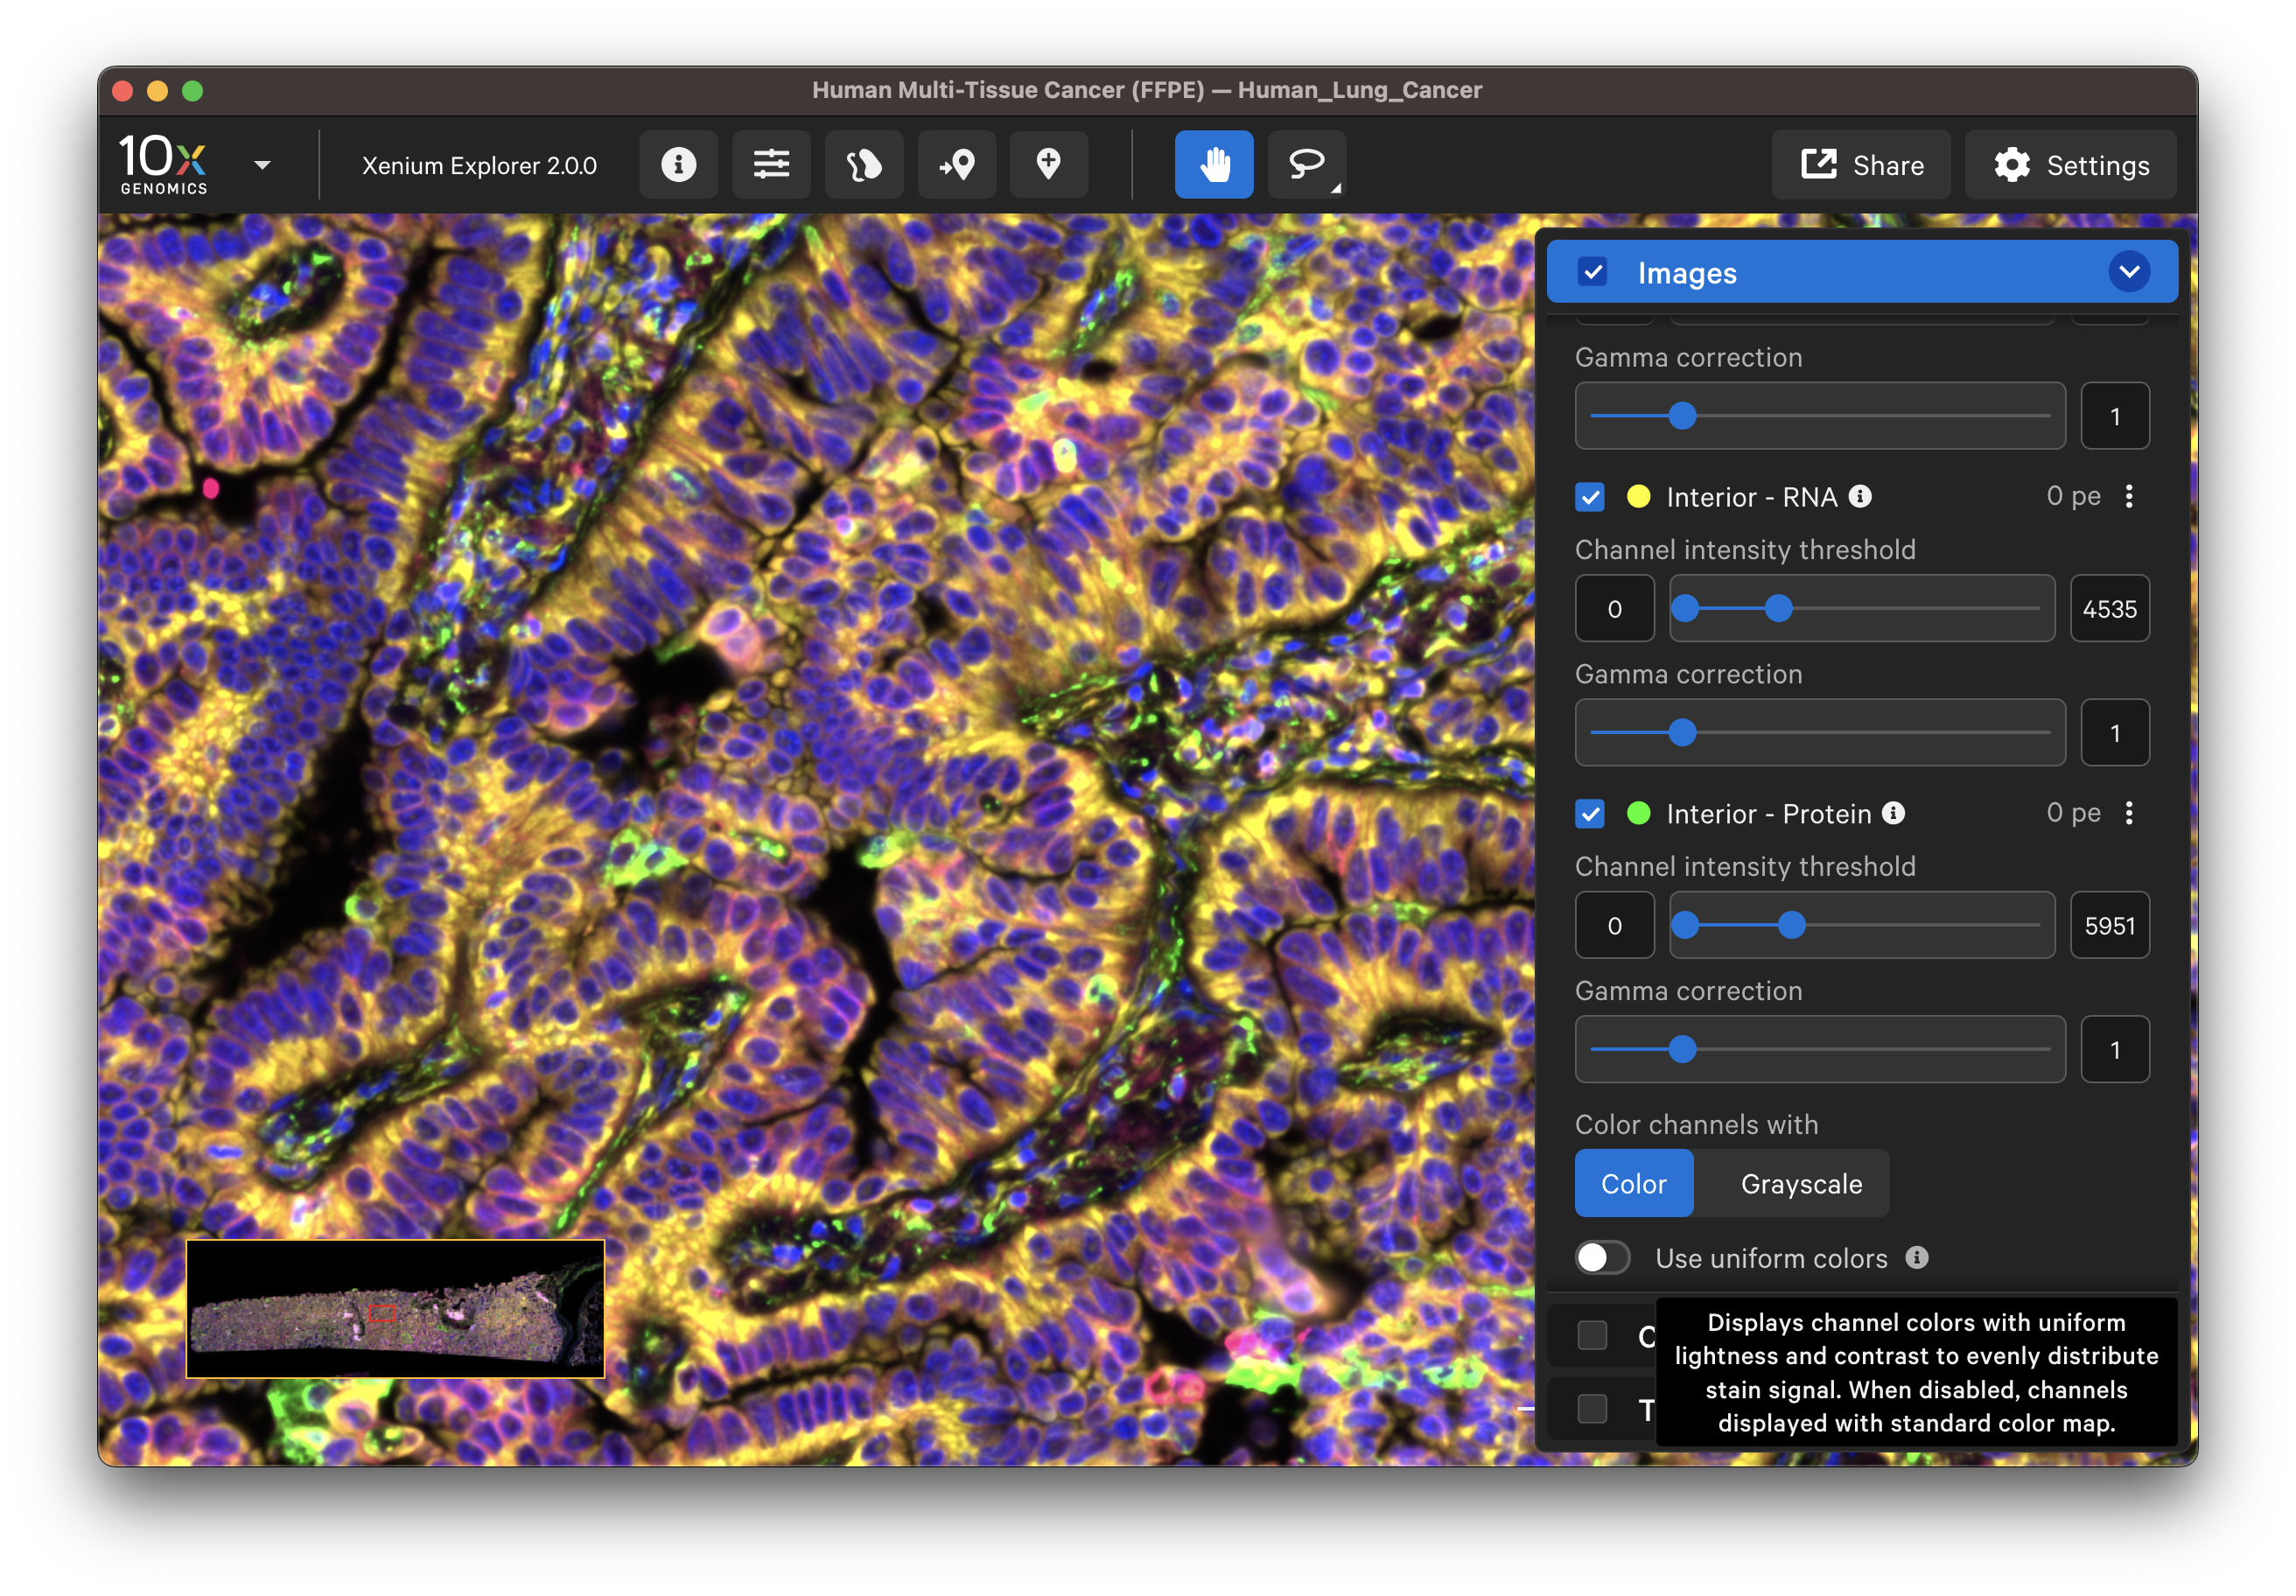
The default channel colors can be changed by clicking on the circle icon. It is also possible to toggle between viewing channels with colors or in grayscale. By default, channel colors are displayed with uniform colors (based on CIELAB color space). This color map is intended to display channel colors with uniform lightness and contrast to evenly distribute multichannel stain signals. When disabled, channels are displayed with a standard color map.
| Uniform colors | Standard colors |
|---|---|
 |  |
Starting in Xenium Explorer v4.0, the pixel intensity slider includes more options to adjust brightness. Click the arrows to expand or contract the displayed slider range. This is particularly useful for changing values for channels with very narrow minimum and maximum values. The minimum and maximum values can also be manually entered or adjusted with up and down arrows. Click the star icon to rest to the auto-level values.
Multimodal cell segmentation dataset images are listed in the Cell Segmentation Channels section. The channels are labeled by purpose: Nuclear, Boundary, Interior - RNA, and Interior - Protein. Click the info icon to switch the labels to the name of the stain(s).
In Xenium Explorer v4.0, the Xenium Protein images generated with the Xenium In Situ Gene and Protein Expression with Cell Segmentation Staining assay are listed in the Protein Channels section. Protein markers are grouped by protein subpanel, and each protein within a subpanel is sorted by wavelength. Protein image OME-TIFF files include minimum and maximum photoelectron (pe) values to set the default dynamic range for data visualization in Xenium Explorer. These can be further adjusted using the sliders.
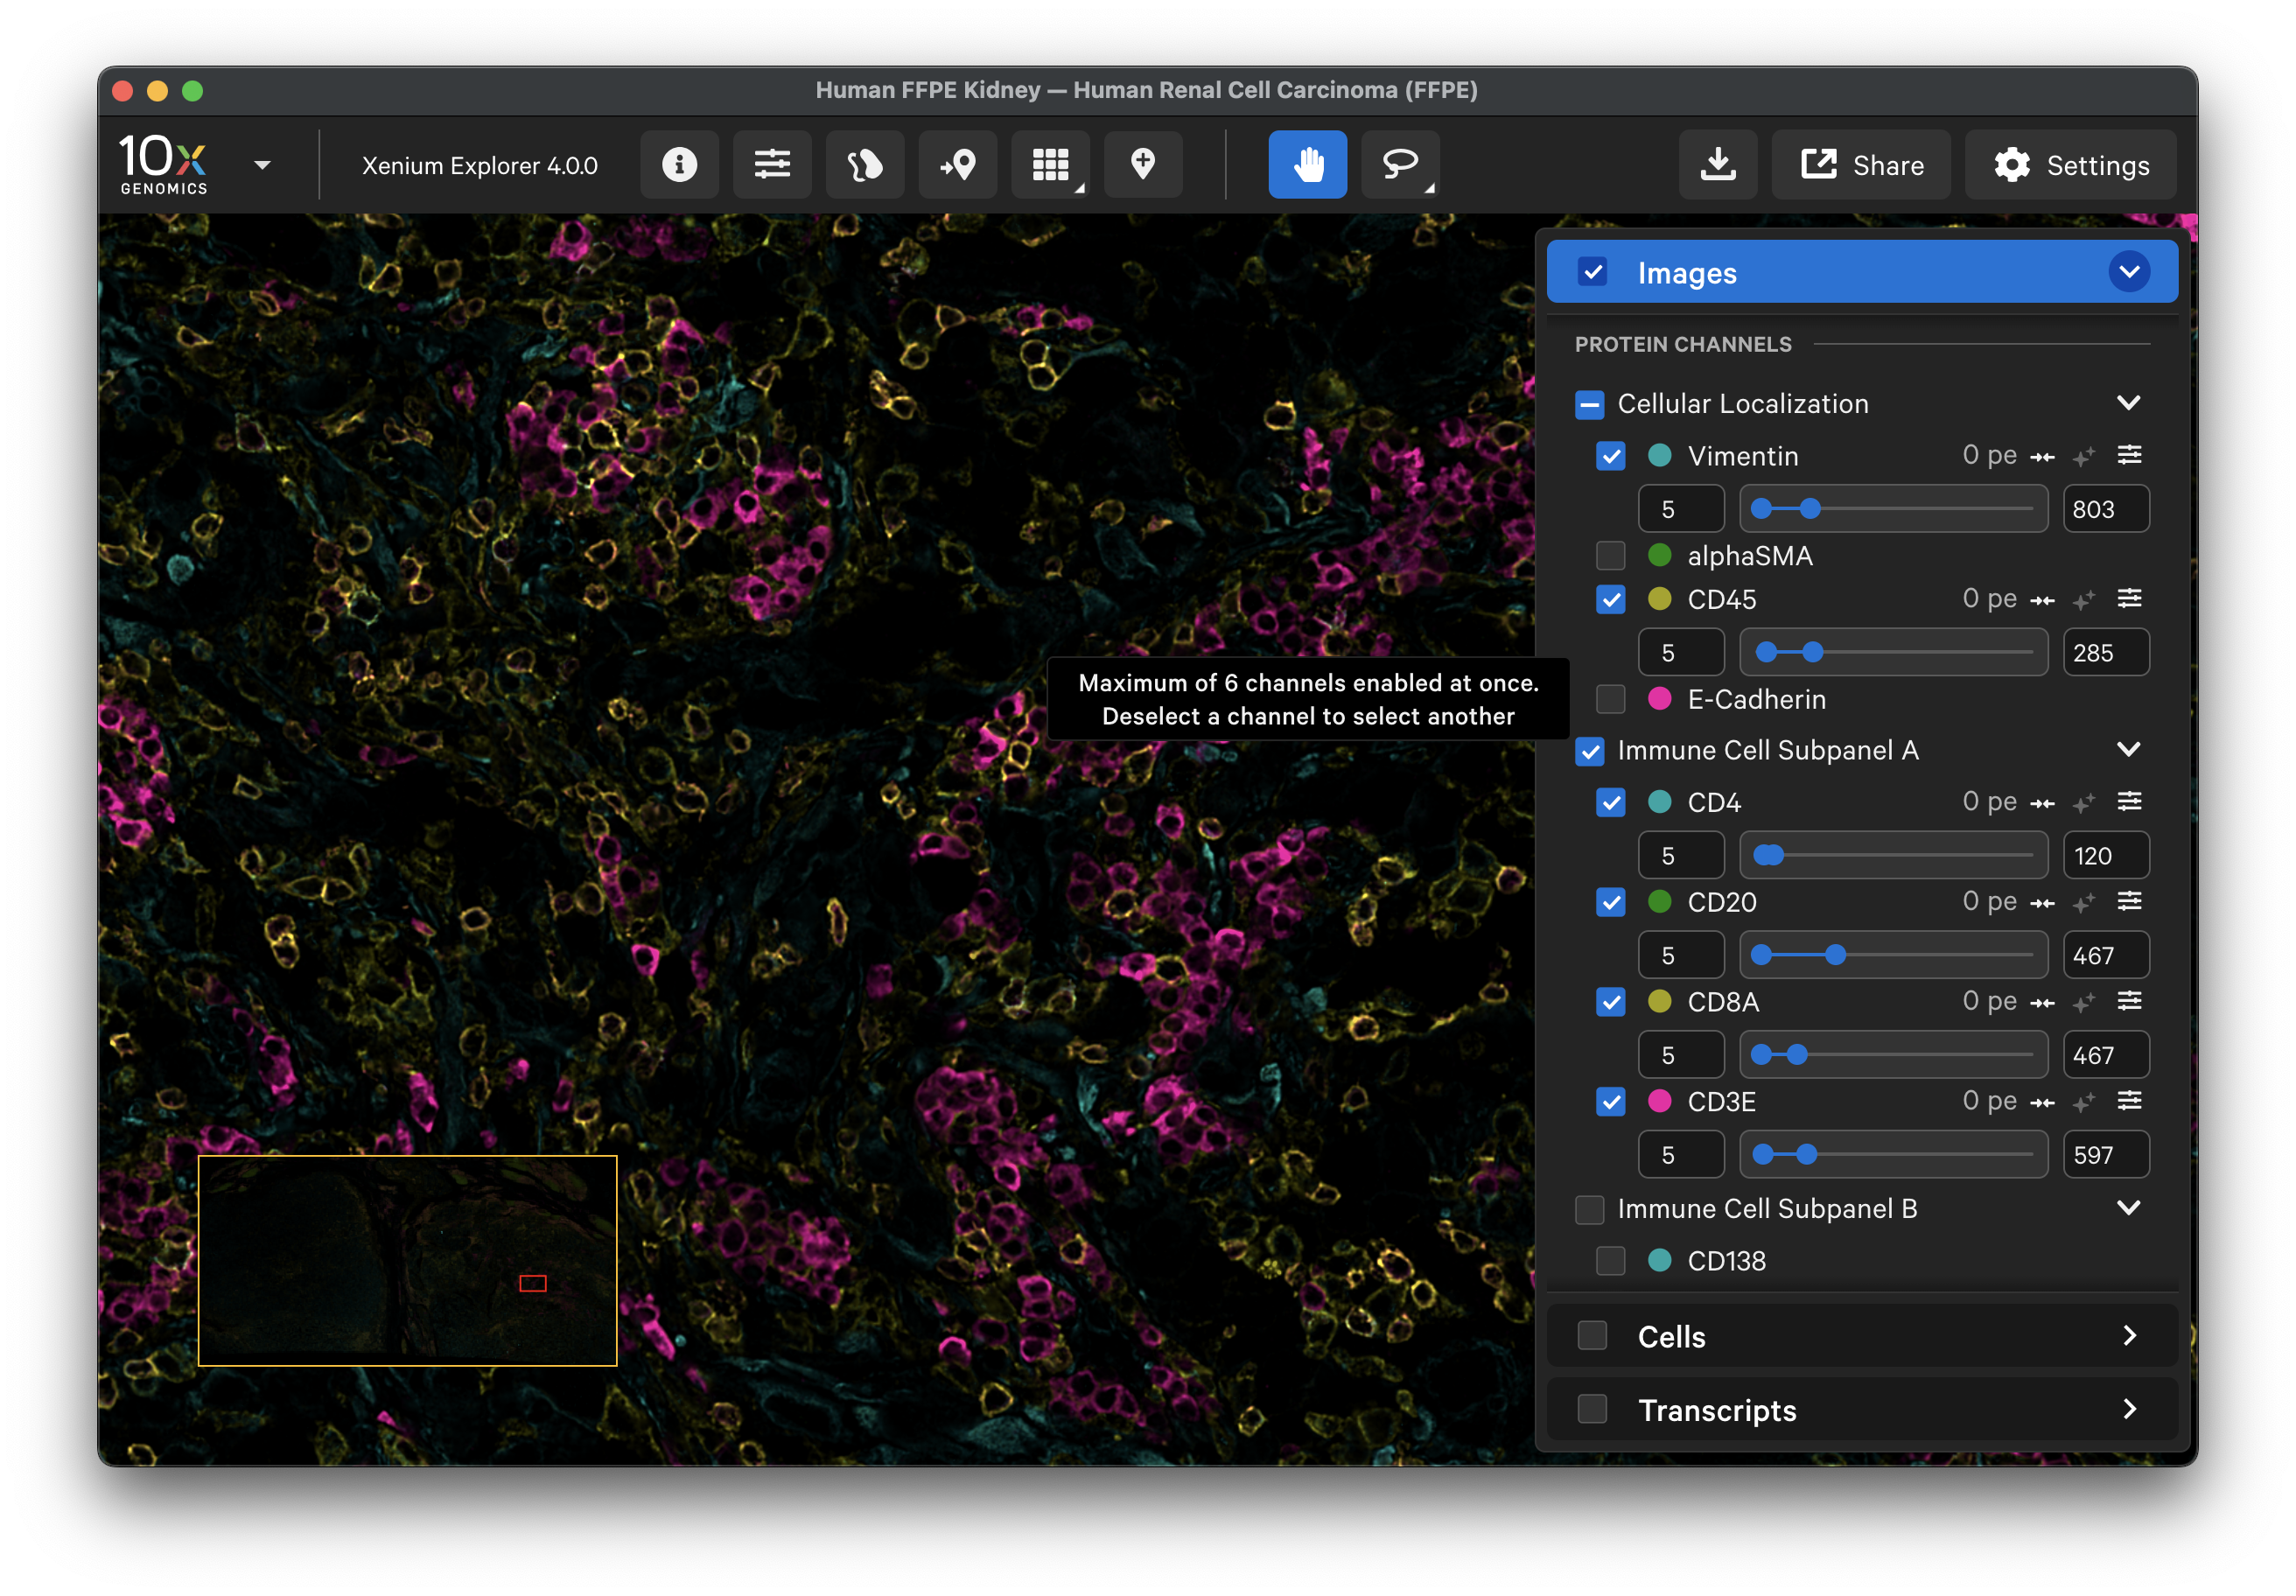
Auto-level minimum and maximum slider values for protein images:
- The minimum is set to 5. Pixel intensities less than 5 may be beyond the detection range for antibody staining, and caution should be taken if analyzed.
- The maximum is set to the 99.95th percentile of pixel values with intensities greater than 5.
Xenium Explorer v4.0 automatically subtracts the 100 unit offset applied following background subtraction from the intensity slider min/max range when you visualize protein images. This keeps the image values consistent with per cell and per selection quantification stats, which are read from the cell-feature matrix.
However, community-developed tools are not set up to automatically account for the offset value. When you open the morphology_focus/ protein images in these tools, the look up table (LUT) is not aware of the offset, resulting in incorrect auto-level ranges. To visualize protein stains with good brightness and contrast, start by adjusting the minimum to ~100 and use the histogram to set the maximum. Thus, in these tools, the true 0 signal intensity in the data becomes ~100. For example:
-
In QuPath, ensure that all the 2D
morphology_focus/images are downloaded. In this example, we have the DAPI, cell segmentation, background, and all 27 protein marker images in this folder. QuPath will error if files are missing. Open thech0000_dapi.ome.tifimage to view all images in QuPath. Click the "Brightness & contrast" button and add ~100 to the default minimum and maximum display values for each protein image (demo shown below in QuPath v0.6.0). They should now reflect the same visualization as in Xenium Explorer. -
Similarly, in ImageJ/Fiji, ensure all 2D morphology images are downloaded. Open the
ch0000_dapi.ome.tifimage to view all images, for example using the Bio-Formats Importer plugin. It will error if files are missing. Select "Image" > "Adjust" > "Brightness/Contrast…". Use the slider to add 100 to the default minimum display value for each protein image (demo shown below in ImageJ2 v2.16.0).
For Xenium Protein datasets, the background autofluorescence channels (1st background cycle) are listed in the Autofluorescence Images section. These images may be used for data QC to compare with the multichannel cell segmentation and protein images (example here).