Space Ranger outputs a subdirectory named spatial/, which includes quality control (QC) images to confirm accurate fiducial alignment and tissue detection, and other useful files. The exact outputs vary depending on the Space Ranger version used and the assay used (e.g. Visium v1, Visium CytAssist v2, Visium HD).
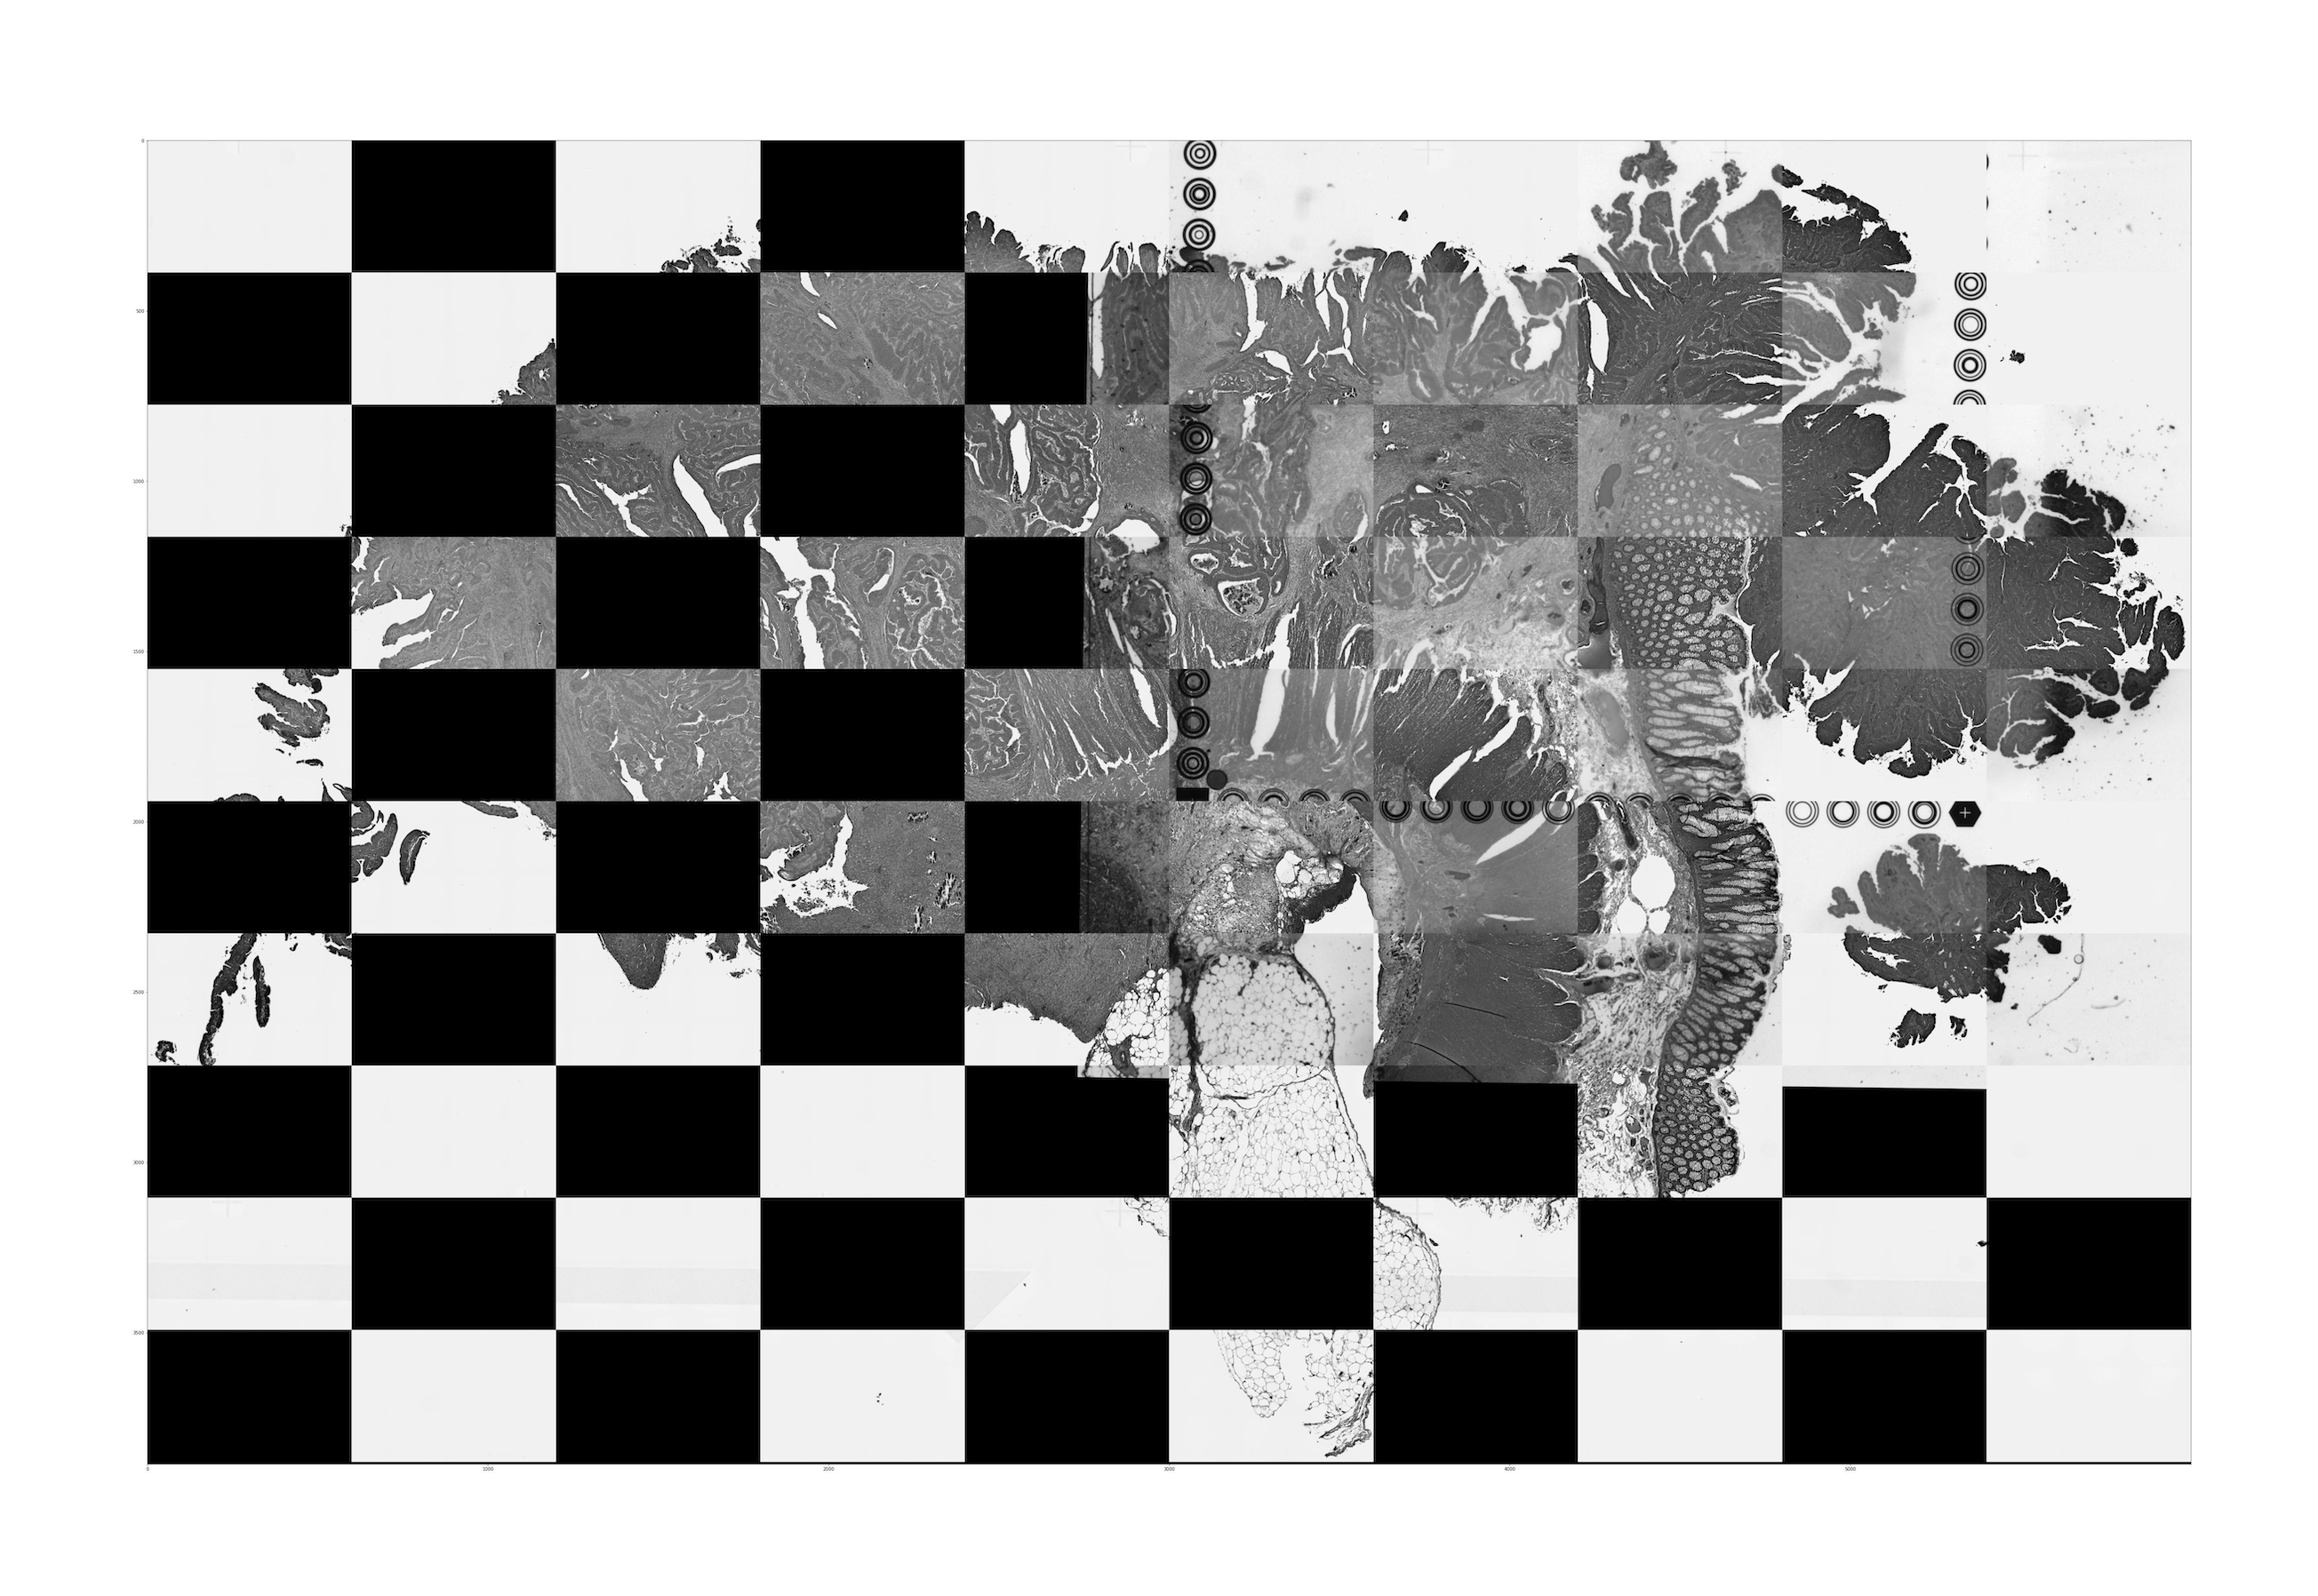
aligned_tissue_image.jpg: This image is generated when both CytAssist and microscope image inputs are provided (Visium CytAssist v2 and Visium HD). It captures the results of the image registration by merging the registered images in a checkerboard pattern with adjacent squares alternating between the two images. Successful image registration can be confirmed by assessing the continuity of tissue structures (e.g. tissue edges and interior tissue morphology). Dark background fluorescence microscope images are inverted to have a white background. An interactive version of these images is available in the web_summary.html.
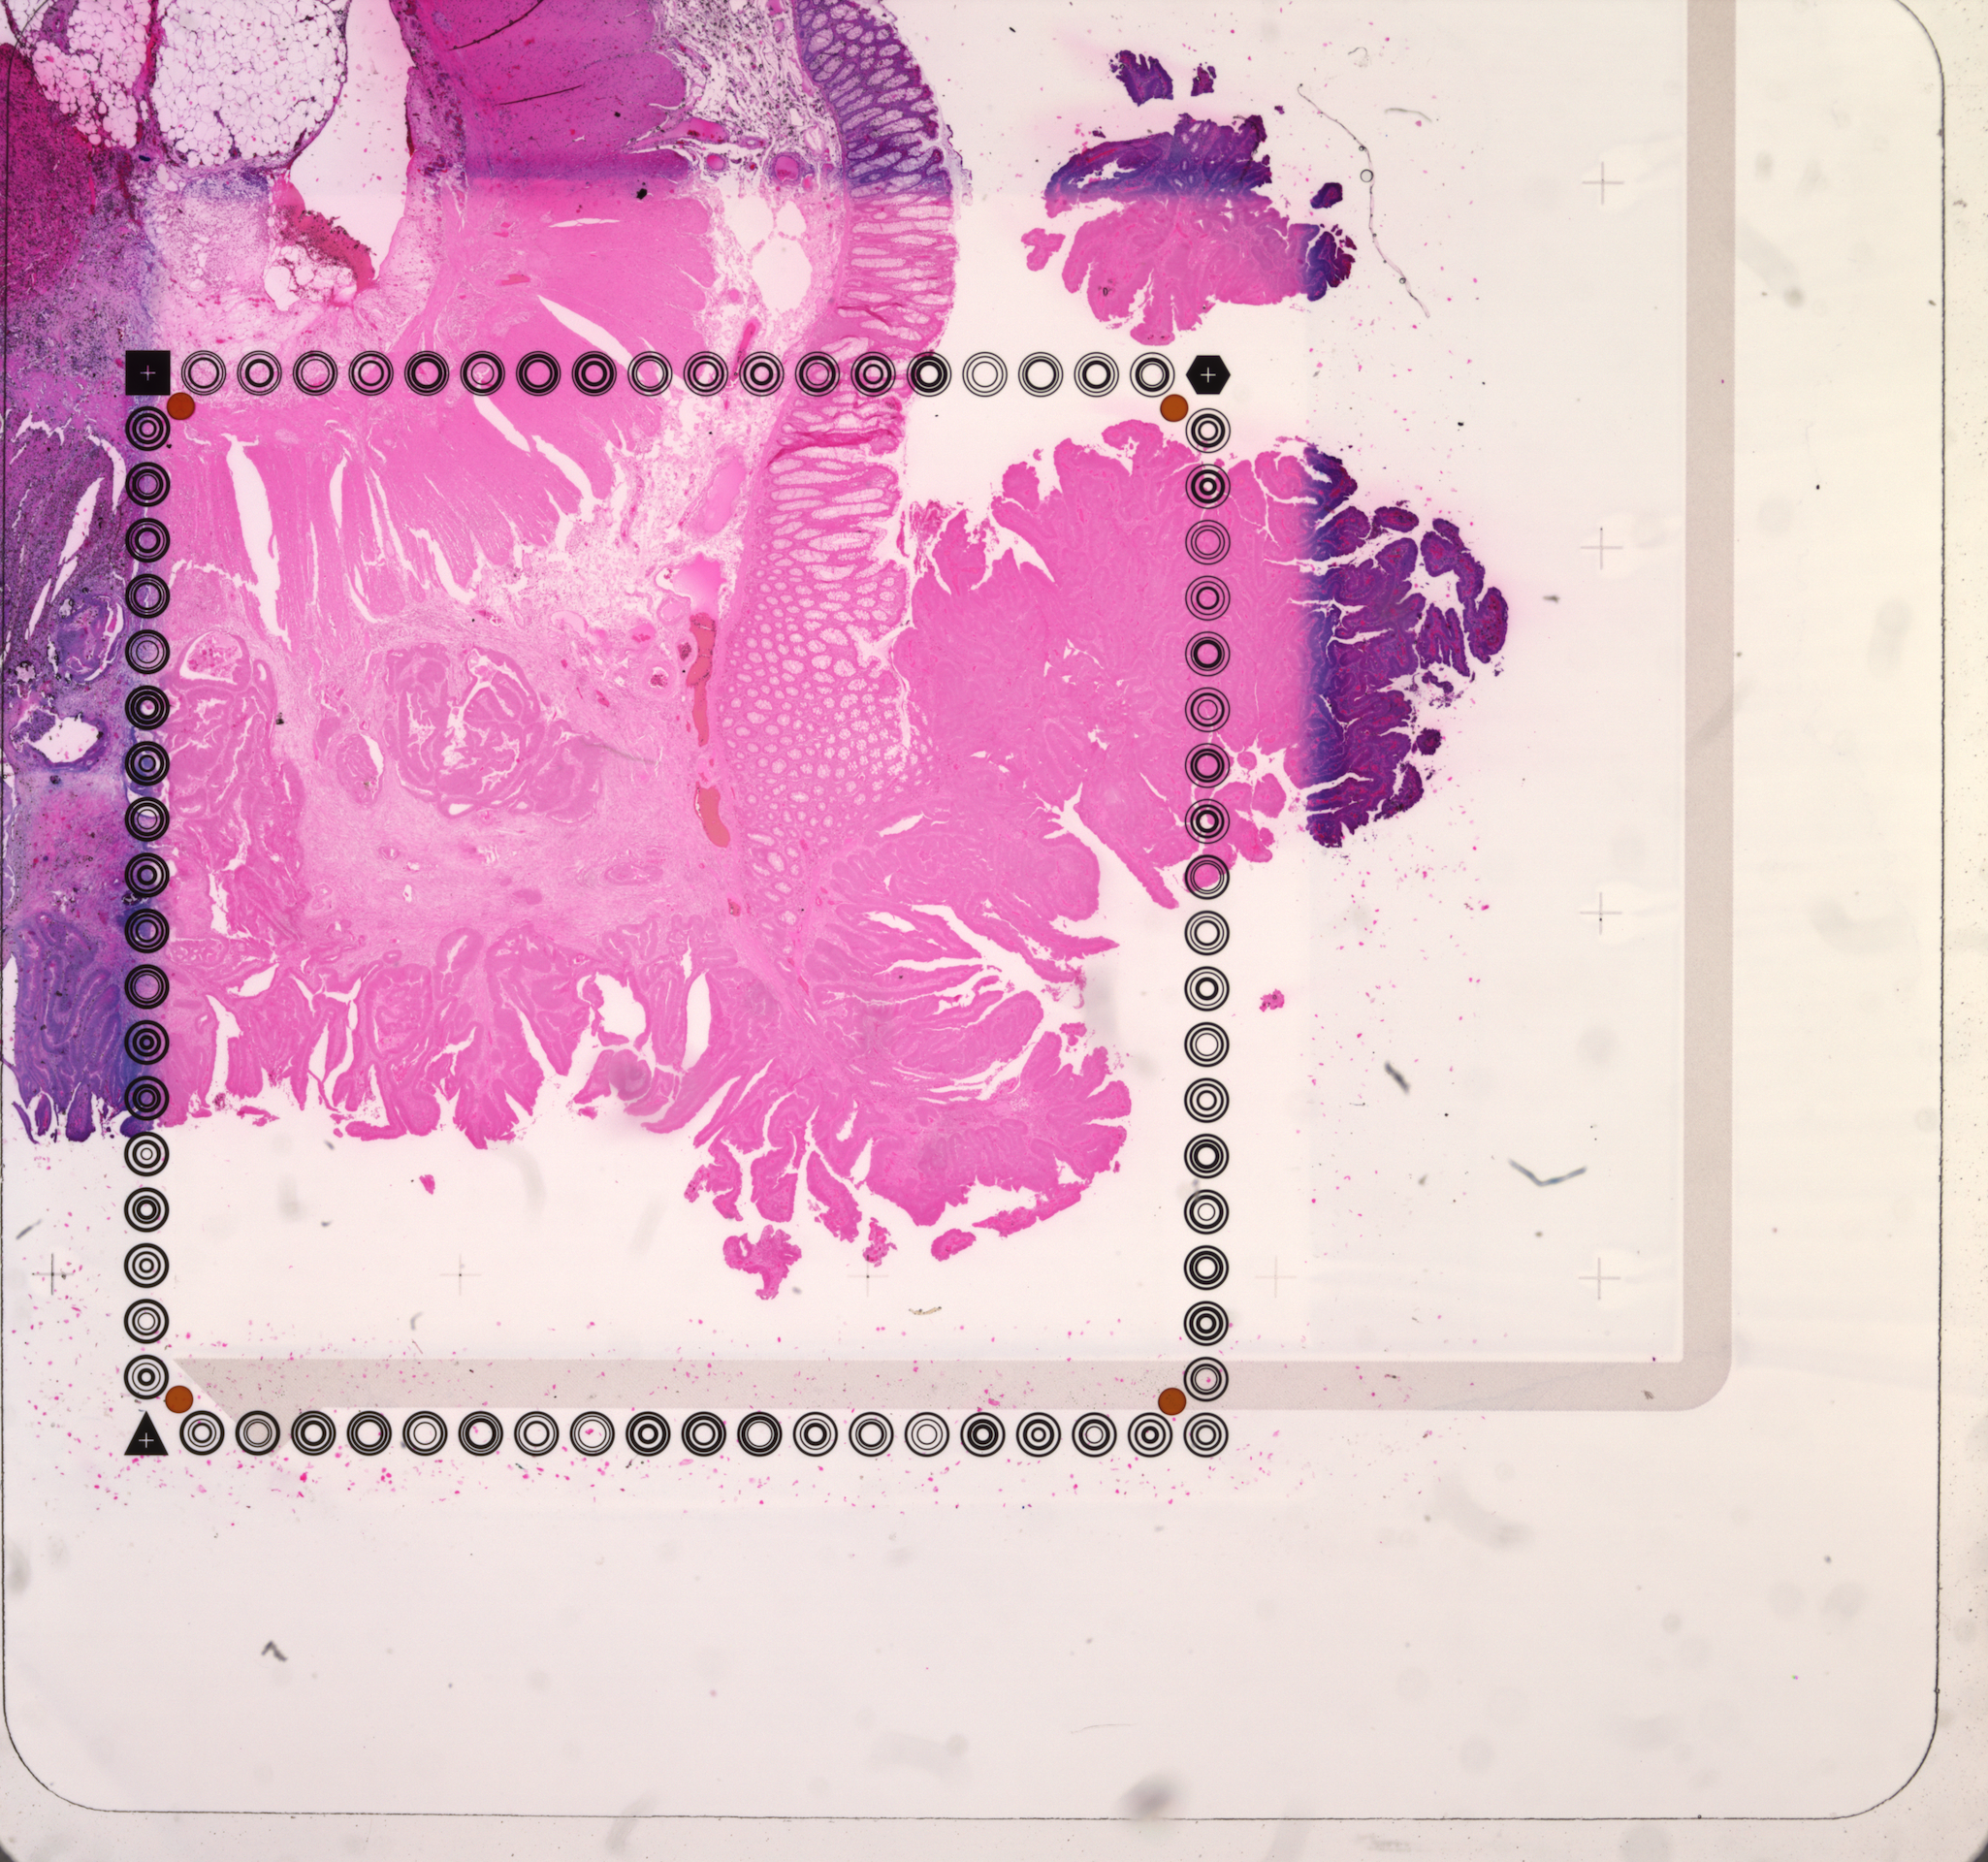
cytassist_image.tiff: Copy of the original CytAssist image input, which is a eosin-stained brightfield image in TIFF format that contains the fiducial frame. It has a resolution of 3,200 x 3,000 pixels (Visium HD) or 3,000 pixels in both dimensions (Visium v2).
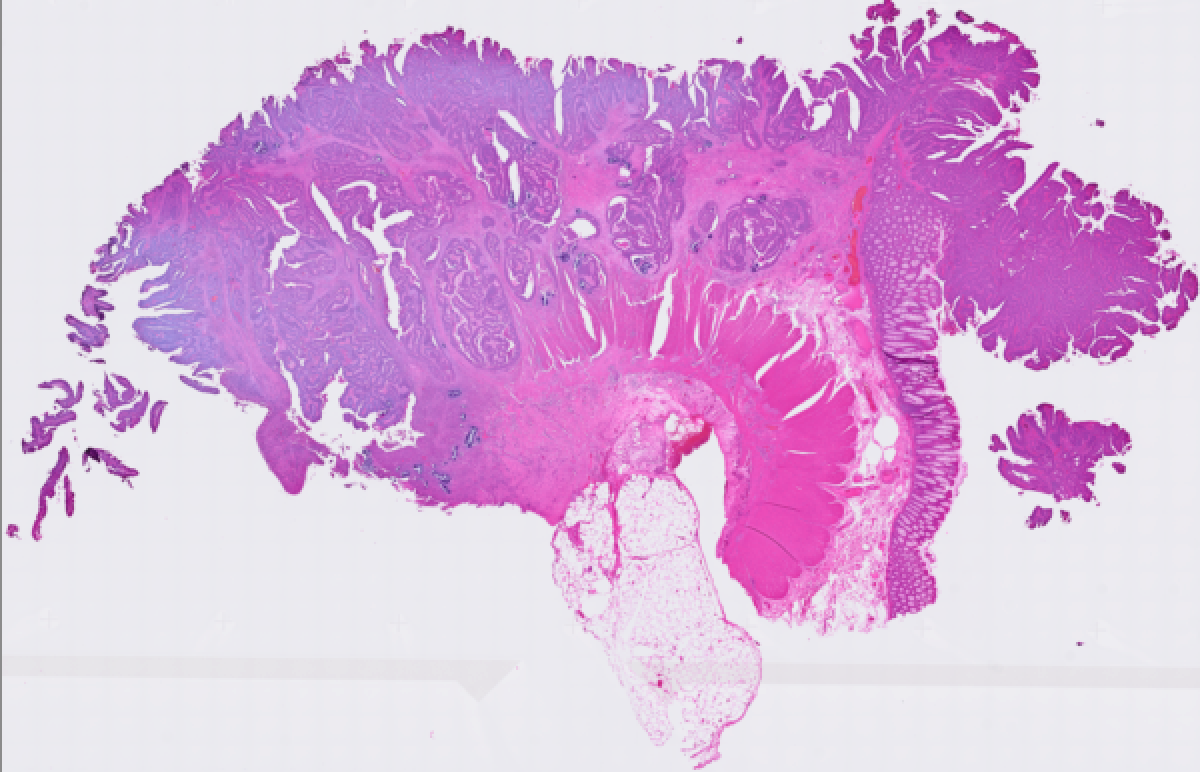
tissue_hires_image.png and tissue_lowres_image.png: These files are downsampled versions of the original, full-resolution image inputs provided by the user. Downsampling is accomplished by box filtering, which averages RGB values in patches of pixels in the full-resolution image to obtain an RGB value of one pixel in the downsampled image. The downsampled images maintain the aspect ratio of the original image. The longest dimension of tissue_hires_image.png is as follows:
| Input | Longest dimension of tissue_hires_image.png |
|---|---|
| Visium v2 slide, 6.5 mm Capture Area | 2,000 pixels |
| Visium v2 slide, 11 mm Capture Area | 4,000 pixels |
| Visium HD slide, 6.5 mm Capture Area | 6,000 pixels |
Irrespective of the slide type, the longest dimension of tissue_lowres_image.png is always 600 pixels.
aligned_fiducials.jpg: This file is useful to verify that fiducial alignment was successful. Fiducial spots detected by the fiducial alignment algorithm are highlighted in red. The aligned_fiducials.jpg contains information from the red channel since the fiducial frame is visible in it, and thus, the lack of tissue section contrast is expected.
- For Visium HD and Visium v2, the resolution is that of the CytAssist image (see above).
- For Visium v1, this image has the dimensions of
tissue_hires_image.png.
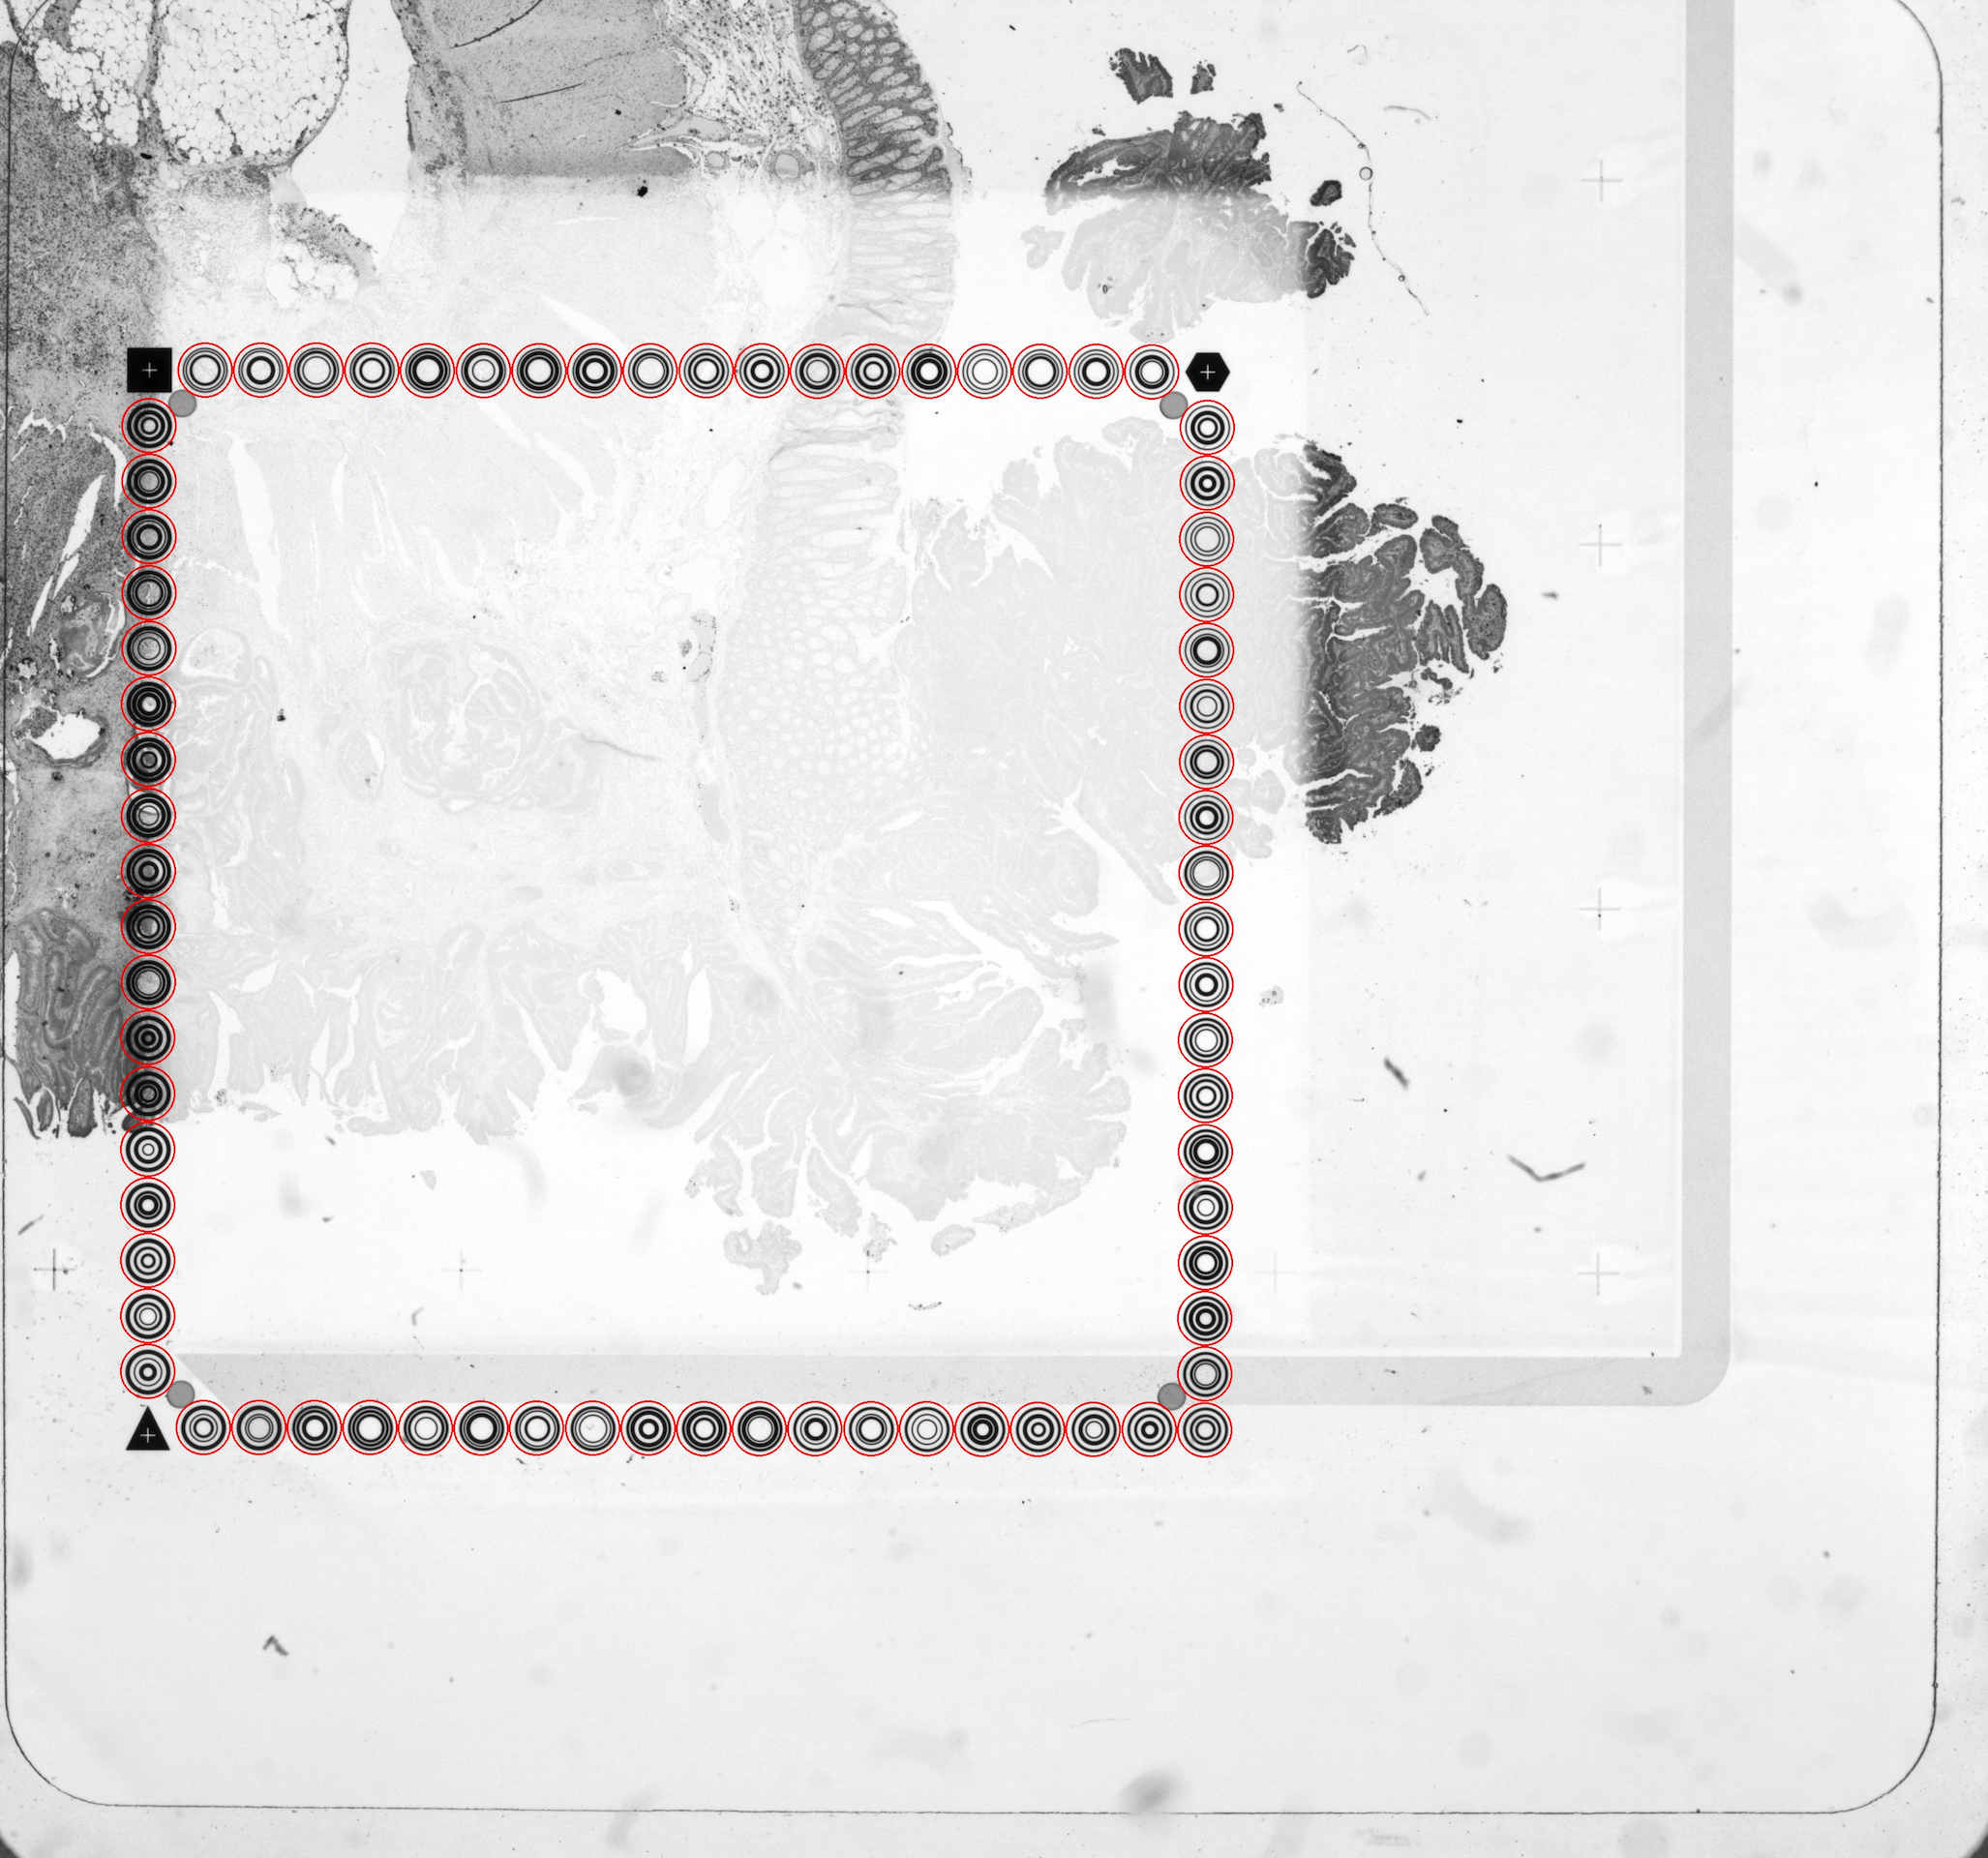
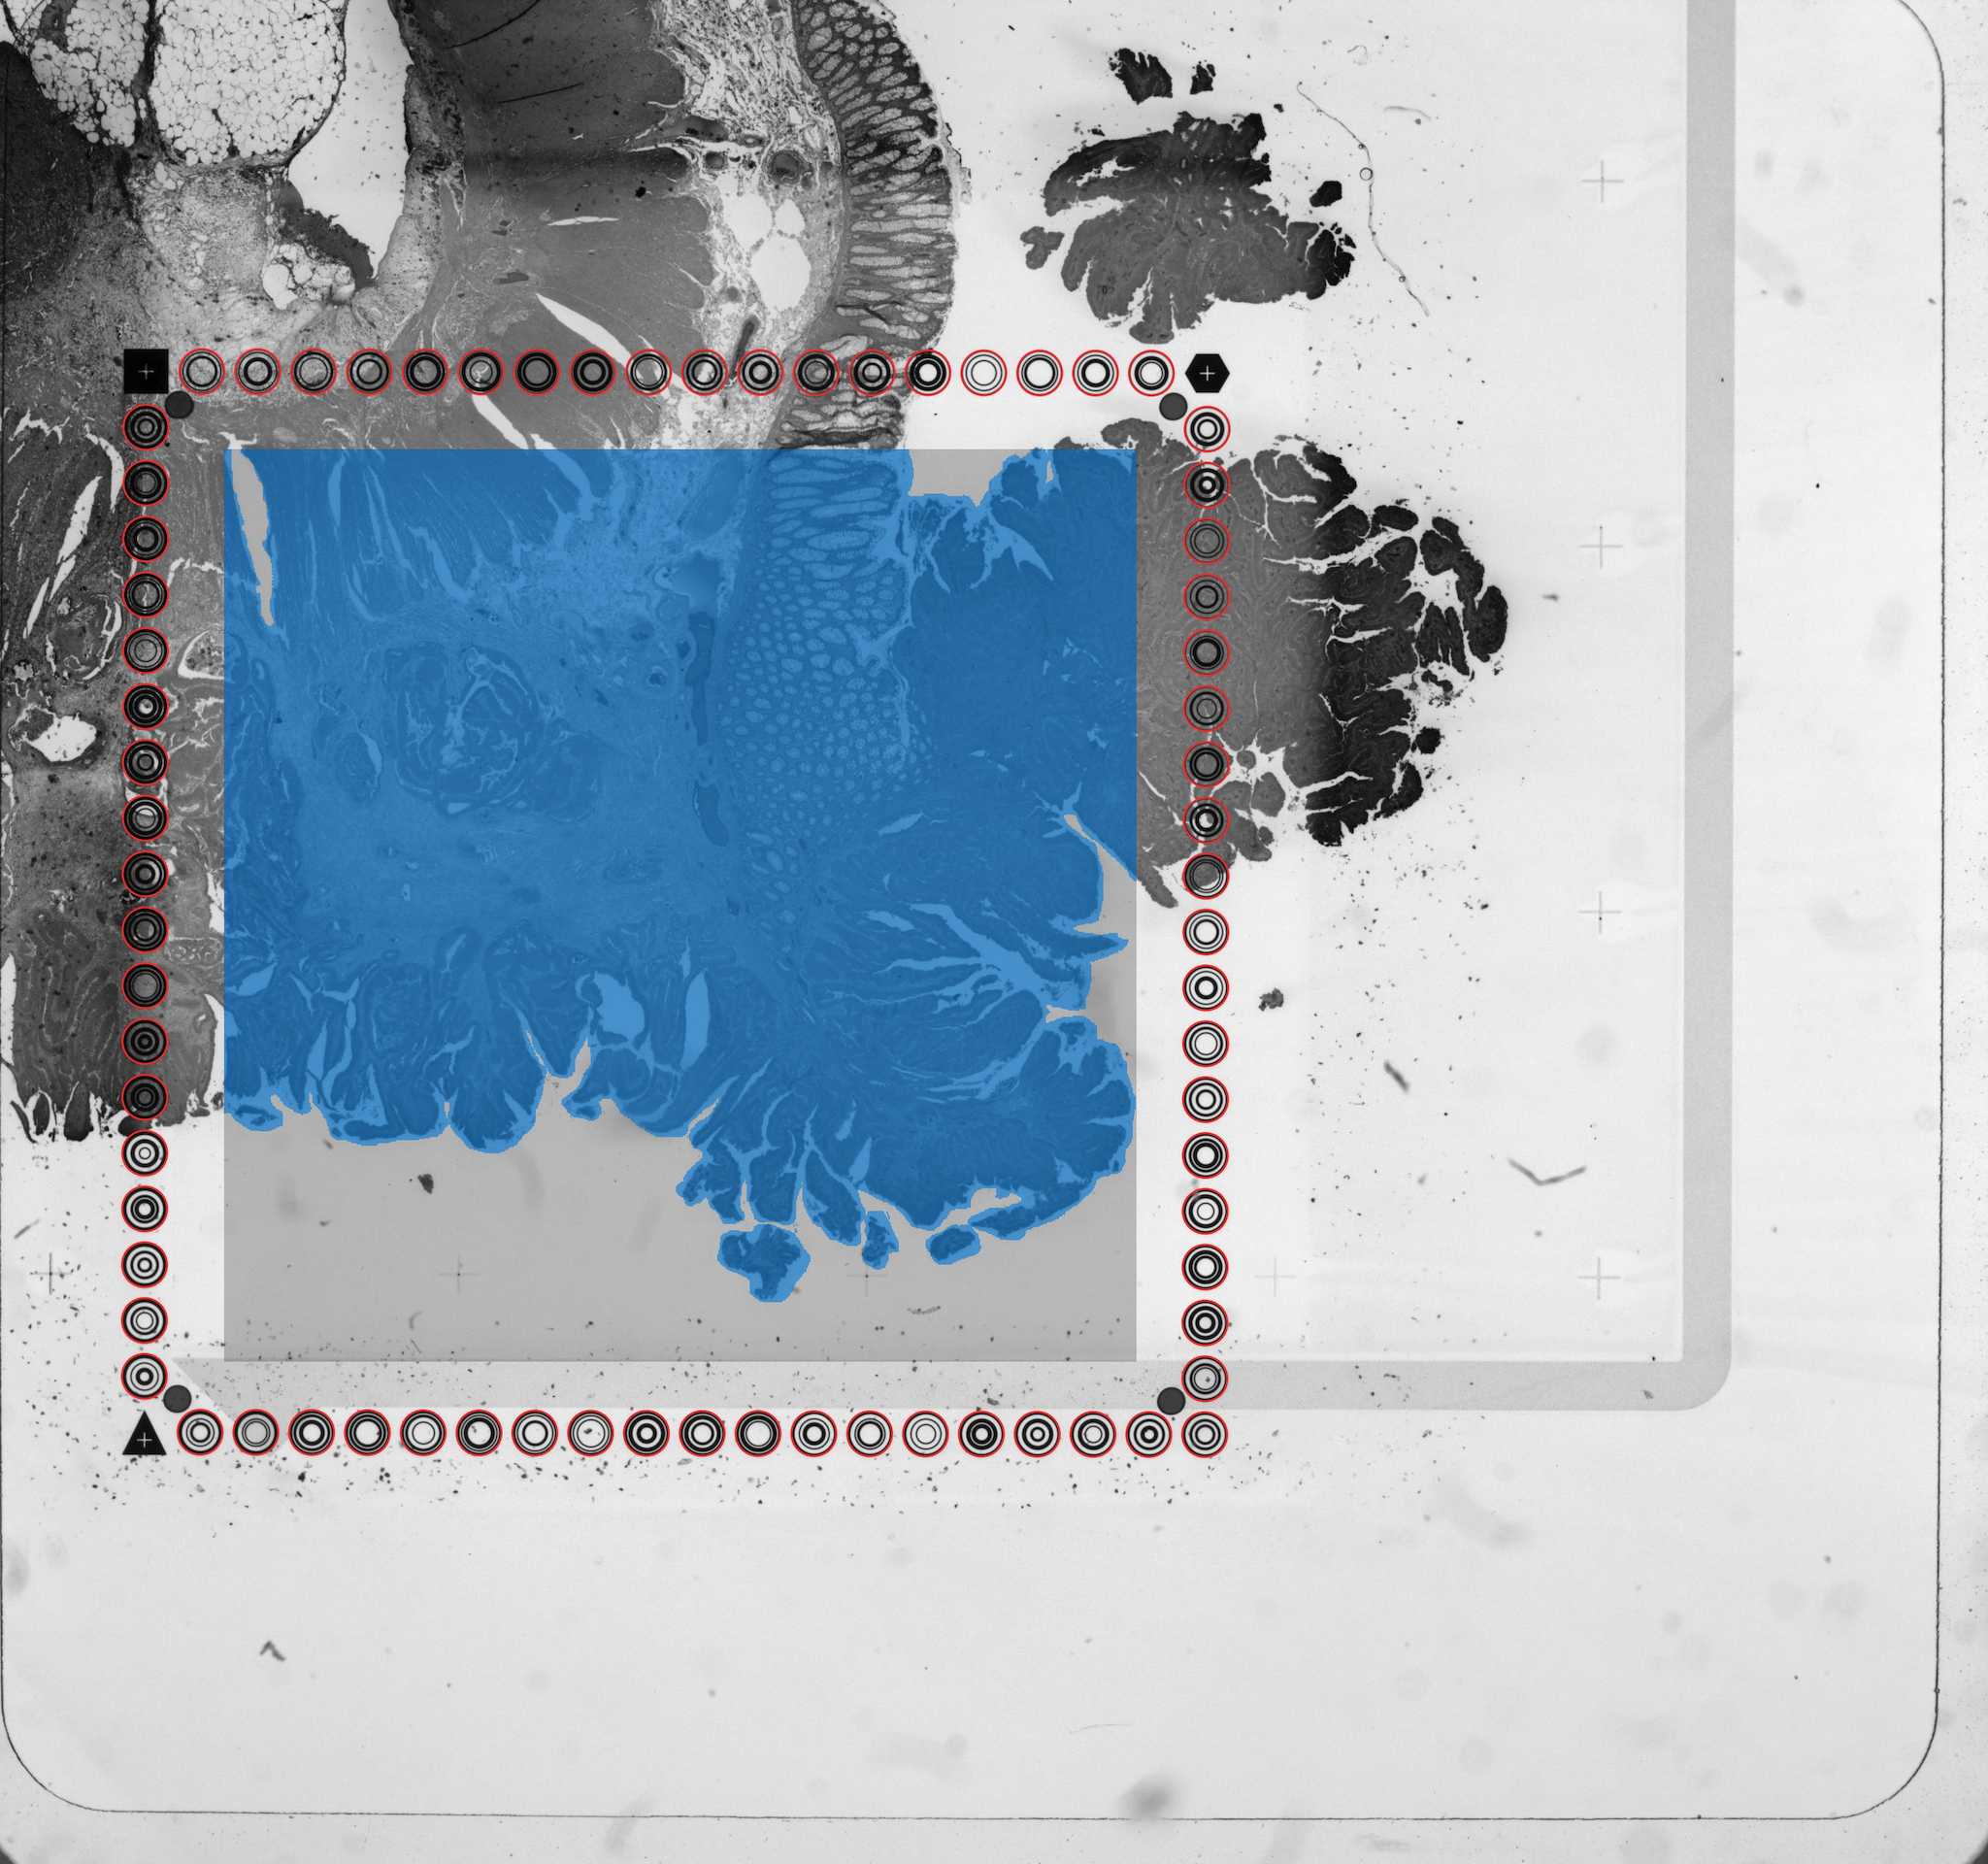
detected_tissue_image.jpg: This image either has the dimensions of the CytAssist image or of the tissue_hires_image.png, and shows the following:
- Aligned fiducial spots as hollow circles which are red (Visium HD) or blue (Visium v1/v2)
- A blue bounding box. The interior designates the portion of the image where tissue is discriminated from background.
- Spots/squares found under tissue are blue (Visium HD) or red (Visium v1/v2).
- Spots/squares outside of tissue are gray.
scalefactors_json.json: The purpose of the file is to record the relative scales of the user-supplied image, the images in the spatial outs, and the Visium array. This file may contain the following fields:
regist_target_img_scalef: A scaling factor that converts pixel positions in the original, full-resolution microscope image to the downsampled version used in image registration.tissue_hires_scalef: A scaling factor that converts pixel positions in the original, full-resolution image to pixel positions intissue_hires_image.png.tissue_lowres_scalef: A scaling factor that converts pixel positions in the original, full-resolution image to pixel positions intissue_lowres_image.png.fiducial_diameter_fullres: The number of pixels that span the diameter of a fiducial spot in the original, full-resolution image.spot_diameter_fullres: The number of pixels that span the diameter of a spot in the original, full-resolution image. This field is intended for visualization purposes, and can vary for different slide designs, ranging from 60-70 µm. Spot diameters and spot positions are estimates. It is better to use the known pixel dimensions of a calibrated microscope rather than trying to infer pixel dimensions from the spot diameter.
$ cd /home/jdoe/runs/sample345/outs/spatial
$ cat scalefactors_json.json
{"tissue_hires_scalef": 0.17011142,
"tissue_lowres_scalef": 0.051033426",
"fiducial_diameter_fullres": 144.4773339857,
"spot_diameter_fullres": 89.43834961021503}
The example scalefactors_json.json values above are derived from the adult mouse brain dataset which includes an image with dimensions of 11291 x 11757. The scalefactors are calculated as:
Since the largest dimension for the tissue_hires_image.png is 2000 pixels, the tissue hires scalefactor will be: tissue_hires_scalef = 2000/11757 ≈ 0.17
Similarly for the tissue_lowres_image.png, the largest dimension is 600 pixels and the tissue lowres scalefactor is: tissue_lowres_scalef = 600/11757 ≈ 0.05
The spot diameter and fiducial diameter are estimated fractional pixels of the spot diameter in the original image. The estimation is based on the registration solution as well as the known size of the spots and fiducial frame. Prior knowledge of the image pixel sizes is not used.
In this example, the estimated pixel size was calculated from the spot diameter for the full resolution image: microns/pixels = 65/89.44 ≈ 0.73
spot_diameter_fullres refers to the side length of the Visium HD squares (2 µm).tissue_positions.csv: This text file contains a table with rows that correspond to spots. From Space Ranger v2.0 onwards, this file, which was previously named tissue_positions_list.csv, is renamed and includes a header column. Excluding the header column, the file has 4,992 rows for Visium slides with a 6.5 mm Capture Area and 14,336 rows for Visium slides with an 11 mm Capture Area, which is the number of spots in the spatial array.
tissue_positions.parquet). The columns are the same, but the format requires third party tools (e.g. R/Python packages) to read. There are 11,222,500 rows in the 2 um version of the file for Visium HD.Columns correspond to the following fields:
barcode: The sequence of the barcode associated to the spot.in_tissue: Binary, indicating if the spot falls inside (1) or outside (0) of tissue.array_row: For Visium slide (6.5 mm Capture Area), the row coordinate of the spot in the array from 0 to 77. The array has 78 rows. For Visium slides (11 mm Capture Area), the row coordinate of the spot range from 0 to 127 as the array has 128 rows.array_col: The column coordinate of the spot in the array. In order to express the orange crate arrangement of the spots, for Visium slides (6.5 mm Capture Area) this column index uses even numbers from 0 to 126 for even rows, and odd numbers from 1 to 127 for odd rows with each row (even or odd) resulting in 64 spots. For Visium slides (11 mm Capture Area) this column index uses even numbers from 0 to 222 for even rows, and odd numbers from 1 to 223 for odd rows with each row (even or odd) resulting in 111 spots.pxl_row_in_fullres: The row pixel coordinate of the center of the spot in the full resolution image. This is theycoordinate in pixel space.pxl_col_in_fullres: The column pixel coordinate of the center of the spot in the full resolution image. This is thexcoordinate in pixel space.pxl_row_in_fullresandpxl_col_in_fullrescan be multiplied by the scale factors inscalefactors_json.jsonto get pixel coordinates in the lower resolution images.
$ cd /home/jdoe/runs/sample345/outs/spatial
$ column -s, -t < tissue_positions.csv | head -n 10
barcode in_tissue array_row array_col pxl_row_in_fullres pxl_col_in_fullres
GTCACTTCCTTCTAGA-1 0 0 0 1832 11971
CACGGTCTCCTTACGA-1 0 0 2 1832 11833
ATAGCTGCGGATAAGA-1 0 0 4 1832 11695
GTCAGTATGTCCGGCG-1 0 0 6 1832 11556
ATGTACCAGTTACTCG-1 0 0 8 1831 11418
ACGCTCAGTGCACCGT-1 0 0 10 1831 11280
TCACTAACGTATAGTT-1 0 0 12 1831 11142
CGGTTAGGCCTGGACG-1 0 0 14 1831 11004
GATATCACCAGCATGG-1 0 0 16 1831 10866
The tissue_positions.csv contains the same information about the barcode inclusion list and their slide coordinates as contained in the barcodes folder that comes bundled with Space Ranger (spaceranger-x.y.z/lib/python/cellranger/barcodes where x.y.z represent the version number).
spatial_enrichment.csv: File in CSV format that contains table of Moran's I values for each feature when specific conditions are met:
- The tissue must cover at least 37 spots
- The feature must be detected in at least 10 spots
- The feature must have a total UMI count of at least 20
The Moran's I value can be anywhere between -1 (perfectly dispersed) to 1 (perfectly enriched) but in biological samples values significantly below 0 are unexpected. A p-value is provided, as well as an adjusted p-value which is corrected using the Benjamini-Hochberg method for multiple comparisons.
From Space Ranger 2.0 onwards, the spatial_enrichment.csv file includes a Feature Type column the value for which is Gene Expression for single-library analysis.
$ cd /home/jdoe/runs/sample345/outs/spatial
$ column -s, -t < spatial_enrichment.csv | less -#2 -S
Feature ID Feature Name Feature Type I P value Adjusted p value Feature Counts in Spots Under Tissue Median Normalized Average Counts Barcodes Detected per Feature
ENSMUSG00000053310 Nrgn Gene Expression 0.849230495400066 0.0 0.0 140702 42.22927672729207 2645
ENSMUSG00000070570 Slc17a7 Gene Expression 0.8228828454463434 0.0 0.0 49919 15.927820652112793 2435
ENSMUSG00000046447 Camk2n1 Gene Expression 0.8112121614961633 0.0 0.0 126518 44.058800706638436 2698
ENSMUSG00000021948 Prkcd Gene Expression 0.8093848987347875 0.0 0.0 11675 4.552770117948635 1430
ENSMUSG00000061808 Ttr Gene Expression 0.8088005899881938 0.0 0.0 348686 76.73215387483816 2674
ENSMUSG00000041607 Mbp Gene Expression 0.7965984861055619 0.0 0.0 258769 112.84701279639039 2700
ENSMUSG00000035383 Pmch Gene Expression 0.7847484395395488 0.0 0.0 67814 17.005396313242215 1718
ENSMUSG00000024985 Tcf7l2 Gene Expression 0.7769492292430982 0.0 0.0 6546 2.564212465278306 1282
ENSMUSG00000032532 Cck Gene Expression 0.7605729556575779 0.0 0.0 67935 21.68537496001758 2585
For multi-library runs containing both Gene and Protein Expression, changes to this file include the addition of Antibody IDs in the Feature ID column as well as inclusion of both Gene Expression and Antibody Capture values for Feature Type column. If the secondary_name column, which is optional, was included in the feature_reference.csv file, then an additional column Feature Secondary Name is included.
# Gene Expression + Protein Expression output
$ cd /home/jdoe/runs/sample345/outs/spatial
$ column -s, -t < spatial_enrichment.csv | less -#2 -S
Feature ID Feature Name Feature Type I P value Adjusted p value Feature Counts in Spots Under Tissue Median Normalized Average Counts Barcodes Detected per Feature Feature Secondary Name
HLA-DRA HLA-DRA Antibody Capture 0.620710365248628 0.0 0.0 624501 131.46681016369922 2963 HLA-DR
ENSG00000198938 MT-CO3 Gene Expression 0.5909662325215399 0.0 0.0 176905 36.85280442442849 2963
ACTA2 ACTA2 Antibody Capture 0.5829500680472921 0.0 0.0 110008 24.04130766646586 2926 alphaSMA
ENSG00000090382 LYZ Gene Expression 0.5731596519494577 0.0 0.0 35321 6.963638949483311 2707
CD8A CD8A Antibody Capture 0.5471755733893784 0.0 0.0 284717 63.2355130893458 2963 CD8A
CD3E CD3E Antibody Capture 0.5470800097794422 0.0 0.0 483642 100.9584586030563 2963 CD3E
ENSG00000168542 COL3A1 Gene Expression 0.5441240624975852 0.0 0.0 30832 7.117037655819745 2710
PDL1 PDL1 Antibody Capture 0.5423563651411019 0.0 0.0 203369 35.819183769219975 2956 CD274
ENSG00000205542 TMSB4X Gene Expression 0.5399878890015211 0.0 0.0 95380 19.488702934223657 2939
CD68 CD68 Antibody Capture 0.5293575665804824 0.0 0.0 135790 26.888763776634708 2950 CD68
ENSG00000198763 MT-ND2 Gene Expression 0.5201078732259159 0.0 0.0 124913 25.089922503703956 2951
barcode_fluorescence_intensity.csv: File in CSV format that is generated for any input image specified by --darkimage. This file contains the statistics about the fluorescence intensity which is calculated for every spot and every fluorescence channel in the input image. If the channels were given custom names in the Loupe manual alignment session that produced the alignment JSON file, then the CSV header will use the given channel names. By default, channels are named channel1, channel2, etc. This file can be used for secondary analysis in R/Python and can also be combined with the tissue_positions.csv file. If the microscope image is smaller than the CytAssist image, and spots are detected outside of the microscope image, intensities will be reported as NA. If single-page TIFF images are provided in the command line as a comma separated list, only one intensity is reported.
$ cd /home/jdoe/runs/sample345/outs/spatial
$ column -s, -t < barcode_fluorescence_intensity.csv | less -#2 -S
barcode in_tissue channel1_mean channel1_stdev channel2_mean channel2_stdev
CGAGGATATTCAGAGC-1 0 4254.328631875882 59.72596599289198 2370.7574047954868 23.587614594004506
TCTGGTACTAATGCGG-1 0 4242.12976022567 61.31391702047626 2348.9830747531737 22.960436841214605
AGGTGACCATGACGCT-1 0 4237.420310296192 62.954555749425516 2330.277856135402 18.66240280182469
CAGAGGTGTACGTAGC-1 0 4219.421720733428 60.38810661890725 2323.2045133991537 20.876943016829802
TAGCTAGAAGATACAT-1 0 4202.056417489422 62.2343918192054 2309.320169252468 18.883665883691563
AGCACTGACCGGCTTA-1 0 4185.466854724965 61.848950071485 2300.589562764457 17.98861741514344
ATAACCTAAGGCGTCA-1 0 4149.37658674189 58.4482514520289 2292.1255289139635 19.824612785901802
TAGAACCTCAGTTAGA-1 0 4156.802538787024 64.86614573399514 2298.7390691114247 19.838300058320733
CCGACATAAGTATCAA-1 0 4194.483779971792 62.19636612986138 2313.277856135402 20.56714424032058
GACTACCAACTGGTCC-1 0 4204.746121297602 62.91221526144468 2328.5232722143865 54.82377031240396