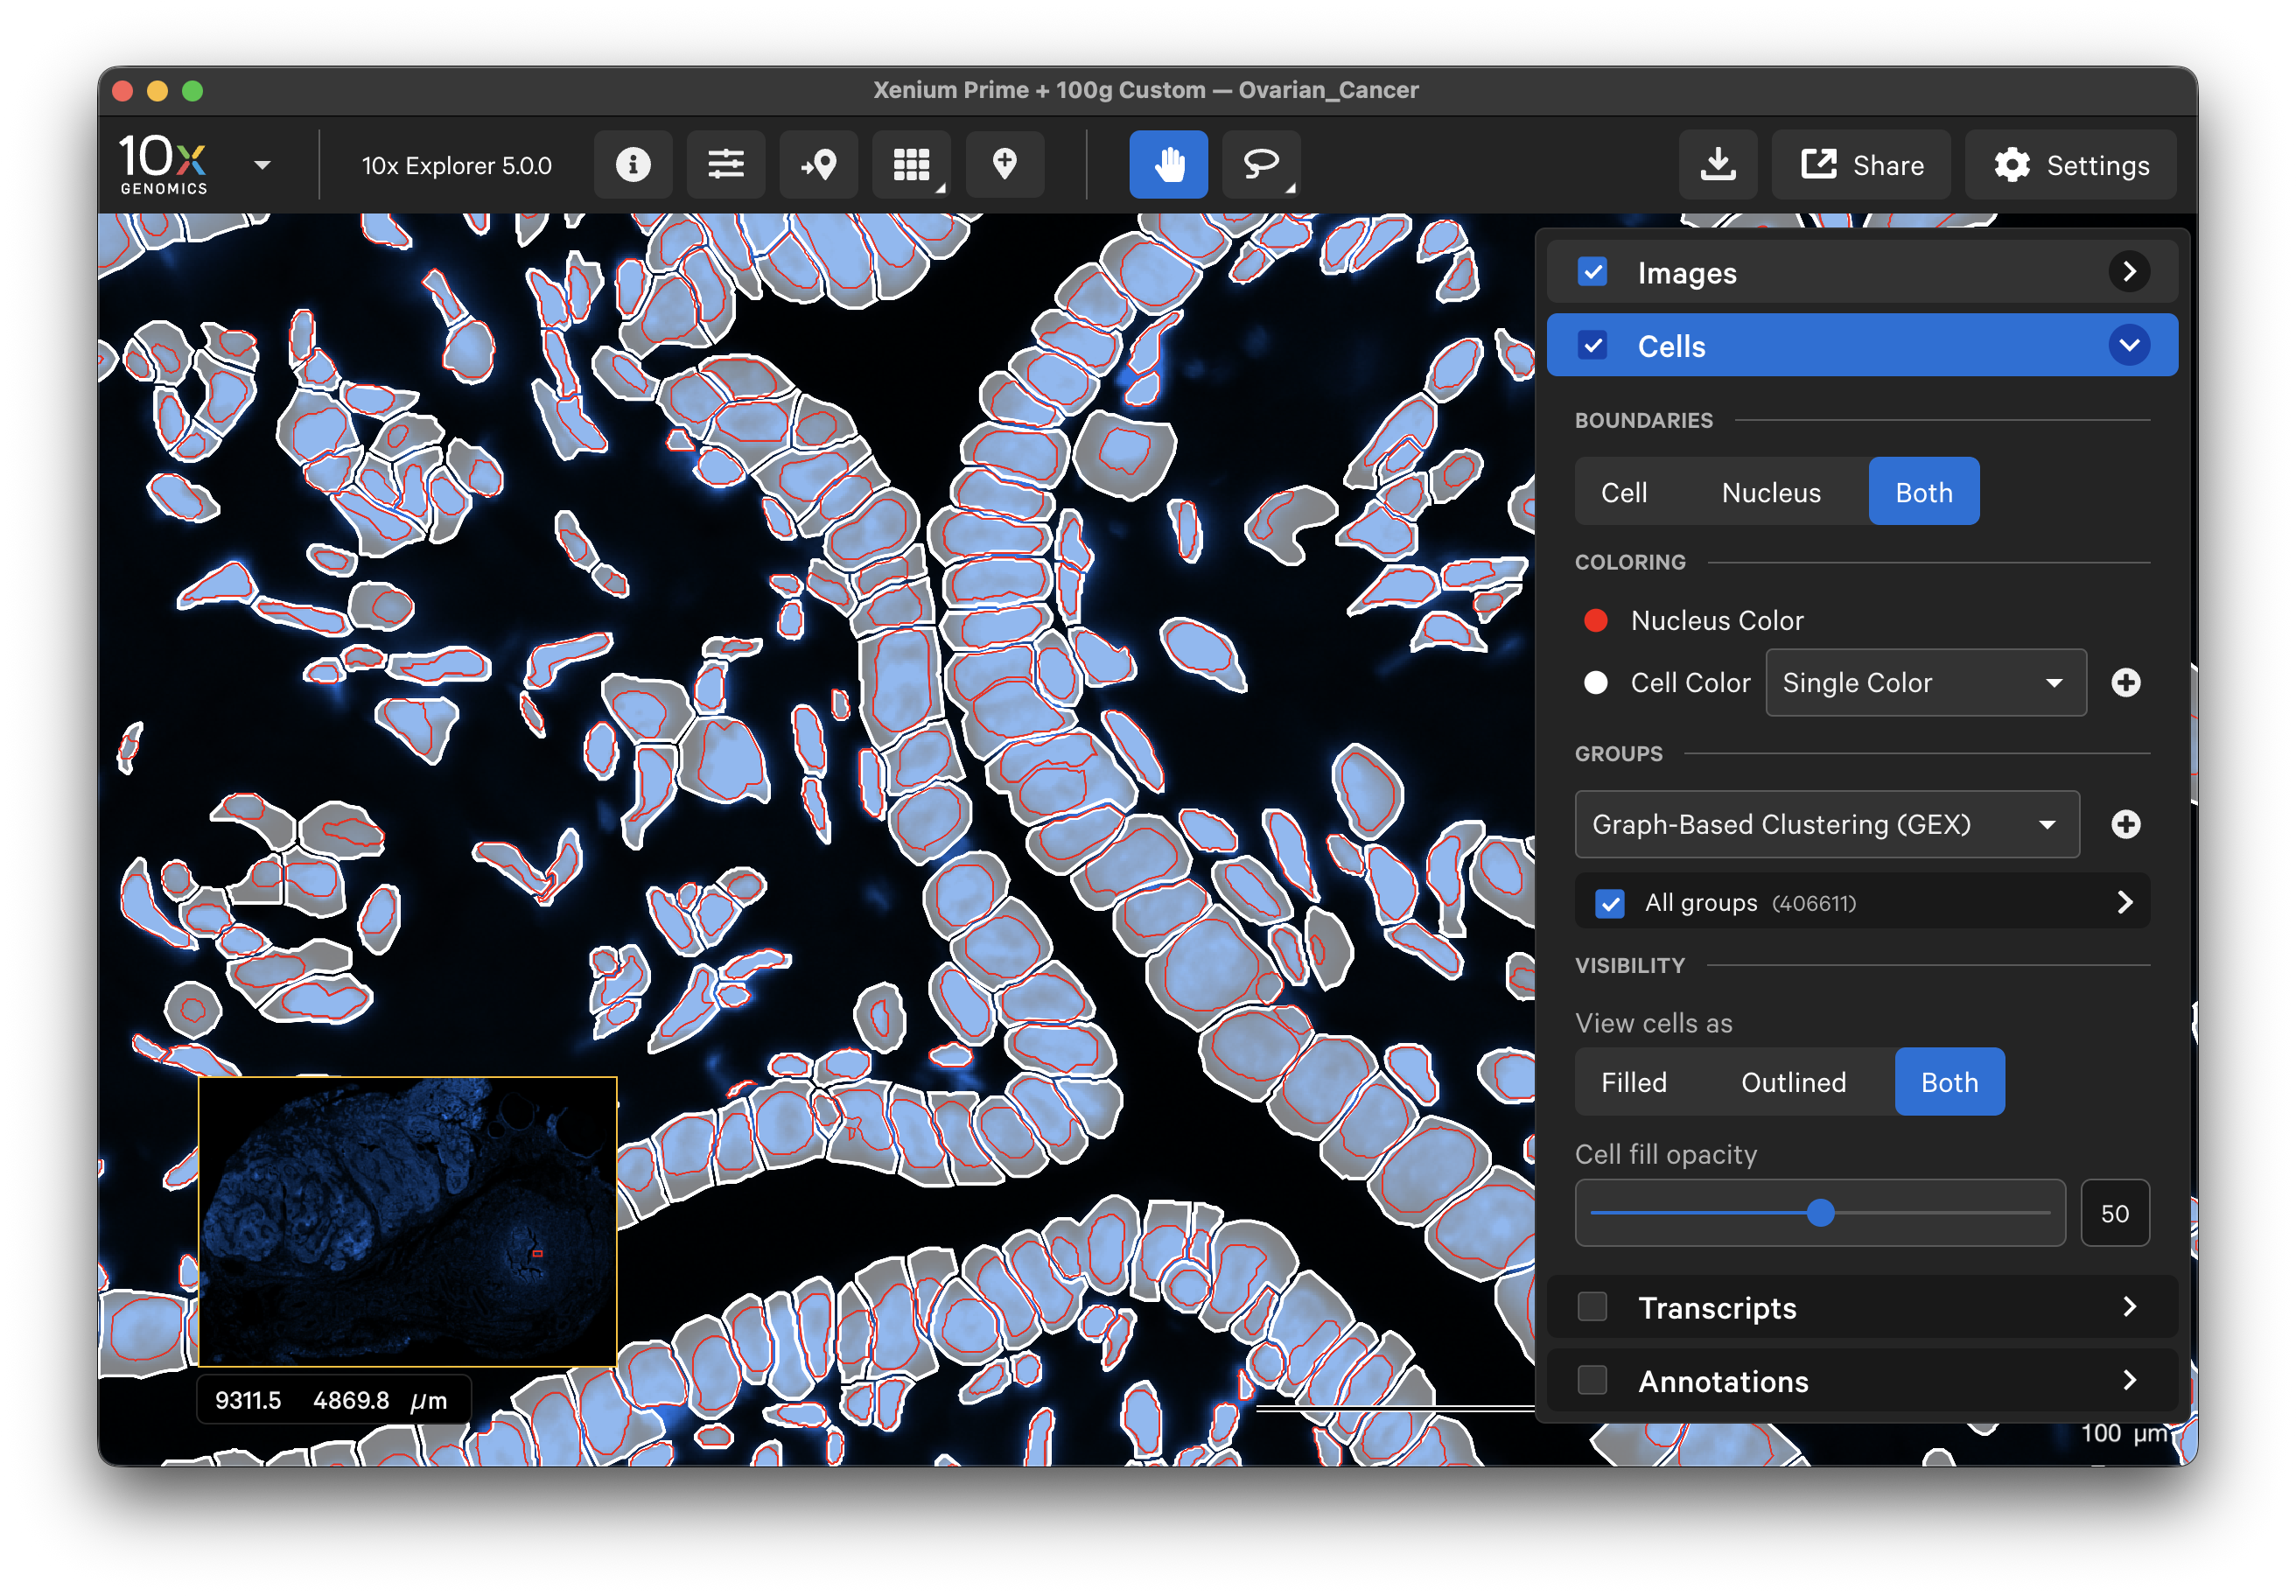
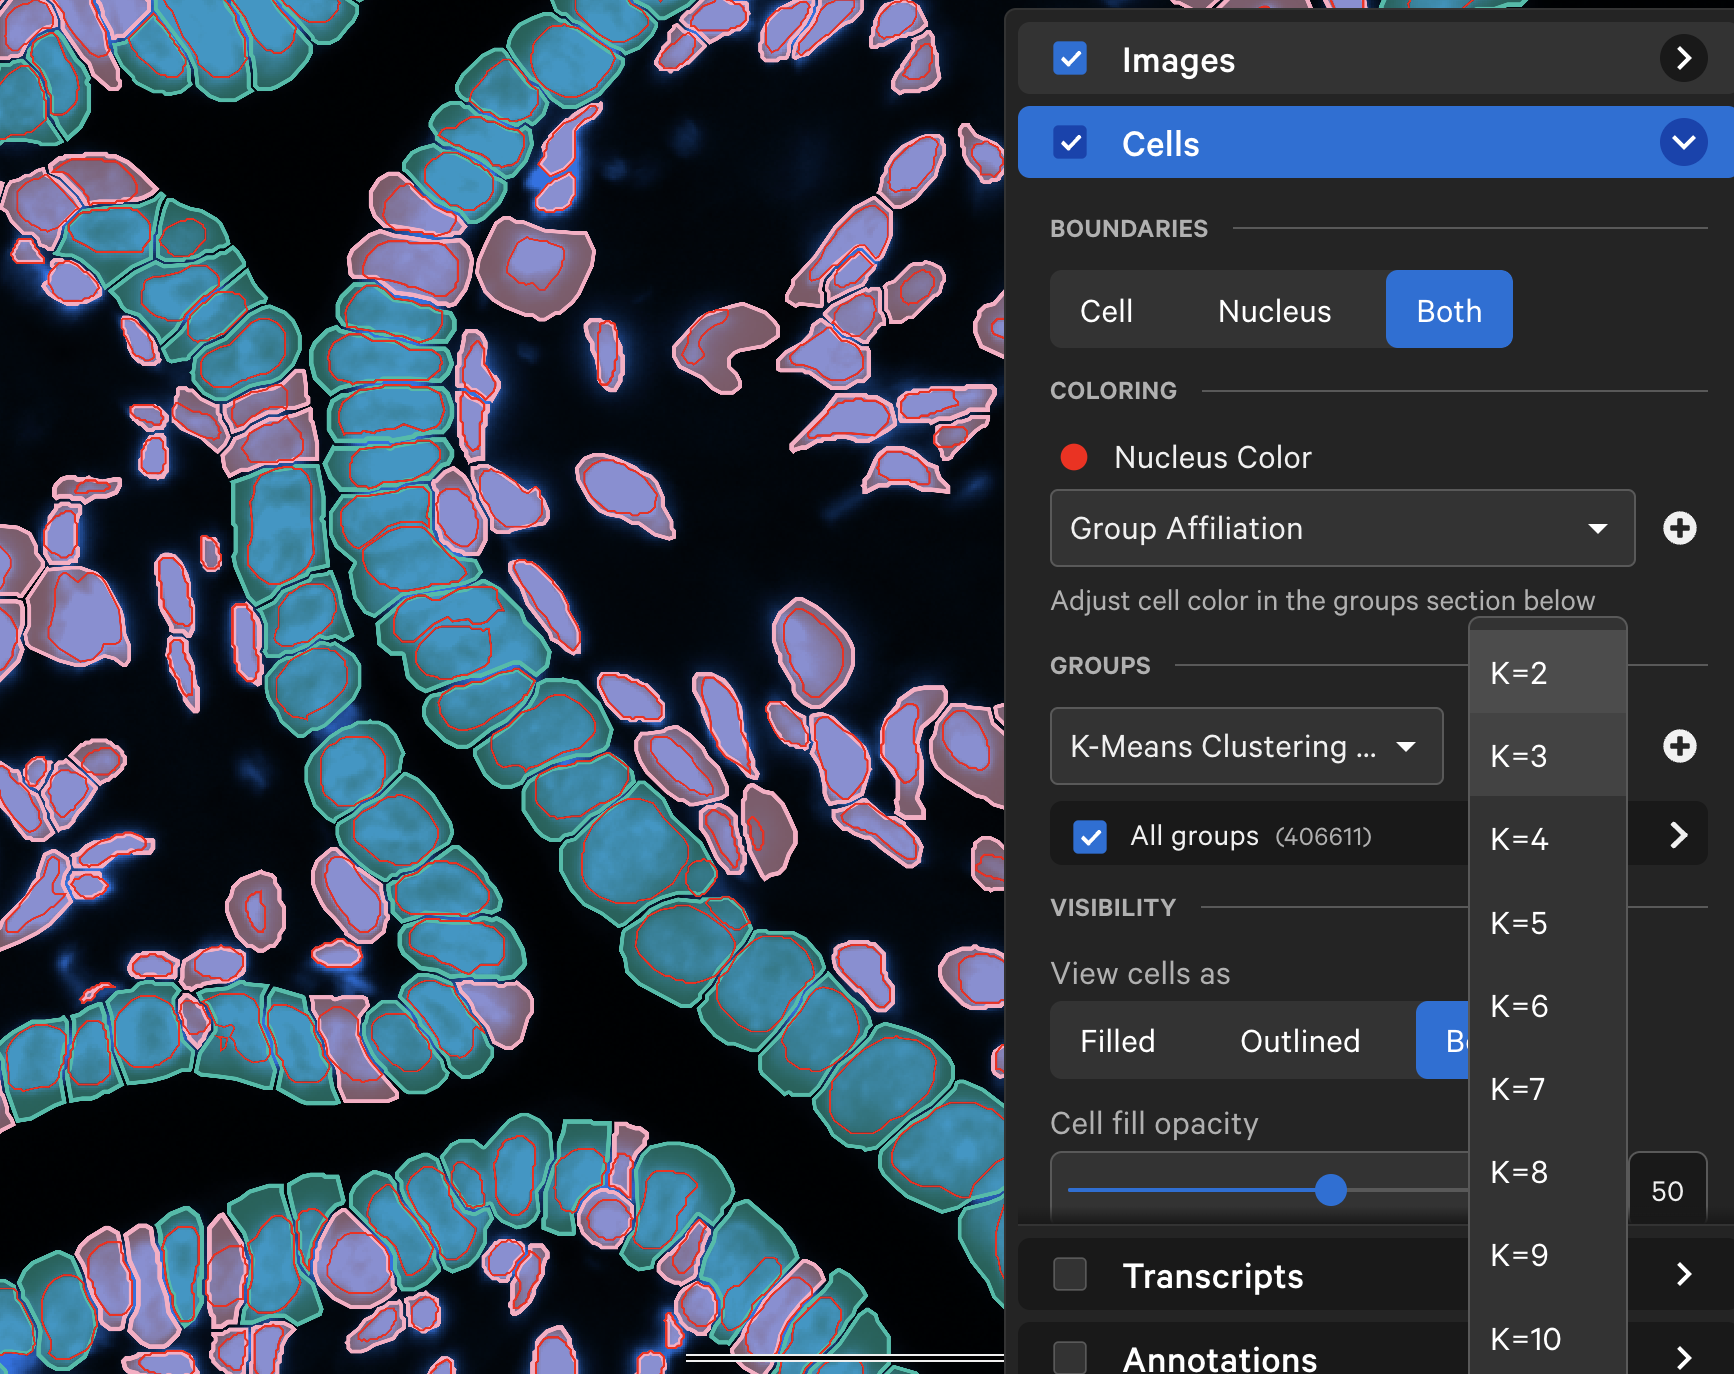
Set the Boundaries button to view outlines for cells, nuclei, or both. Set the View cell as button to view the cell boundaries as filled, outlined, or both. These features are useful for checking cell segmentation quality (see Checking Data Quality tutorial).
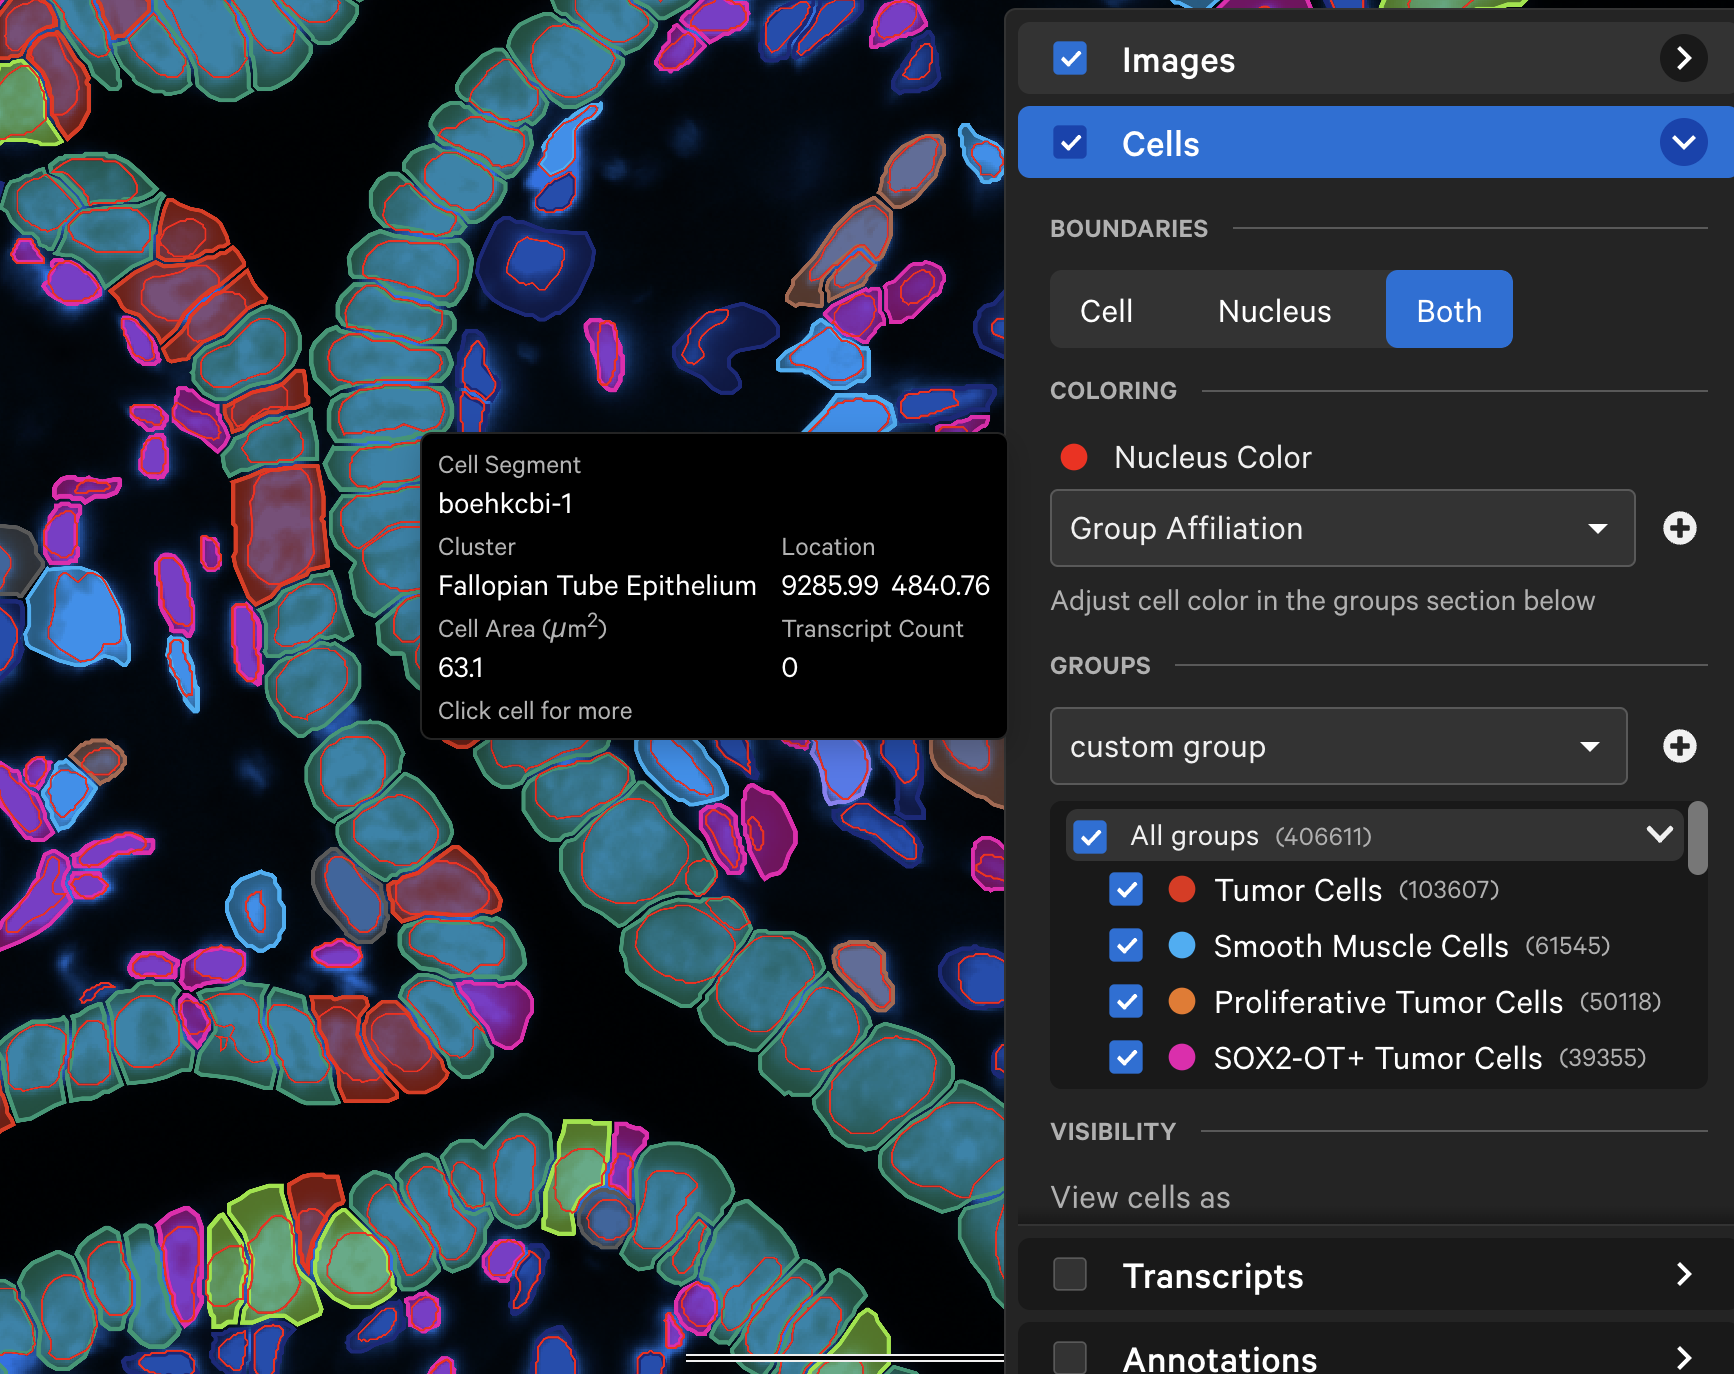
When tooltips are shown (Settings > Show Tooltips), you will see cluster, location, area, and transcript counts for individual cells as you move the cursor over each cell.
Click the link below to learn how to explore, select, and export cell statistics.
Default or custom cell colors (fill and outline) can be displayed by:
- Secondary analysis cluster group affiliation (graph-based, K-means, cell type annotation, custom)
- Transcript density map
- Single color
- Cell segmentation method (for multimodal segmentation outputs only)
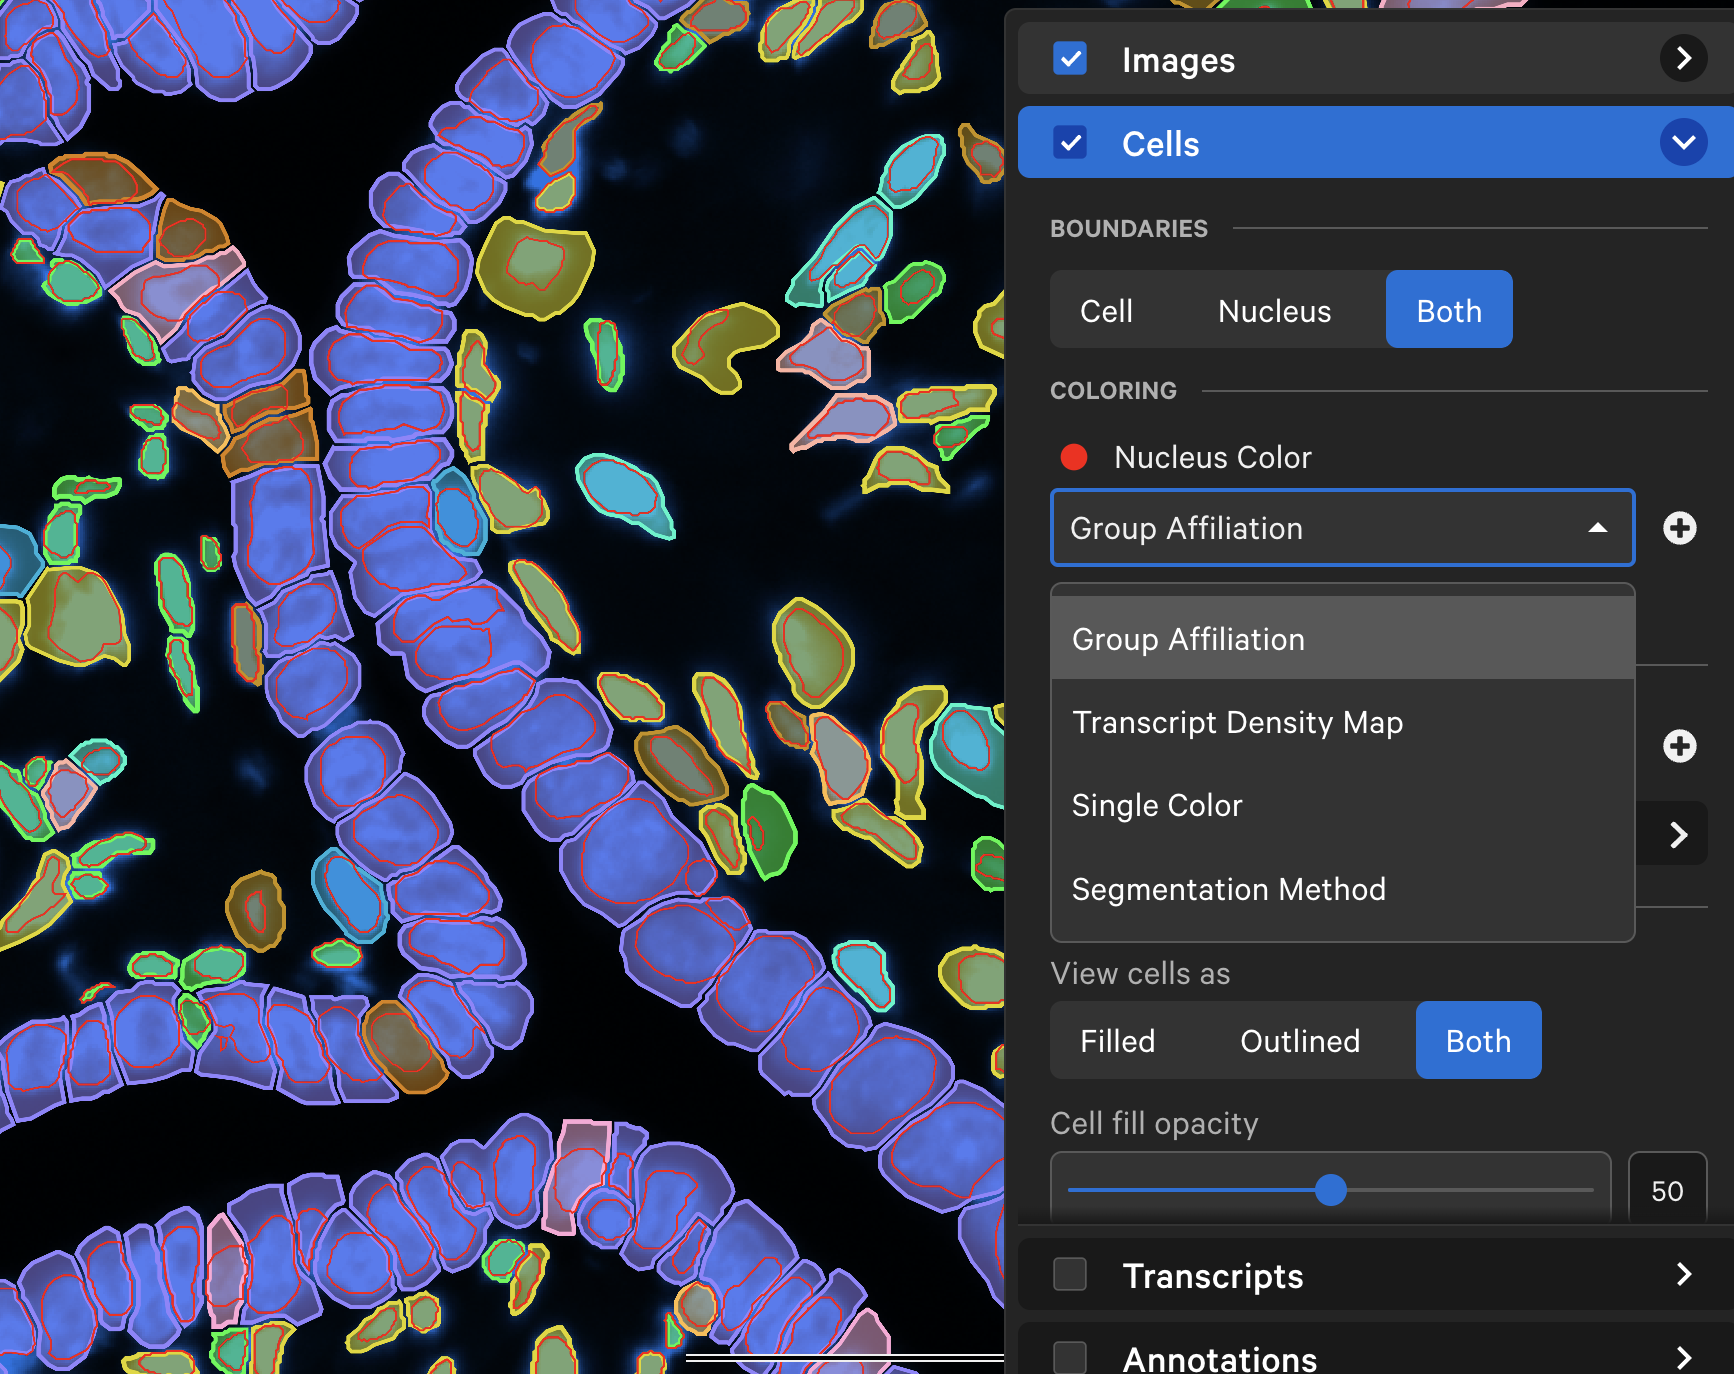
The Cells layer shows cells colored by pre-computed or custom cluster groups. The pre-computed clusters are generated by the Onboard Analysis pipelines (Xenium: analysis.zarr.zip, Atera: cell_feature_matrix.zarr.zip).
This feature is useful for assessing whether cell clusters align with known cell types or regions of interest in the sample (see Checking Data Quality tutorial).
For Xenium datasets, view K-means clusters by selecting "K-Means Clustering" in the Groups dropdown menu and then select a value in the K=2-10 dropdown menu.
For Atera human WTA datasets, view automated cell type groups by selecting a Pan-human Azimuth annotation result from the dropdown menu. Cell type annotations are provided at several levels of granularity (broad, coarse, fine; full).
The cluster name and color can be edited by clicking the three vertical dots next to each cluster label. You can reset the original cluster color or name by selecting the Edit Color or Edit Name and Reset to default. The clusters can be renamed based on cell type annotation using marker genes.
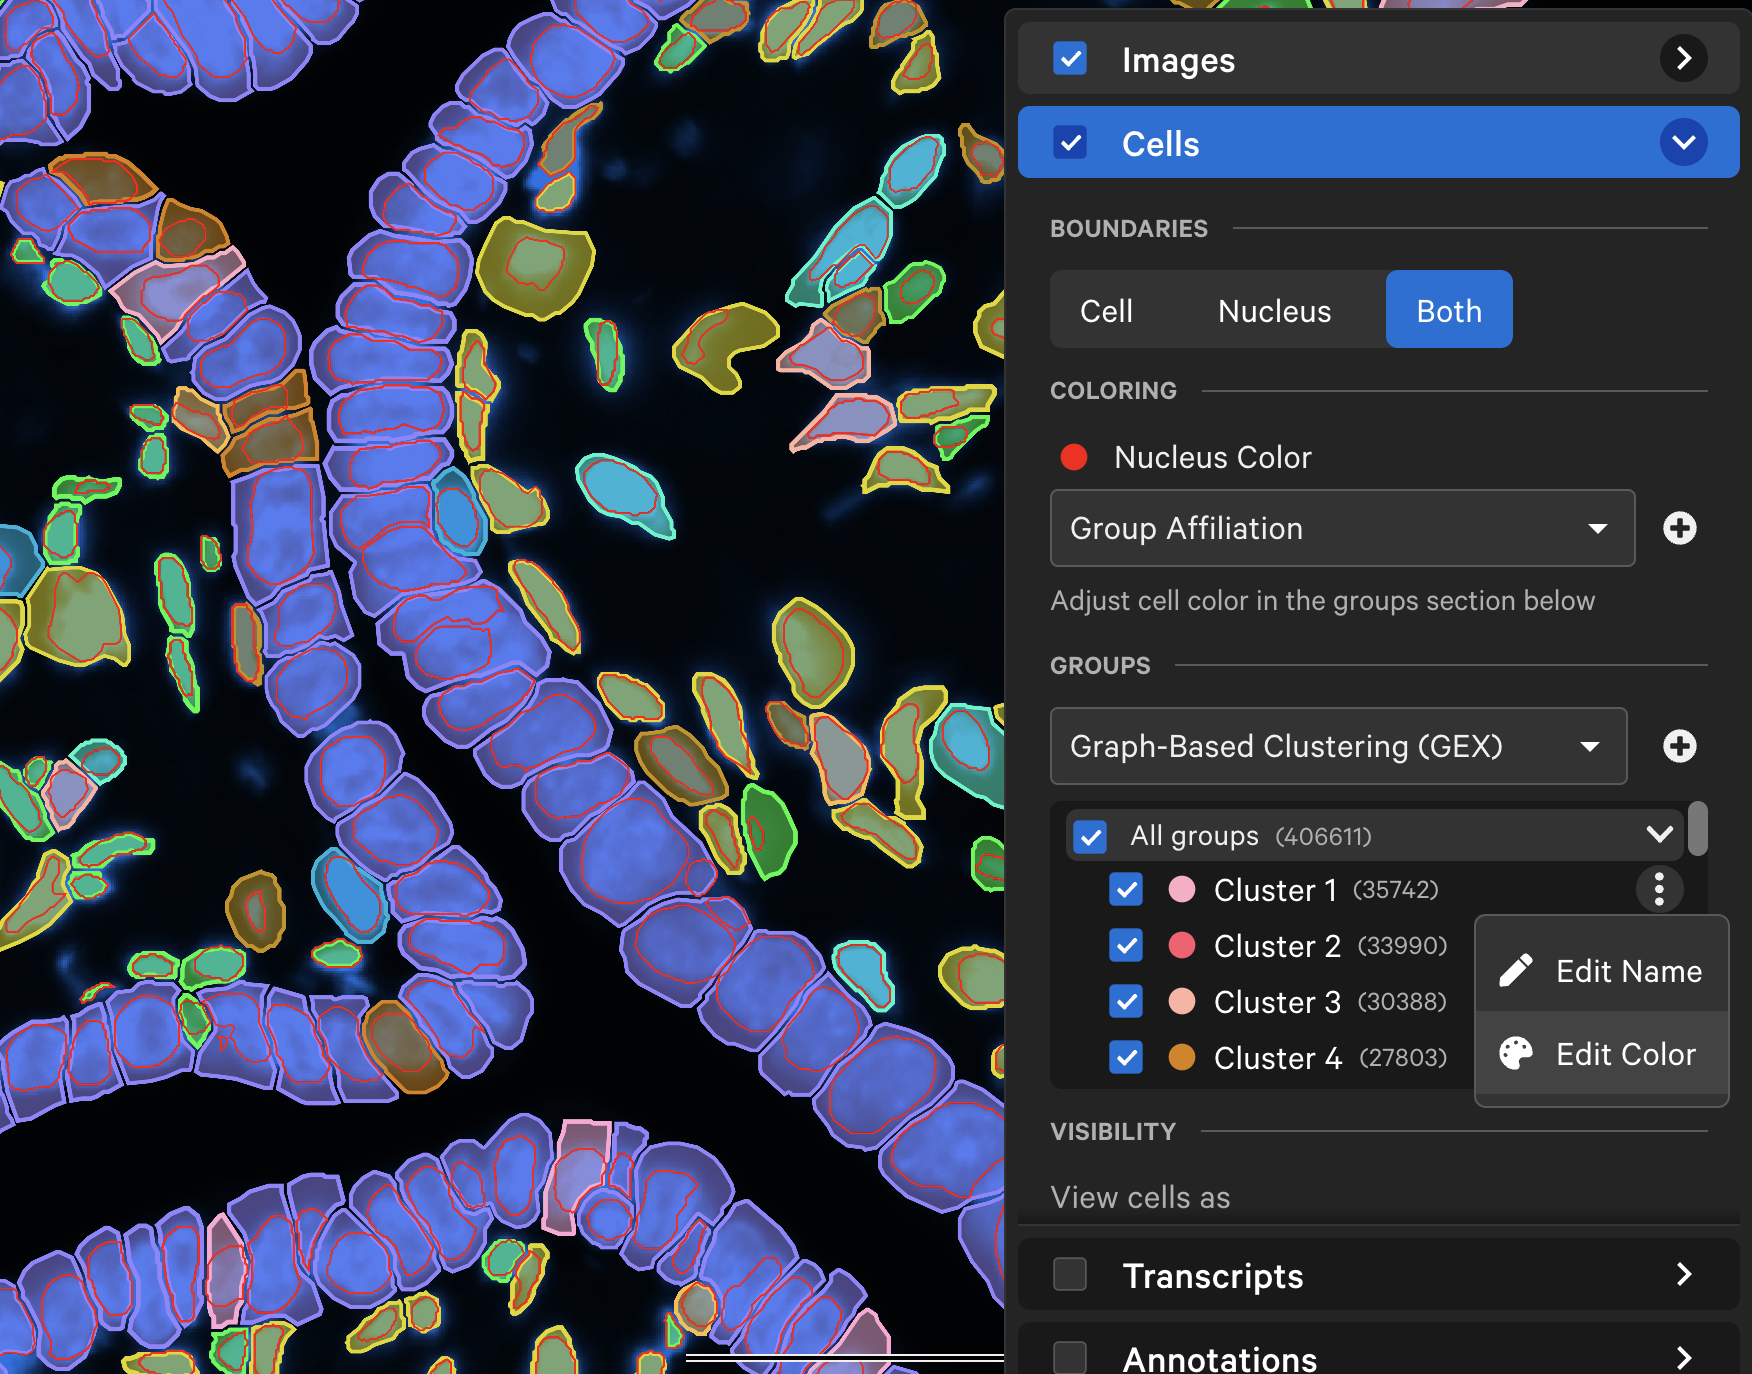
10x Explorer displays all cells with identified cell segmentation boundaries. Cells that were filtered from the Zarr file's unsupervised cluster results are labeled "Unassigned" (cells with fewer than five transcripts). For automated cell annotation clusters, cells with fewer than five transcripts are labeled "Unannotated", while the cells that the Pan-human Azimuth model could not assign (e.g., due to low transcripts or ambient RNA) are labeled "Unassigned".
Upload custom cell clusters as a CSV file in the Cells layer to annotate cells based on expression data (gene or protein depending on data modality).
Create a comma-separated value (CSV) file in a text editor, such as Microsoft Excel. The format of the CSV file is as follows:
- The first row must have the column headers in this order with these exact names:
cell_id,group, and optionally,color. cell_id: The first column is a list of cell ID names.group: The second column is a list of group labels.color: The third column is an optional list of custom colors in HEX format (e.g.,#ff0055or#FF0055) for each group label. You only need to add a HEX code for a given group label once in the file.
At this time, multiple custom cell groupings must be uploaded as separate CSV files. You can select each group in the "Cell groups" dropdown list.
Here is an example from an ovarian cancer dataset (download custom cell group file here) with the required columns:
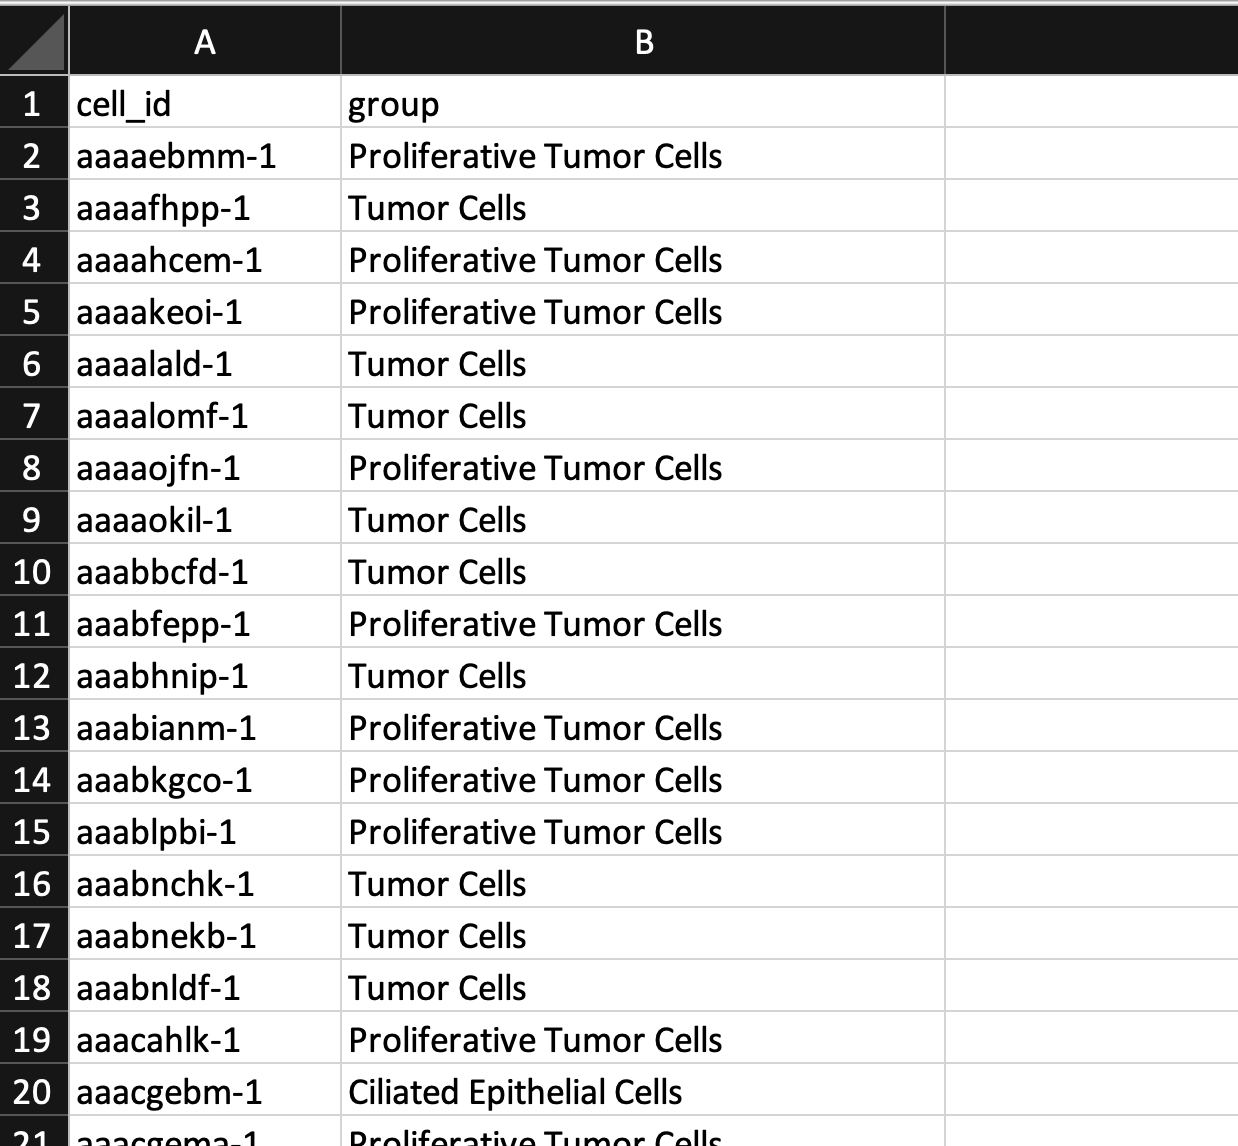
With custom colors:
cell_id,group,color
aaaaebmm-1,Proliferative Tumor Cells,#EE751A
aaaafhpp-1,Tumor Cells,#E8280E
aaaahcem-1,Proliferative Tumor Cells,
aaaakeoi-1,Proliferative Tumor Cells,
aaaalald-1,Tumor Cells,
aaaalomf-1,Tumor Cells,
aaaaojfn-1,Proliferative Tumor Cells,
aaaaokil-1,Tumor Cells,
aaabbcfd-1,Tumor Cells,
aaabfepp-1,Proliferative Tumor Cells,
aaabhnip-1,Tumor Cells,
aaabianm-1,Proliferative Tumor Cells,
aaabkgco-1,Proliferative Tumor Cells,
aaablpbi-1,Proliferative Tumor Cells,
aaabnchk-1,Tumor Cells,
aaabnekb-1,Tumor Cells,
aaabnldf-1,Tumor Cells,
aaacahlk-1,Proliferative Tumor Cells,
aaacgebm-1,Ciliated Epithelial Cells,#8EE525
...
Note that you must wait for cells to load in the window before the CSV file can be uploaded. Click the plus sign to add the CSV file. Then click Upload Custom Groups.
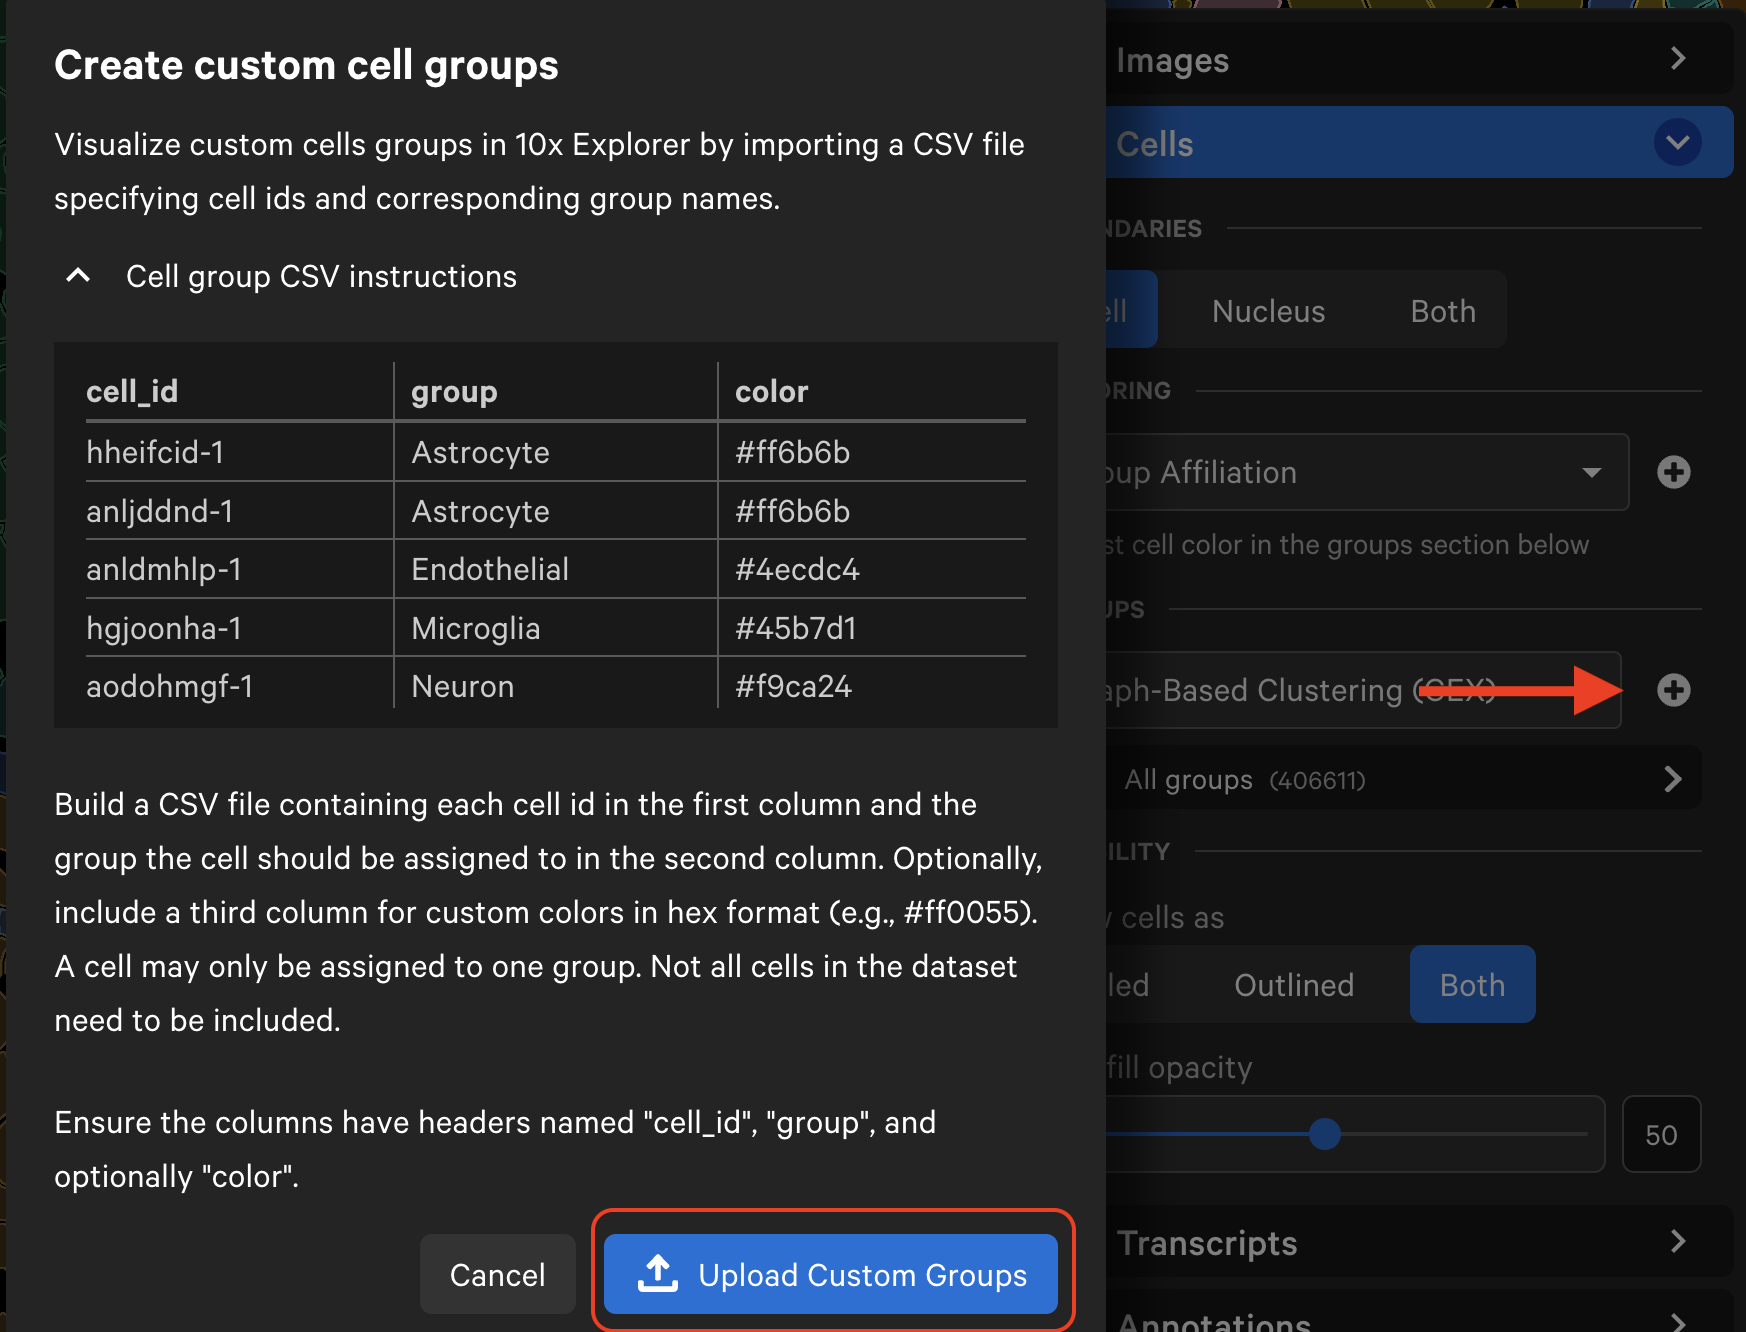
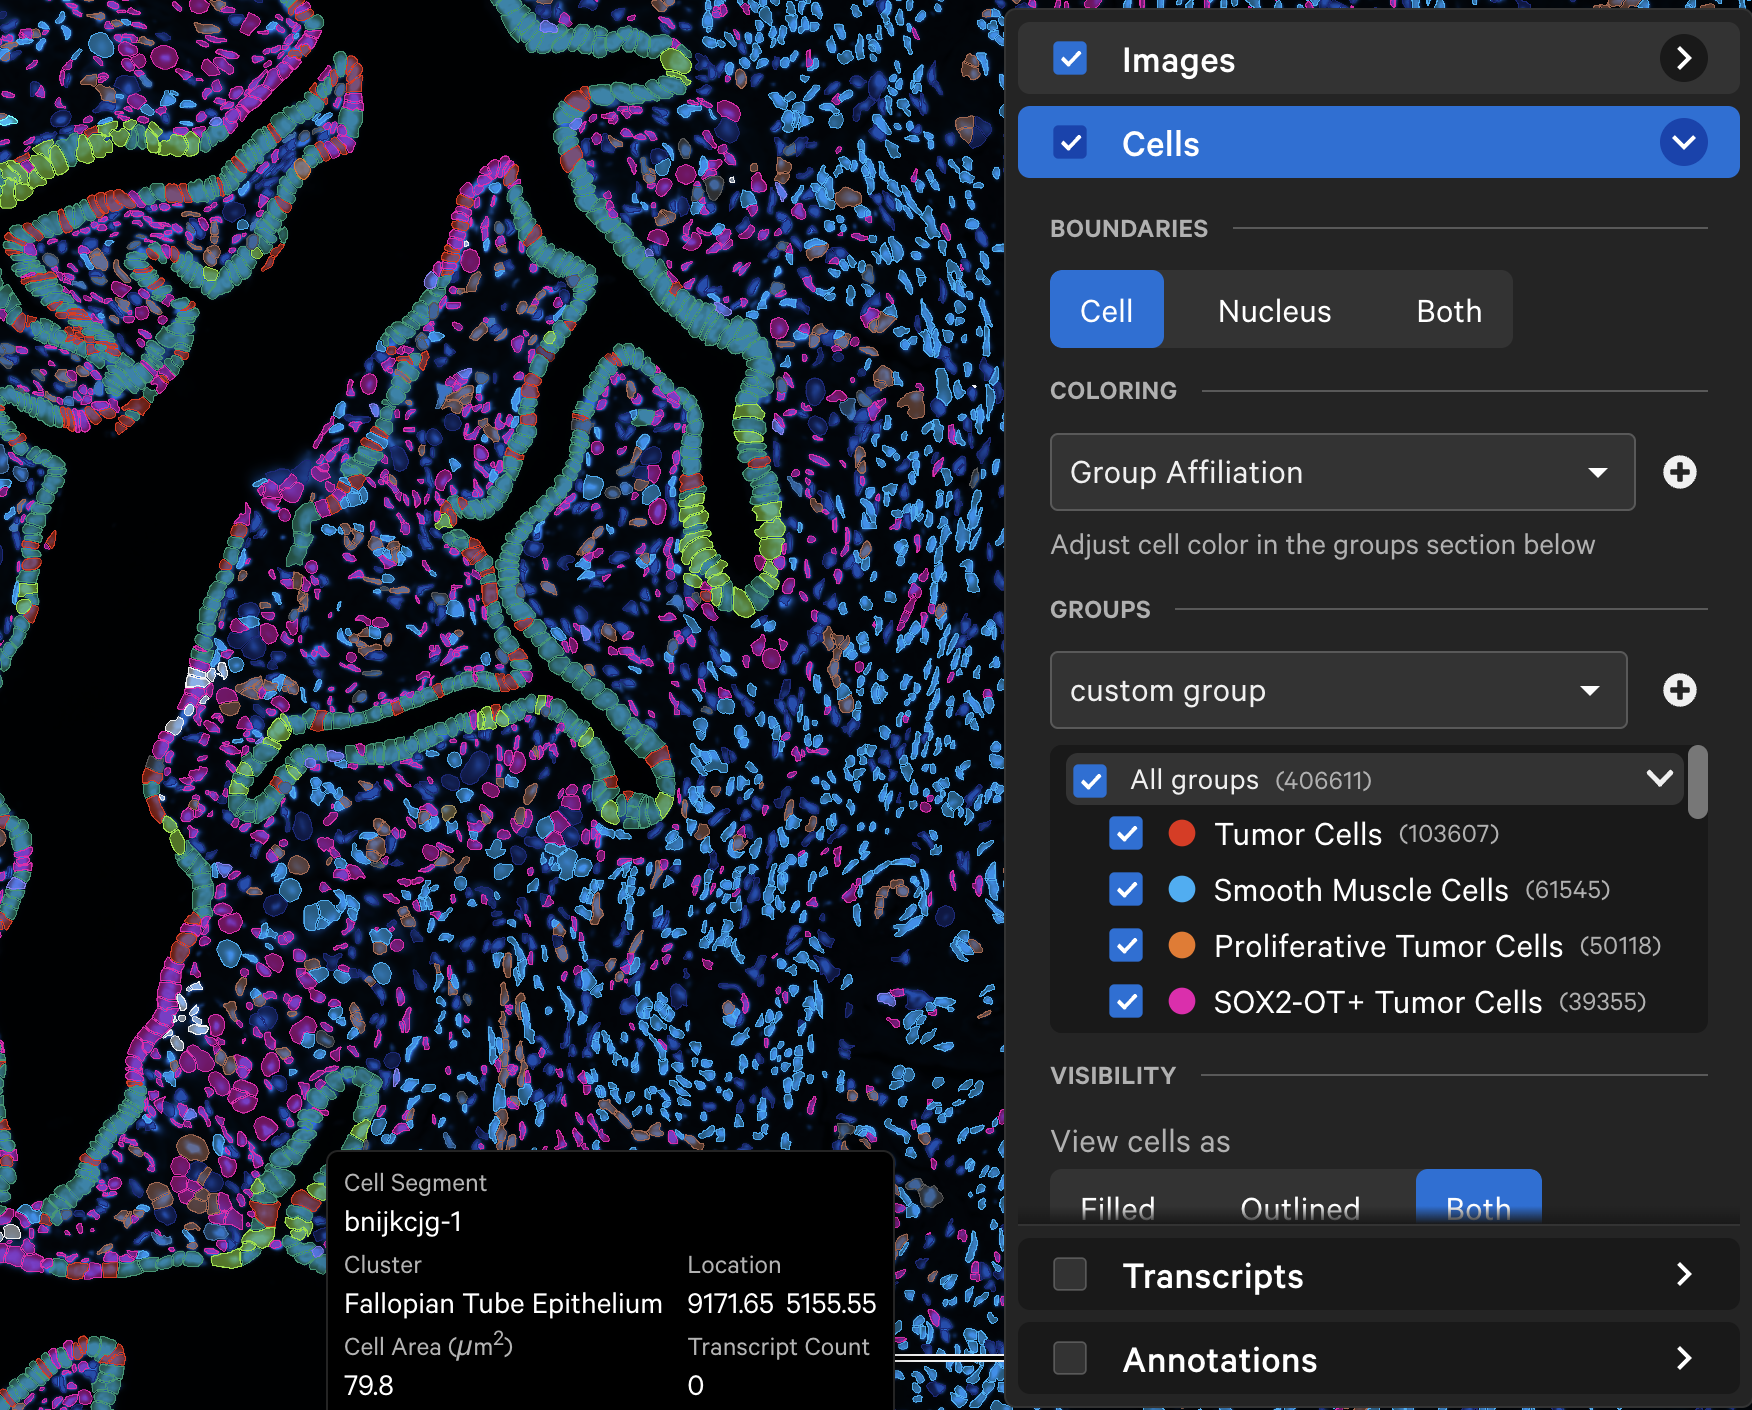
The uploaded cell groups can be saved to Saved Views. To share with colleagues, they will need to reupload the cell group CSV file. The custom cell groups look like this:
The custom cell metrics option allows you to view cell color by a continuous float value defined per cell in a CSV file.
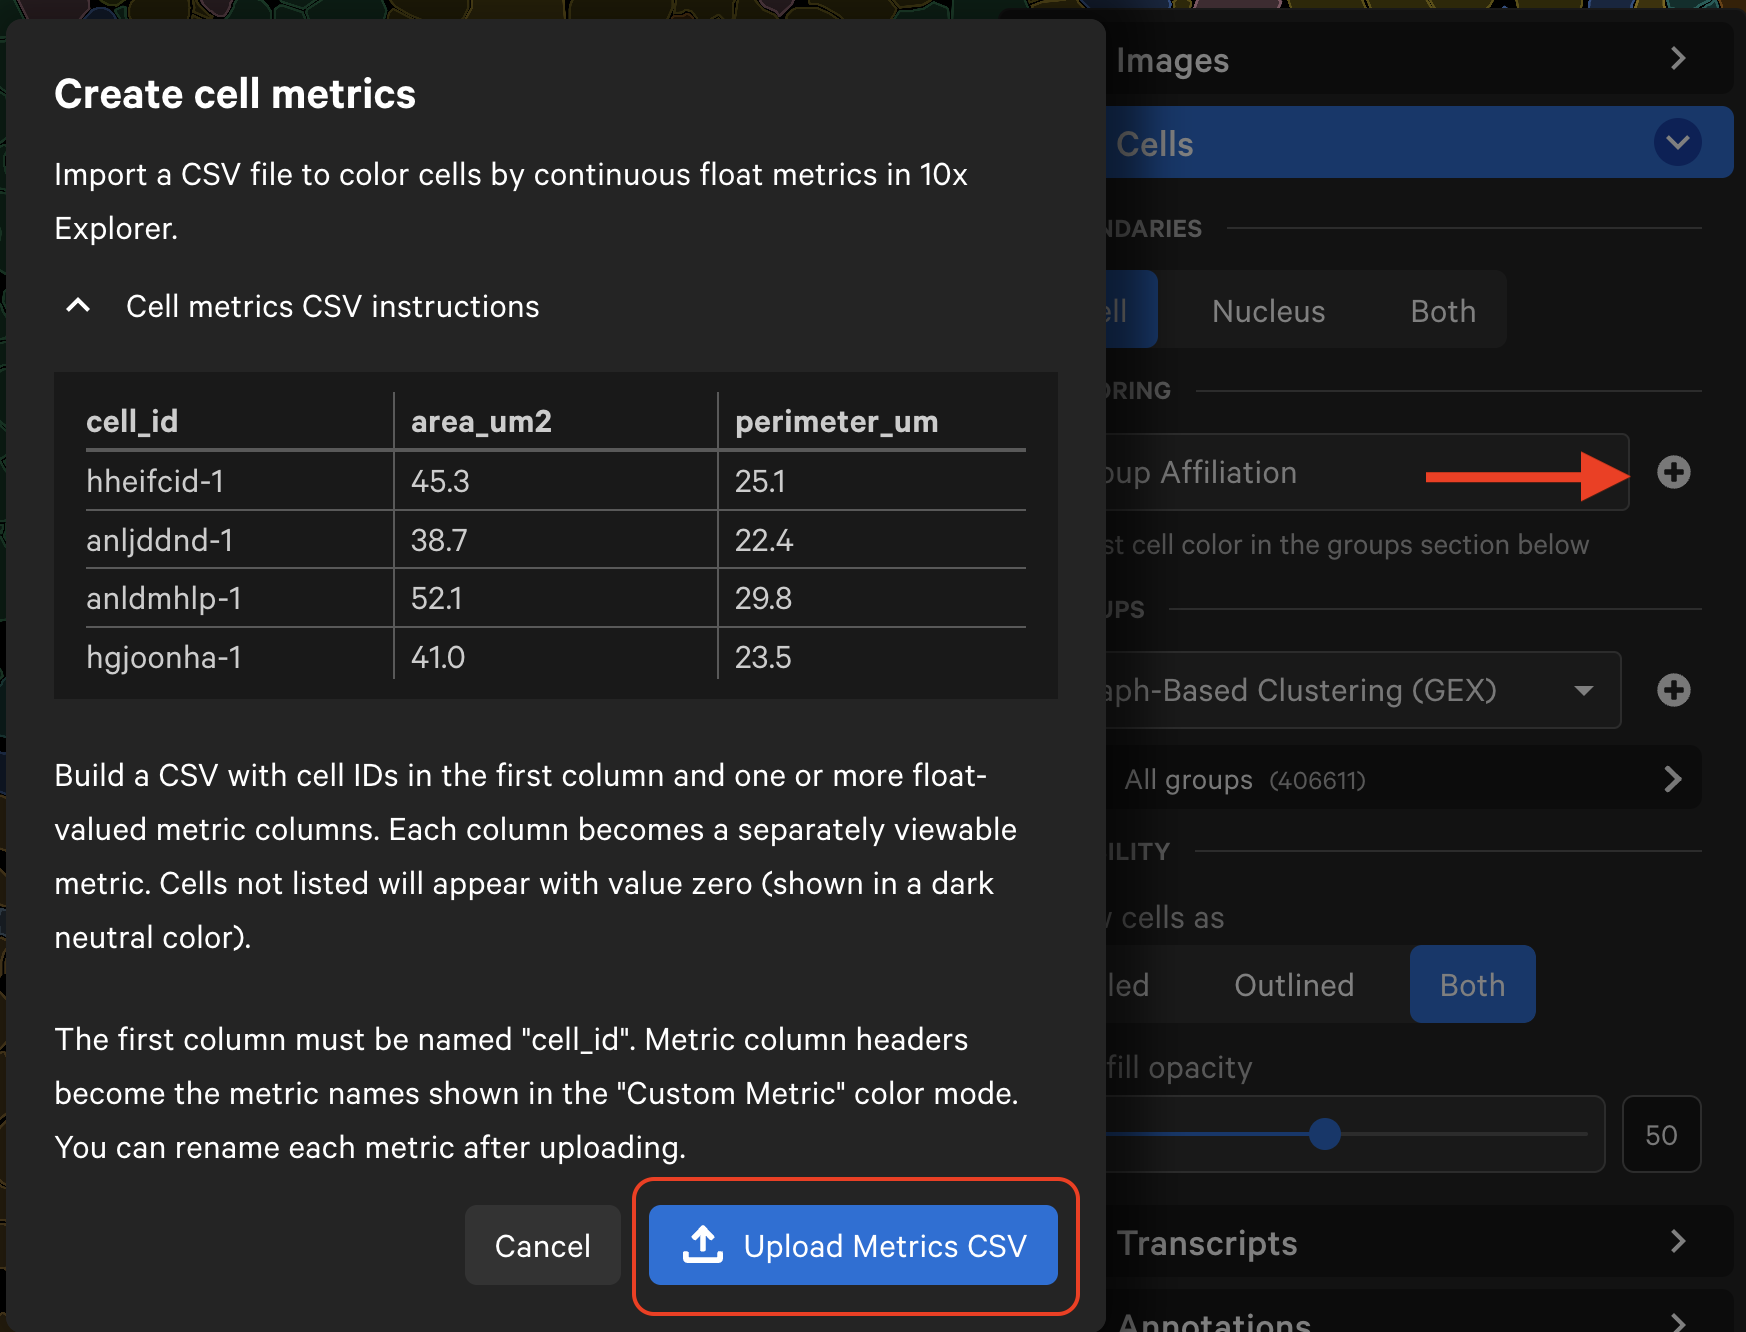
The first column must be named cell_id. Metric column headers become the metric names shown in the "Custom Metric" color mode. You can rename each metric after uploading the CSV file.
Example format:
cell_id,area_um2,perimeter_um
hheifcid-1,45.3,25.1
anljddnd-1,38.7,22.4
anldmhlp-1,52.1,29.8
hgjoonha-1,41.0,23.5
...
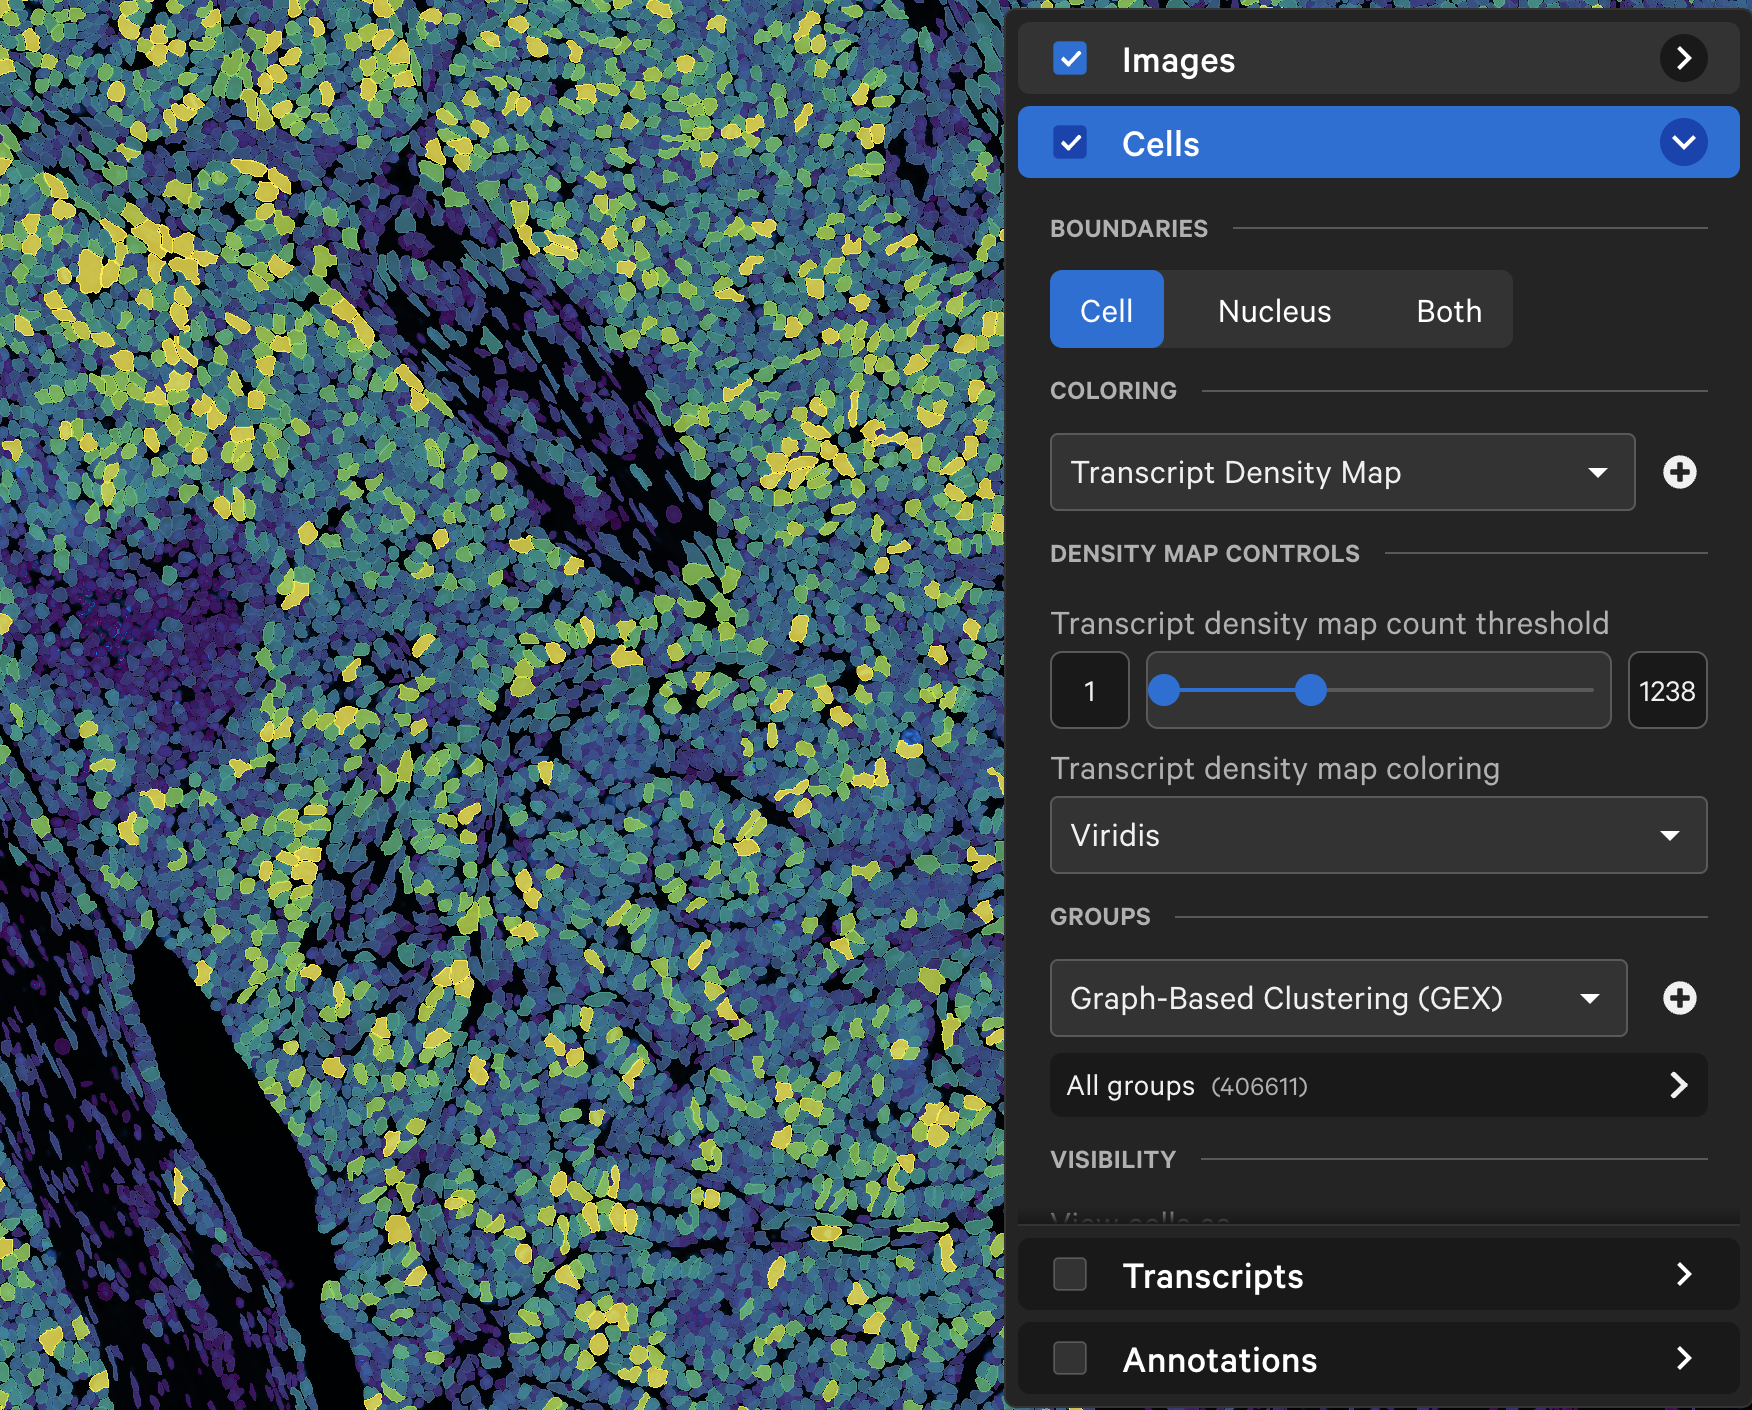
The transcript density is determined by the genes that are selected on the Transcripts layer. Cell colormap lower/upper bounds and fill opacity can be adjusted with the slider (click arrow above maximum threshold value to reset). There are several color palette options.
When colored by the transcript density map, the lowest transcript density cell maps to the lower end of the palette (i.e., viridis=purple), while the highest transcript density cell maps to the upper end of the palette (i.e., viridis=yellow), with a linear distribution in between. The Transcript density map count threshold slider allows you to choose a different mapping range, which can help to visualize cells that are at or beyond the limits of the density range.
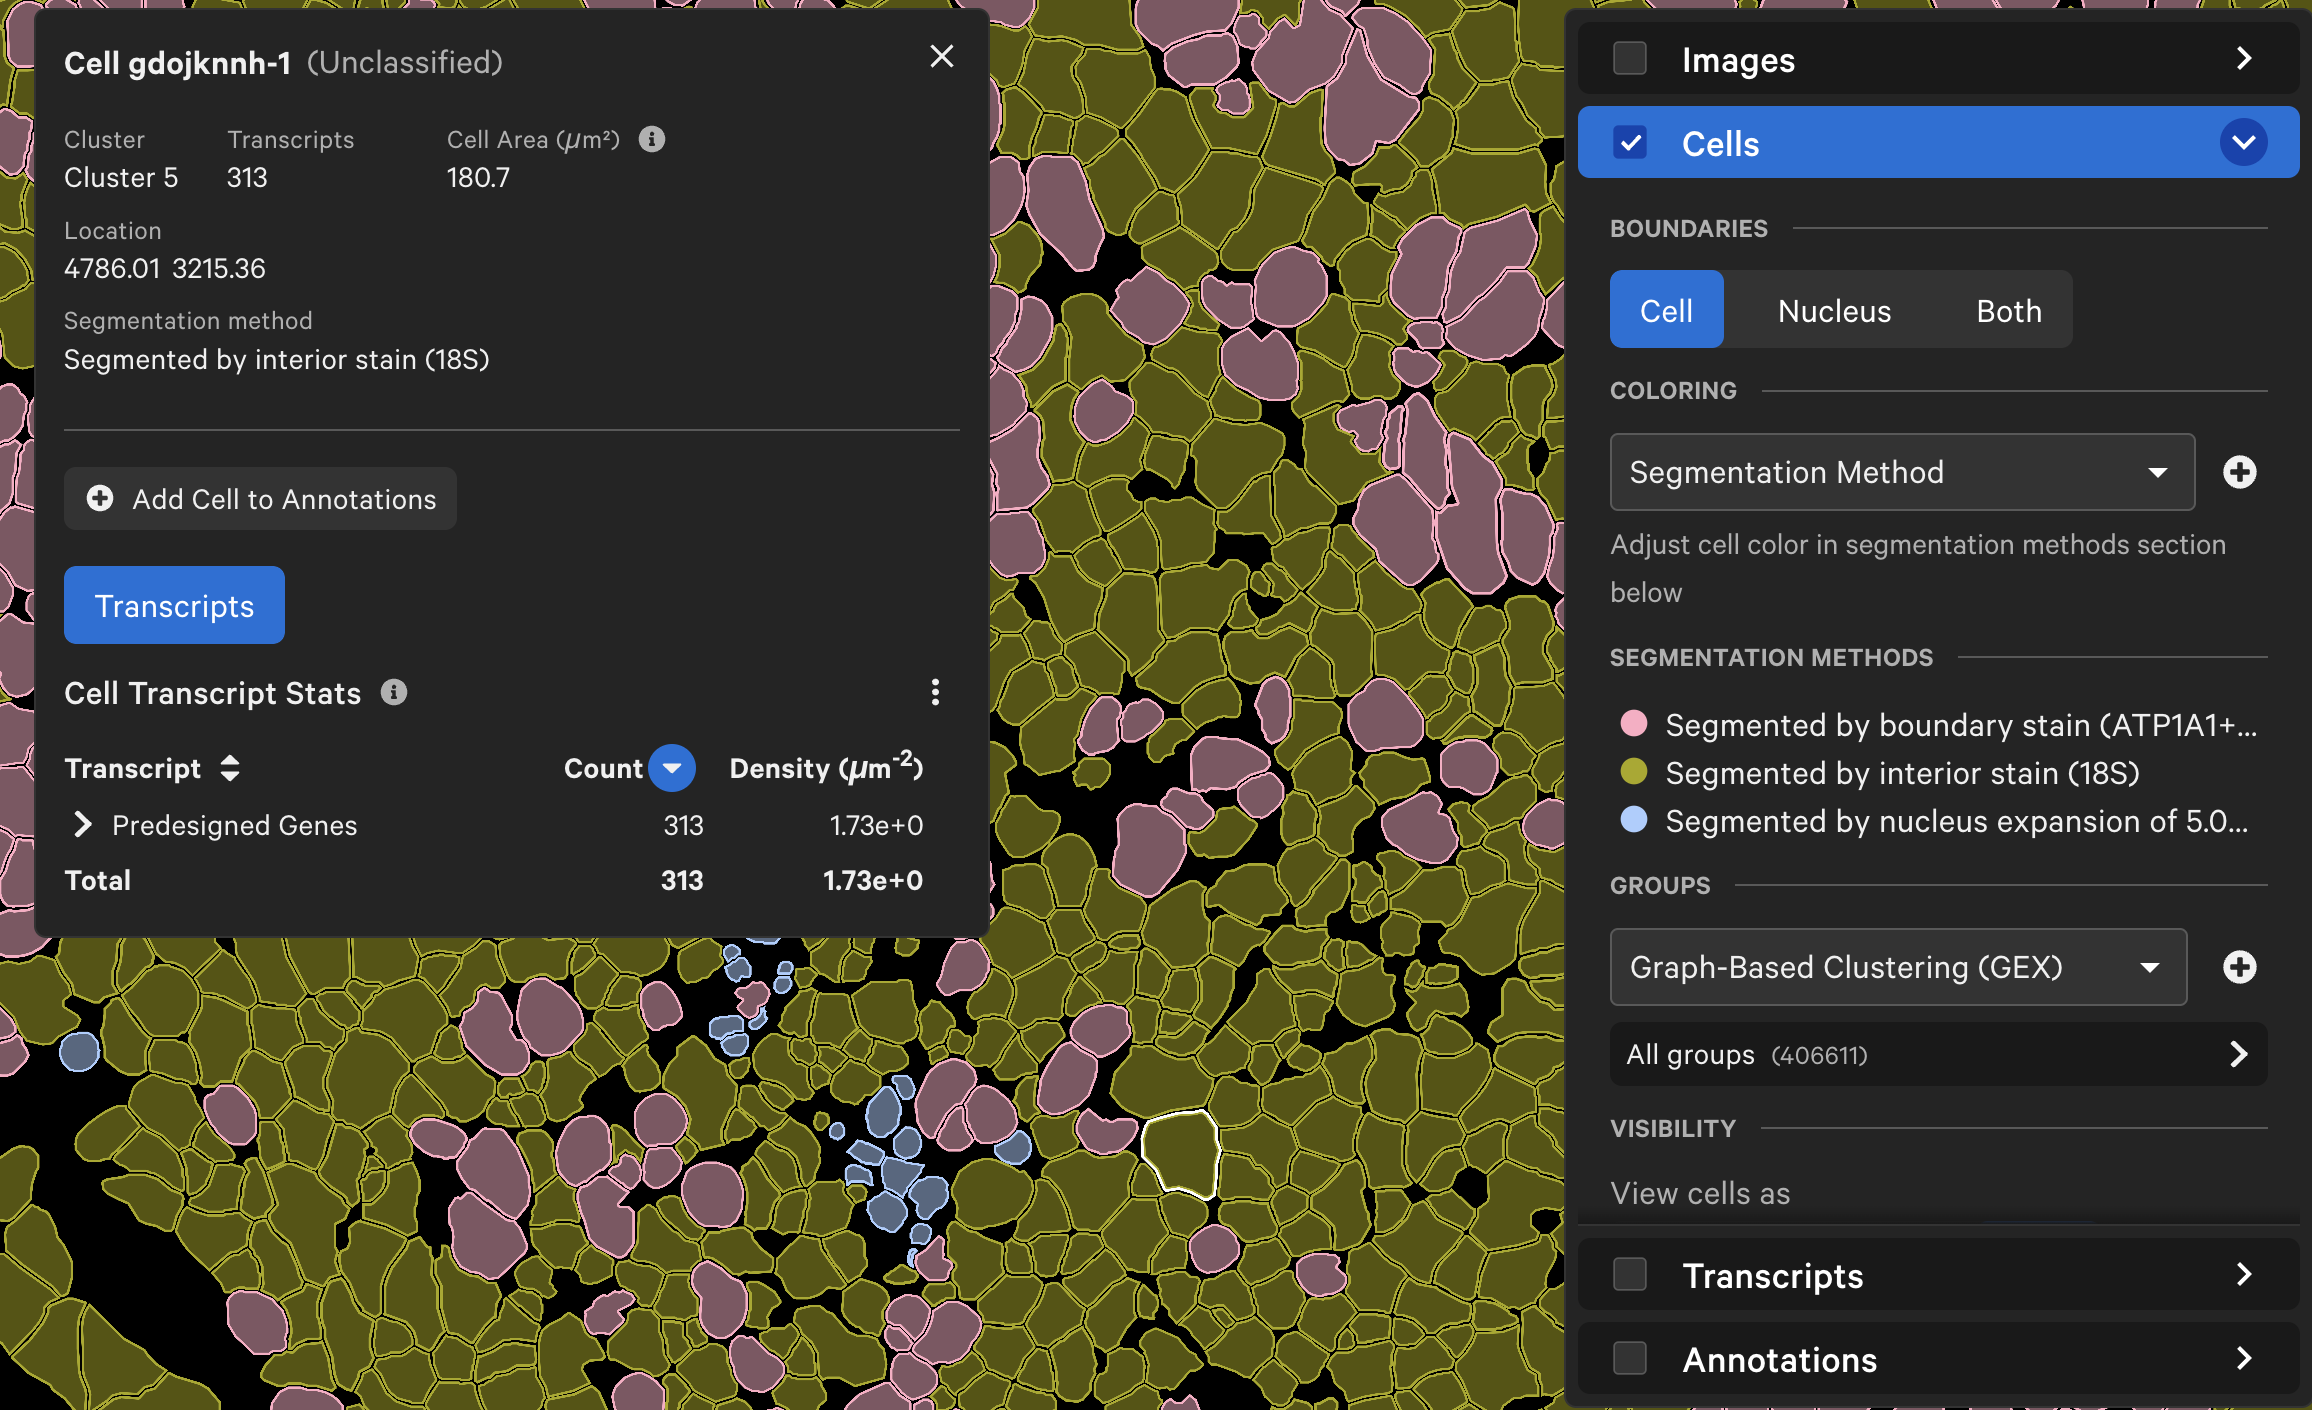
In the multimodal cell segmentation analysis workflow, up to three methods are used to segment cells (read more in the Atera Onboard Analysis and Xenium Onboard Analysis). You can visualize cells by the method used to segment them. This feature is useful for qualitatively checking nucleus and cell segmentation results (see checking data quality page).
To view all cells by segmentation method, select Segmentation Method in the dropdown menu for Cell Color. The inferred cell segmentation polygon boundaries are shown in 10x Explorer. To view the segmentation method for an individual cell, click on a cell to view information in the Selection pop-up window.