Answering Your Questions About Chromium Single Cell Multiome ATAC + Gene Expression

Find answers to your pressing questions about the new single cell multiomics solution from 10x Genomics: Chromium Single Cell Multiome ATAC + Gene Expression. From nuclei isolation protocols to multiomic data analysis and integration, dive deeper into the experimental considerations for simultaneously profiling gene expression and open chromatin from the same cell, and explore the discovery power of a truly dual assay.

In an effort to gain deeper insights into how gene expression patterns, cell types, and cell states are established, scientists have been looking to access a unified view of a cell’s open chromatin landscape and gene expression profile. Now, with Chromium Single Cell Multiome ATAC + Gene Expression, researchers can capture both the transcriptome and epigenome simultaneously in the same single cells, leading to the potential discovery of new gene regulatory interactions and a better interpretation of epigenetic profiles with key expression markers.
We introduced this innovative technology in a recent blog article, after asking the 10x Genomics scientists who helped to develop Chromium Single Cell Multiome ATAC + Gene Expression how it will accelerate biological discovery. Some of those scientists, including Kamila Belhocine, PhD, Staff Scientist, and Laura DeMare, PhD, Product Manager, also recently gave an introductory webinar to provide an overview of the workflow, experimental considerations, and capabilities.
You can watch the full on-demand webinar now, or keep reading to see some highlights from the Q&A following the presentation. Find out what the 10x Genomics experts on single cell multiomics have to say about its potential to unlock deep insights into cell identity and gene regulation.
One cell, two readouts
What unique information can someone get from a dual assay?
The fundamental information that a researcher can access with Single Cell Multiome ATAC + Gene Expression is the relationship between open regions of chromatin, positions in the genome where epigenetic regulatory elements reside, and the expression of specific genes within the same cell. In other words, the technology provides a measurement of the effects of putative regulatory regions on gene expression, allowing linkage of that information within specific cell types of interest.
This can reveal additional insights into cellular heterogeneity and what regulatory elements define unique cell types and states. The combined readout can also reveal gene regulatory interactions—which regions of the genome regulate which genes and what their ultimate relationship is, whether correlating positively with increased expression, or negatively with decreased expression. Researchers can then use this information to understand the functional roles of those regulatory elements in the cell populations, samples, and disease models they’re studying.
How does the sensitivity of Chromium Single Cell Multiome ATAC + Gene Expression compare to the individual gene expression and ATAC assays carried out separately?
In the samples tested with Single Cell Multiome ATAC + Gene Expression, we’ve observed comparable sensitivity to the standalone assays when the starting input is nuclei. More data about the comparative sensitivity of the multiomic approach can be found in this technical note.
How will starting with nuclei impact transcriptomic profiles?
For researchers using cells for their single cell RNA-seq experiments, one important consideration is whether you will still see a comparable readout of the transcriptome in nuclei compared to the cells. Nuclei have less mRNA, so fewer total number of genes and UMIs may be detected when profiling gene expression from nuclei versus whole cells. However, the difference in sensitivity is highly dependent on the sample type. We’ve observed, for example, ~20–40% fewer total genes captured and ~20–60% fewer total UMIs when comparing nuclei to whole cells in various sample types.
Importantly, 10x Genomics scientists and others (Habib et al., Bakken et al., Korrapati et al.) have observed that cell populations recovered between single cell and single nuclei RNA-seq are comparable, and marker expression is maintained. Depending on the sample, and if harsh dissociation steps are needed, you may see a difference in the proportion of cell populations. However, we see similar proportions of cell types recovered when comparing cells and nuclei from peripheral blood mononuclear cells (PBMCs).
What are some benefits of starting with single nuclei?
First, researchers can reduce bias in cell populations caused by cell dissociation and minimize stress-induced transcriptional artifacts. They can also reduce microfluidic cell capture bias due to cell size. For example, large cells like neurons are more easily captured in a microfluidic workflow using single nuclei. Nuclei also enable single cell studies of intact frozen whole tissue when isolation of viable whole cells is difficult.
Best practices for single nuclei isolation
What are the best methods for isolating nuclei?
Successful nuclei isolation requires attention to detail. Depending on a number of factors—including sample type, whether you are working with whole tissue or a cell suspension, whether you are starting with fresh or frozen materials, the manner in which the sample was frozen, and cell count—there will be specific decision points in the nuclei isolation protocols that change how the sample is handled. 10x Genomics has developed specialized protocols optimized for multiomic profiling and offering guidance for each of these factors. Find protocols specific for use with tissues, or alternatively, with cell lines and PBMCs, on our support site.
Optimal cell lysis that avoids nuclear membrane leakage is key to obtaining a clean, clump-free nuclei suspension. Cell lysis time is optimized based on sample type. Lysis efficacy is then assessed using a high power microscope. Optimal nuclei isolation is reached when most cells stain as dead, meaning the cell membrane has broken, but the nuclear membrane looks intact. Details on how to perform cell lysis, and what your nuclear membranes should and shouldn’t look like, can be found in this article.
Analysis and integration of multiomic data
How do I analyze the data output of the Single Cell Multiome ATAC + Gene Expression workflow?
The products of the Single Cell Multiome workflow are one ATAC and one gene expression library. Following sequencing, raw data is loaded into the Cell Ranger ARC analysis pipeline and visualized using Loupe Browser. Both software tools are available for download on the 10x Genomics support website. Together, they provide a unified analysis of single cell ATAC and gene expression data across a population of cells and in specific cellular clusters.
In collaboration with Argelaguet et al., 10x Genomics has also developed a vignette that demonstrates how to integrate single cell RNA-seq and ATAC-seq data from the Chromium Single Cell Multiome ATAC + Gene Expression workflow. This leverages MOFA, a factor analysis model that provides a general framework for the integration of multiomic data sets in an unsupervised fashion. You can explore the vignette, which utilizes data from PBMCs from a single healthy donor sample, here. For more details, see the MOFA2 repository.
Other powerful data analysis tools also support integrated analysis of multiome data, that is, data originating from the same cell. Dr. Rahul Satija of the New York Genome Center and members of the Satija Lab have released a bioRxiv pre-print demonstrating the integration of multiomic data with Seurat v4, including weighted nearest neighbor analysis on a PBMC dataset generated using the Chromium Single Cell Multiome ATAC + Gene Expression workflow. You can explore this software and its capabilities in more detail during Dr. Satija’s upcoming webinar, Integrative analysis of multi-modal single-cell data, a featured event in our single cell multiomic webinar series.
How can you link gene expression output to potential regulatory features?
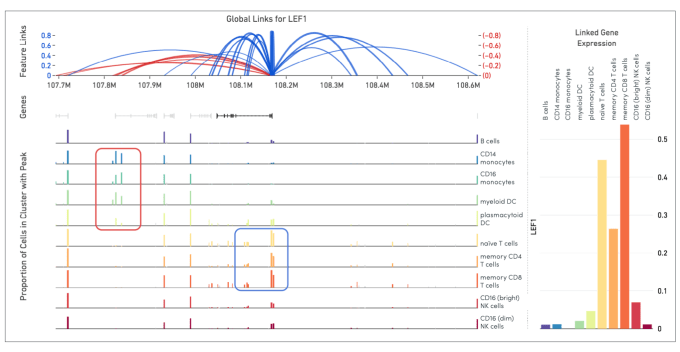
Cell Ranger ARC generates a variety of analyses pertaining to gene expression, chromatin accessibility, and their linkage. This includes the identification of open chromatin regions and simultaneous counting of transcripts and peak accessibility in single cells. Since the ATAC and gene expression measurements are on the same cell, we are able to perform analyses that link these readouts of chromatin accessibility and gene expression. This is called feature linkage.
Linkage of transcriptomic and epigenomic modalities indicates when the expression of a certain gene correlates with specific open chromatin regions around it. Detection of feature linkage reveals how open chromatin might affect gene expression in a specific cell type or cell state, relative to other cell types in a diverse population. A positive linkage between gene expression and an open region of chromatin, or a chromatin peak, suggests that this peak may play an activating role in the expression of the gene. Conversely, the presence of a certain peak in a subset of cellular clusters may be strongly correlated with the absence of expression. This indicates the peak may play a role in repressing gene expression.
Diving deeper into single cell multiomics
Are you looking for an introductory overview of the single cell multiomic workflow, or want to dive deeper into one of the questions posed in this article?
Watch the full, on-demand webinar introducing Chromium Single Cell Multiome ATAC + Gene Expression, and find additional resources on related topics, including nuclei sample preparation, data analysis and visualization, and multiomic data integration, by checking out our comprehensive webinar series.