Xenium In Situ Datasets

Explore Human Breast Tumors

Use Xenium Explorer Demo, a preview of the desktop app, to explore a Xenium In Situ dataset from a 0.4 cm² human breast cancer FFPE section using a 280-gene Xenium Human Breast Gene Expression Panel with 33 additional custom genes.

Open in Xenium Explorer Demo
View or download outputs
Learn how to use Xenium Explorer
human breast tumors
This is a preview of Xenium In Situ data from a development version of Xenium.
Go to www.10xgenomics.com/datasets to view new data from the improved production version of Xenium Analyzer.

Key Metrics

  • Species and tissue
    Human breast
  • Preservation method
    FFPE
  • Off-the-shelf panel used
    Xenium Human Breast Gene Expression Panel (280 genes)
  • Number of custom genes
    33
  • Tissue area
    0.4 cm²
  • Number of cells detected*
    167,780
  • Total transcripts detected*
    34,442,716
  • Median transcripts per cell*
    166
*Metrics may differ slightly from preprint because this dataset was processed using a newer version of the analysis pipeline

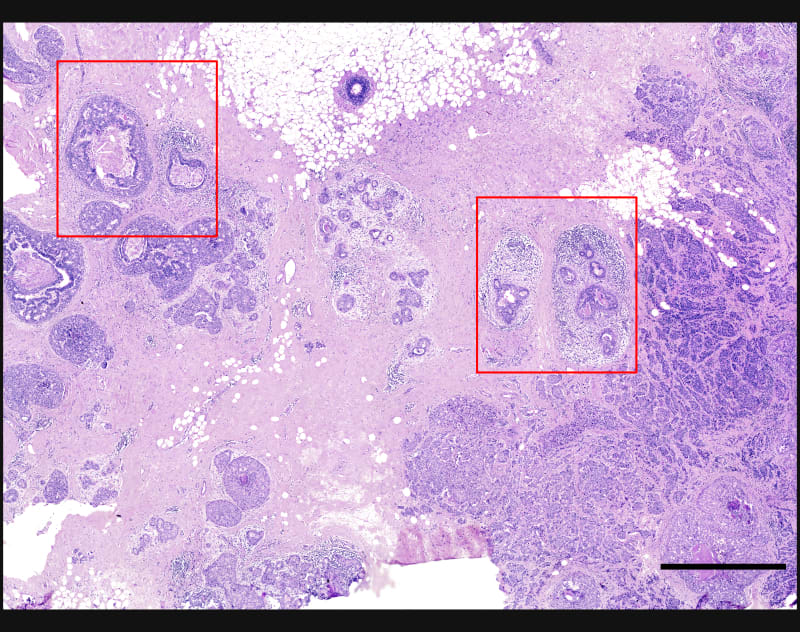
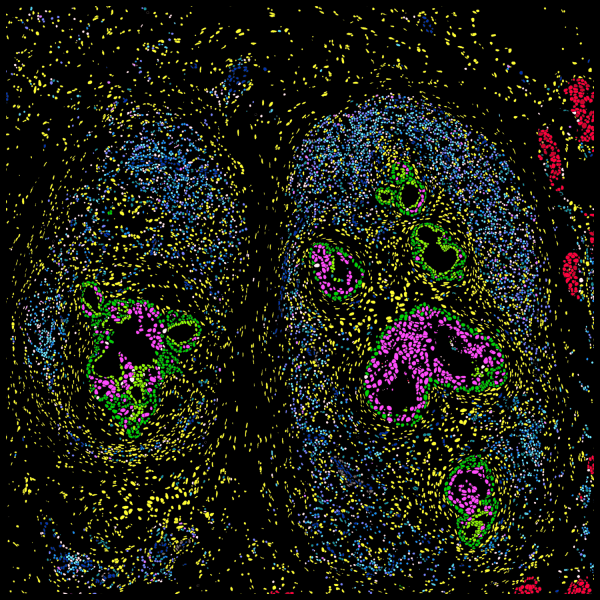
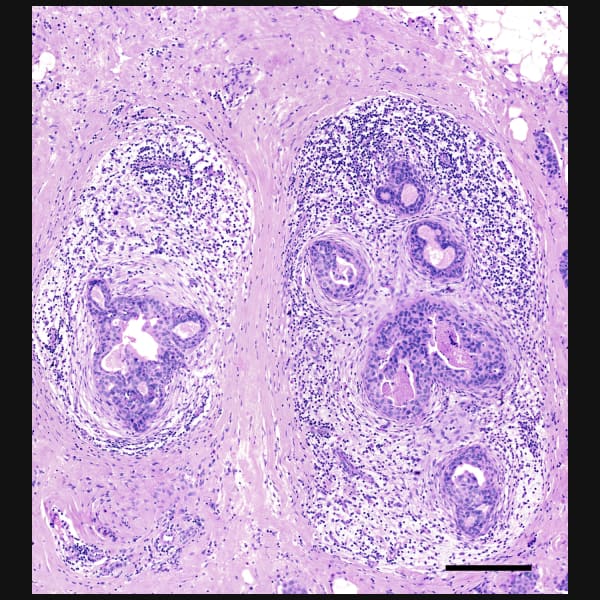
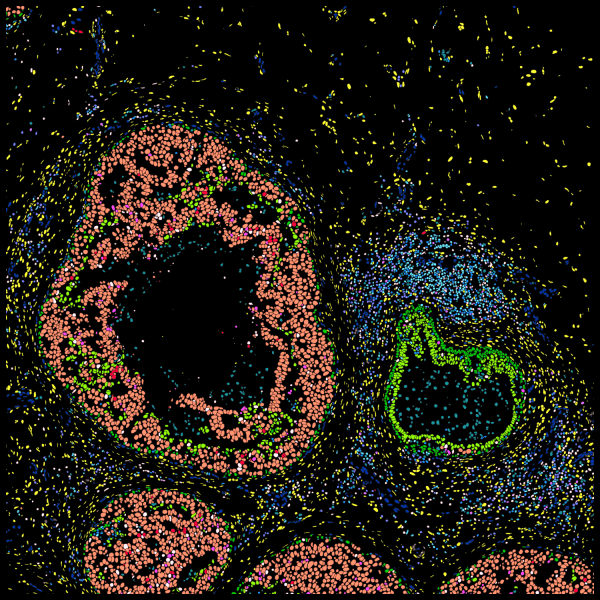
Explore cell type heterogeneity with Xenium and verify with H&E staining on the same section.

Different tissue macrostructures are revealed by the spatial organization of cell types and gene features, capturing vast cellular and molecular heterogeneity within tumor regions

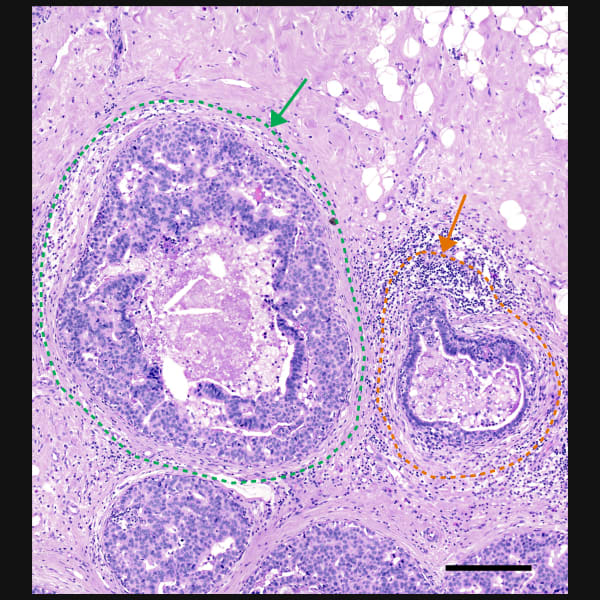
Xenium identifies major cell types in the human breast. As shown in two examples, spatial information is necessary to study tumor subtype heterogeneity and the microenvironment surrounding tumor epithelial cells. Interpretation and validation of rich transcript information is assisted by H&E staining acquired post-Xenium.

Cells colored by expression profiles in tSNE space and mapped back to original tissue space
H&E image
Cells colored by expression profiles in t-SNE space and mapped back to original tissue space (top). H&E image of the same section. Scale bar 1 mm (bottom).
Atypical ductal hyperplasia
Atypical ductal hyperplasia. Myoepithelial cells (green) are present in healthy breast lining the basal cell layer of epithelium. In hyperplasia, some cells exhibit expression profiles more similar to cells typically found in ductal carcinoma in situ (DCIS).
DCIS (left) in proximity to benign duct ectasia (right)
DCIS (green arrow) in proximity to benign duct ectasia (orange arrow). In duct ectasia, macrophages are detected within the thickened duct wall, surrounded by inflammatory cells. Scale bar 200 μm.

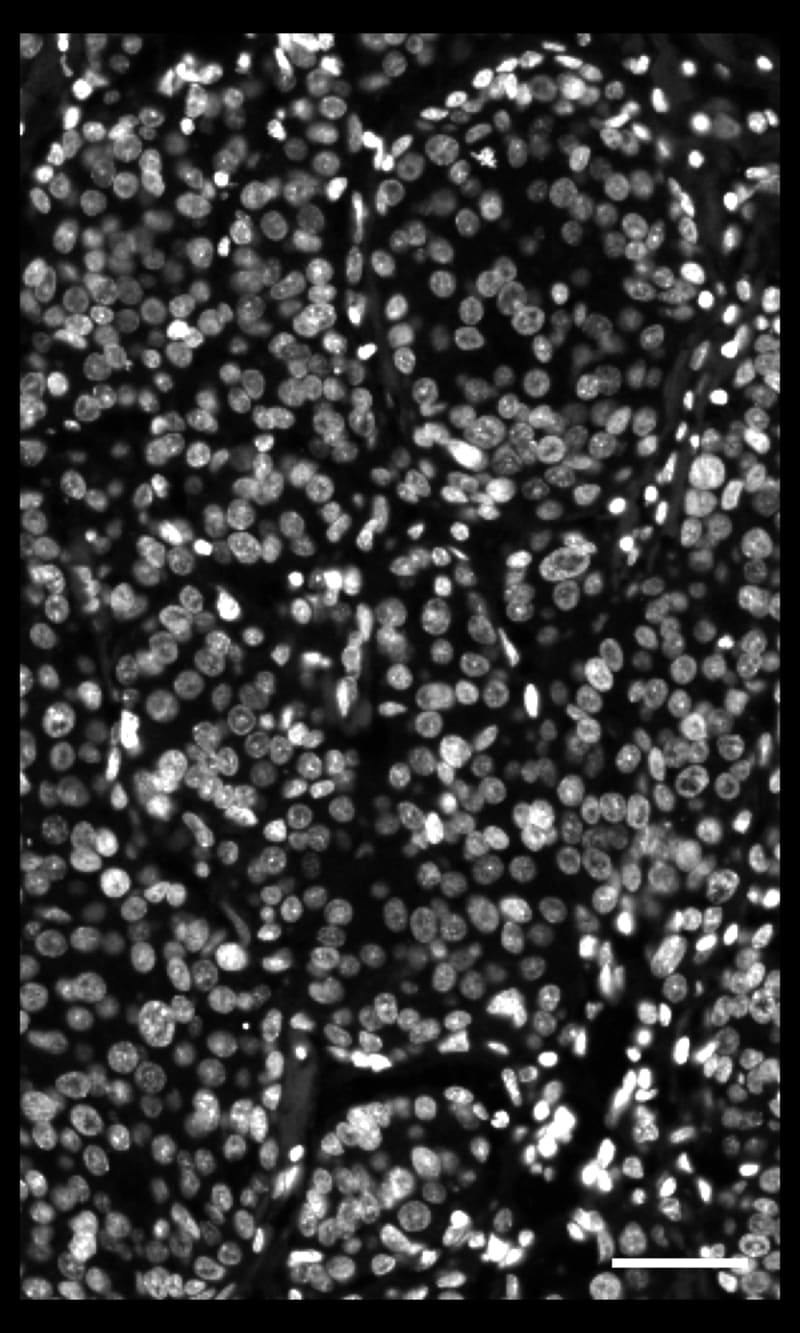
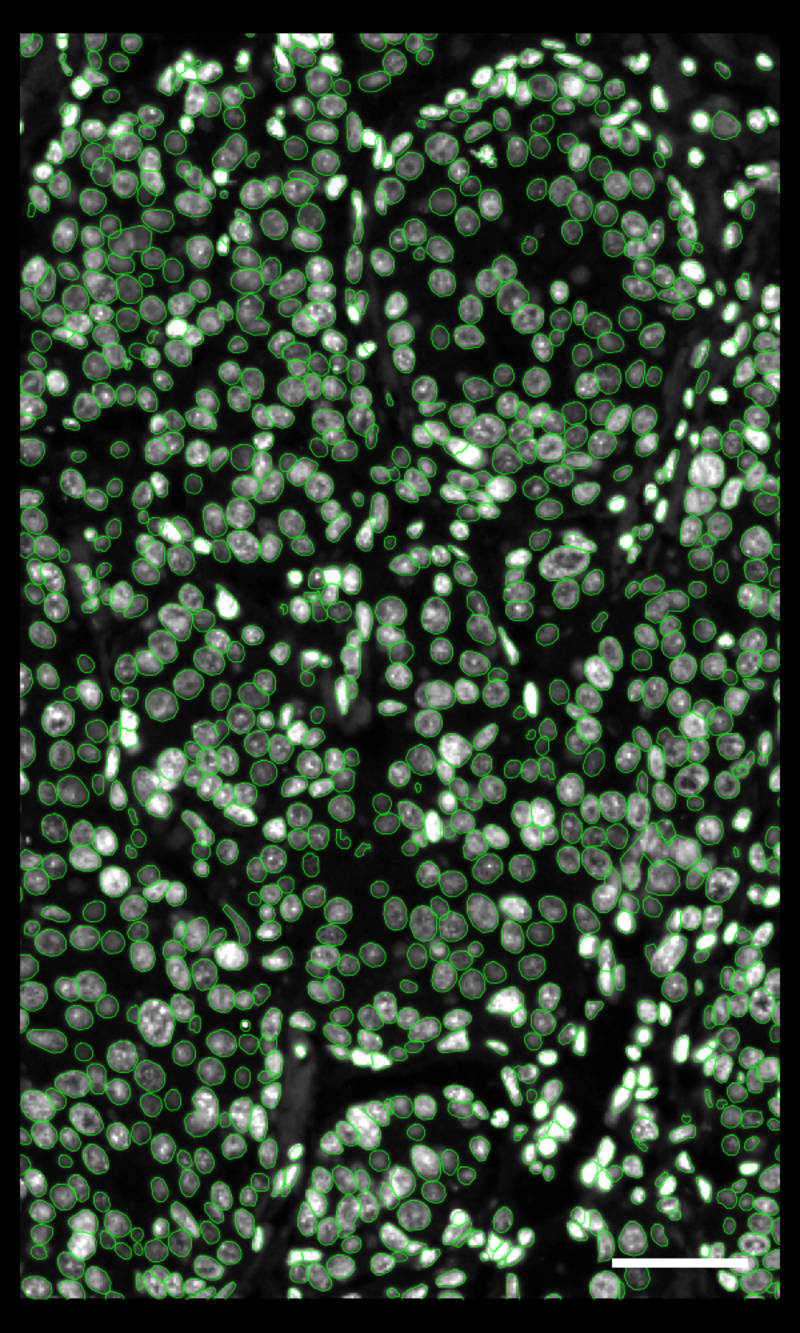
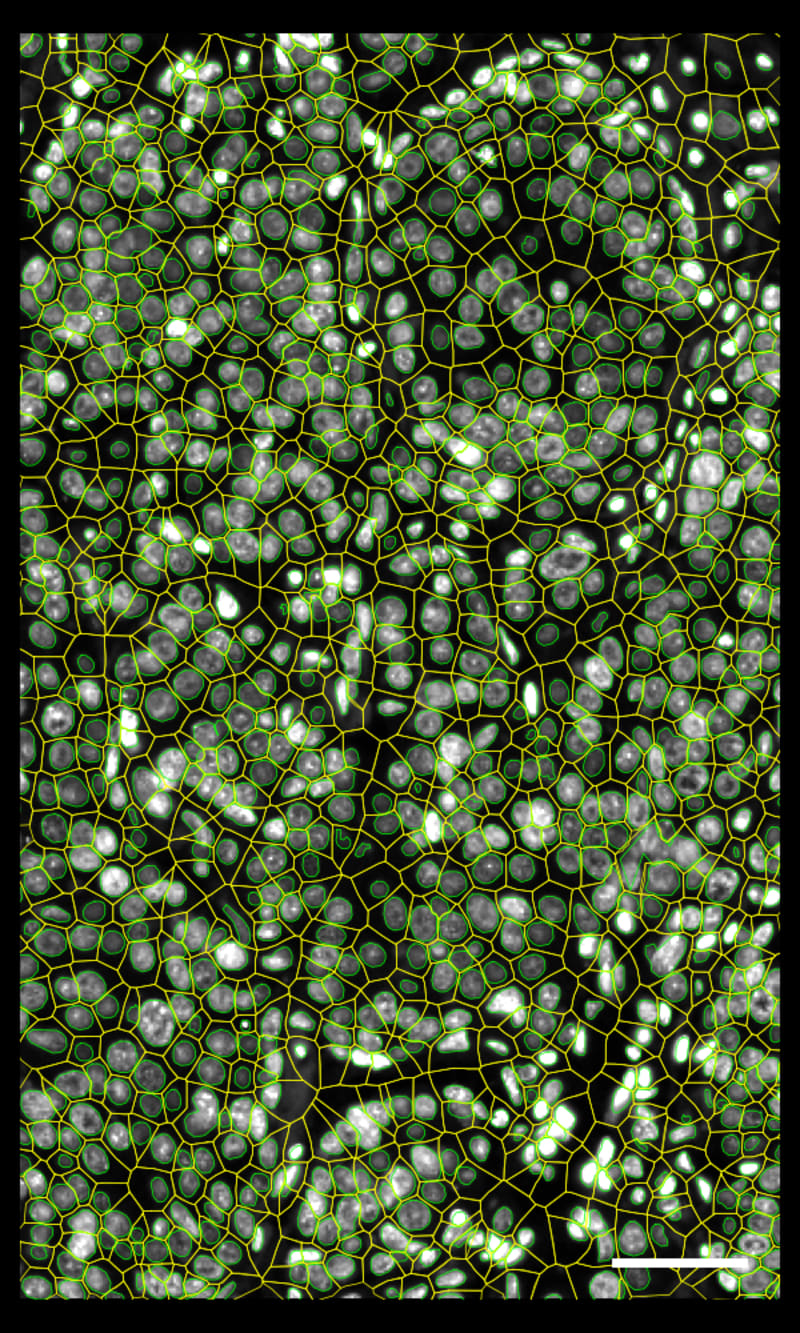
DAPI-based cell segmentation

Xenium uses an in-house trained model to segment nuclei from the DAPI image. Nuclei of irregular shapes are segmented well using Xenium analysis software. Transcripts are assigned based on expansion from nuclei.

DAPI image
DAPI image. Scale bar: 50 μm
DAPI image with nuclear outlines
DAPI image with nuclear outlines. Scale bar: 50 μm
DAPI image with nuclear (green) and cellular (yellow) outline
DAPI image with nuclear (green) and cellular (yellow) outlines. Scale bar: 50 μm

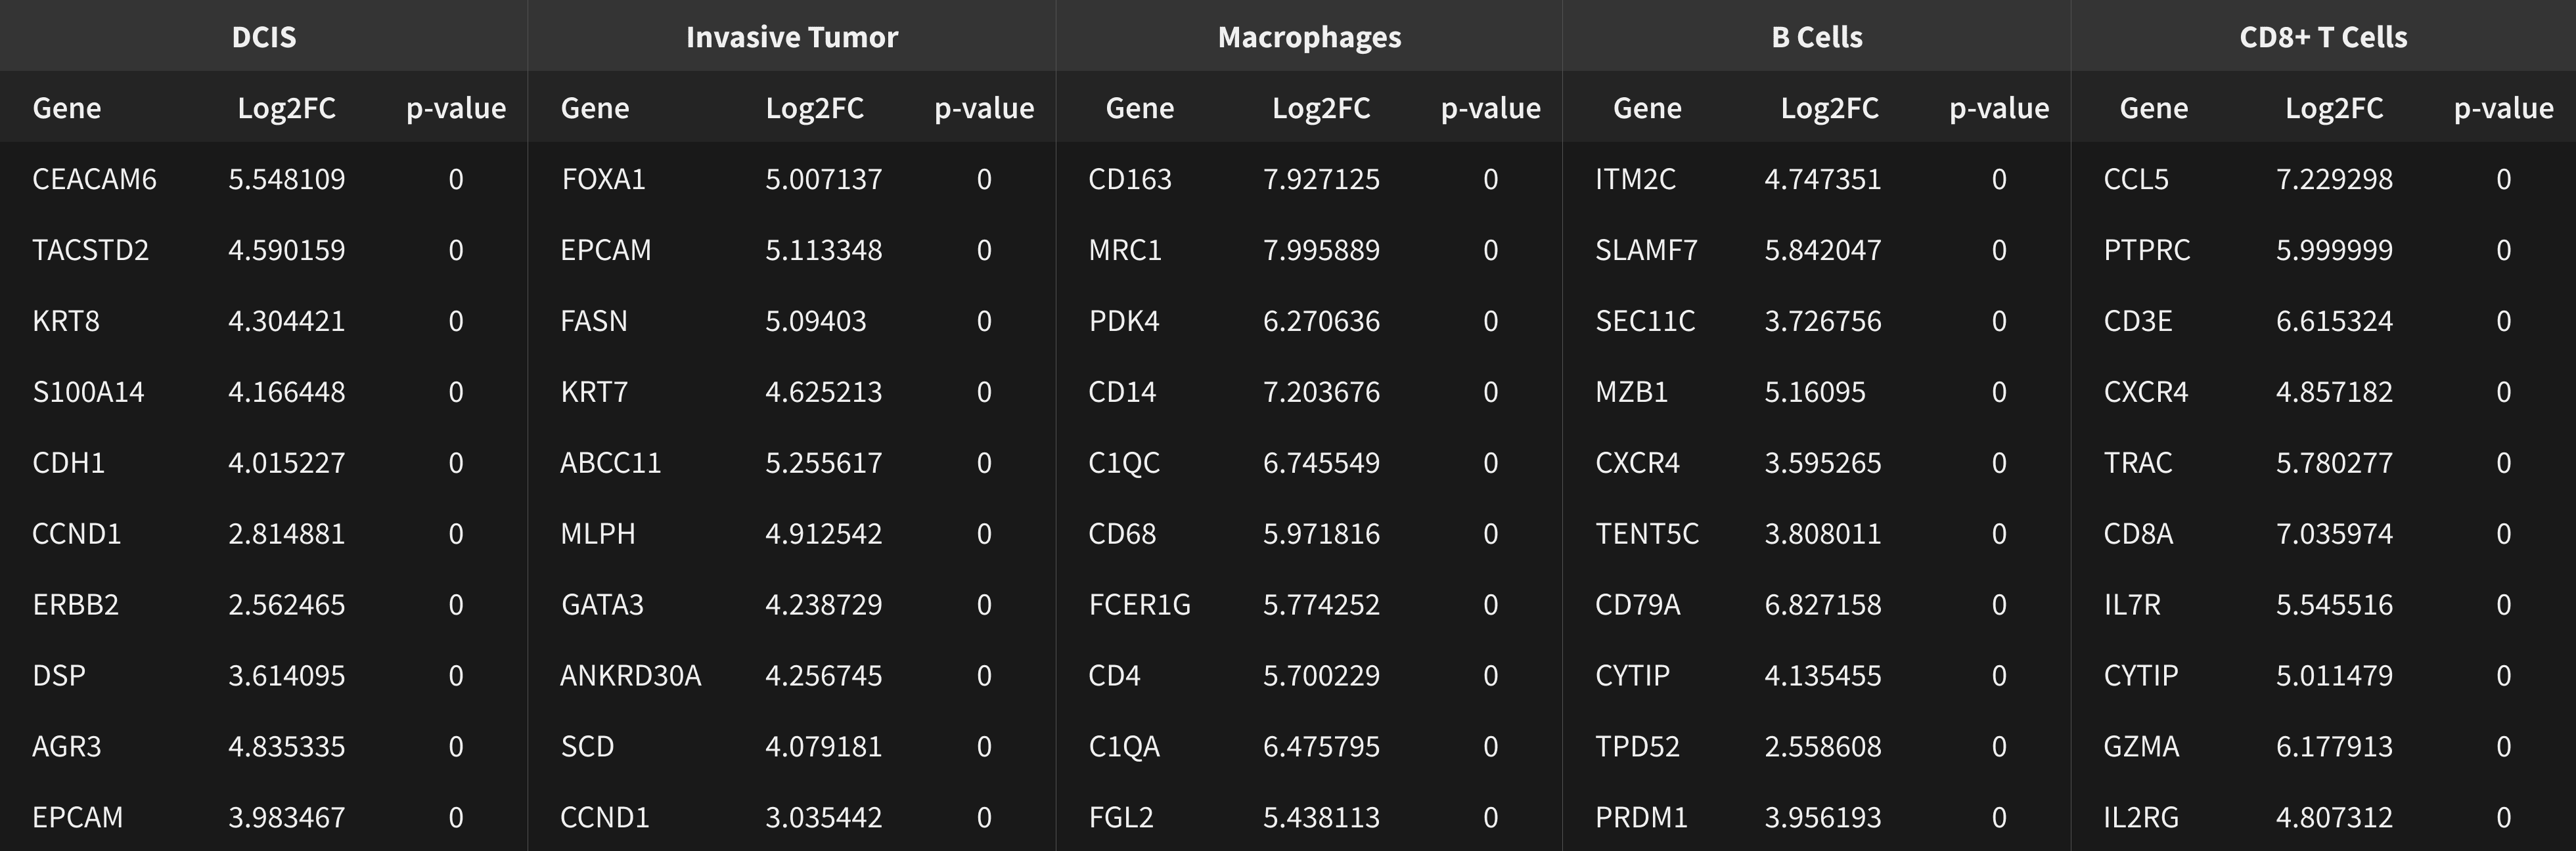
Xenium output can be analyzed in commonly used single cell data analysis software to annotate clusters and/or identify differentially expressed genes.

Top 10 differentially expressed genes in example cell types

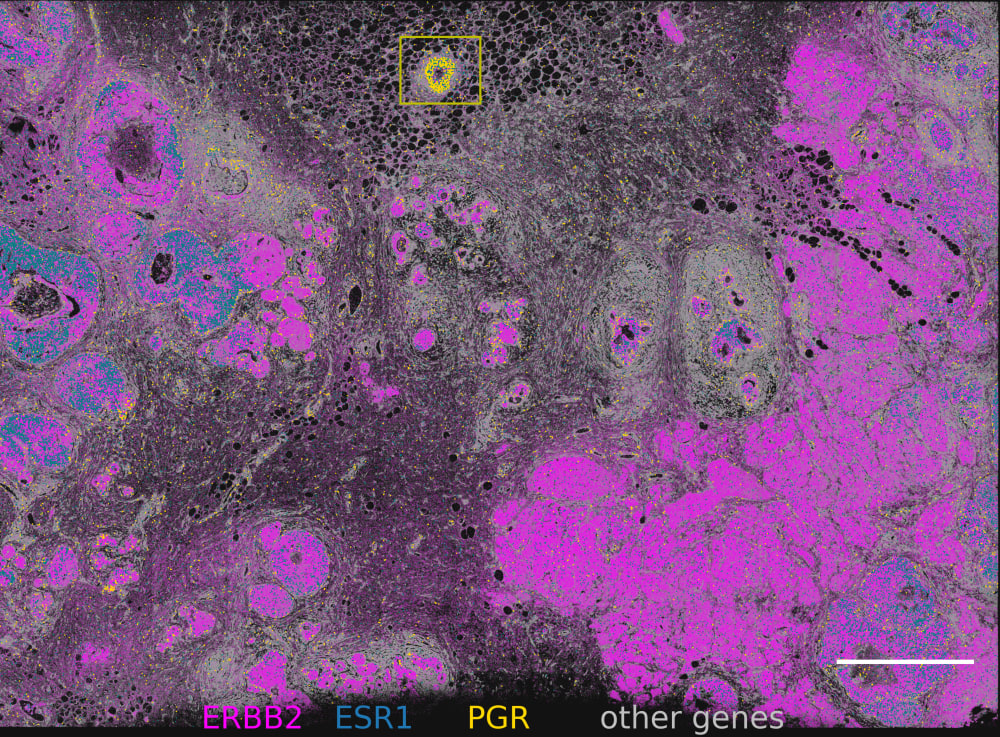
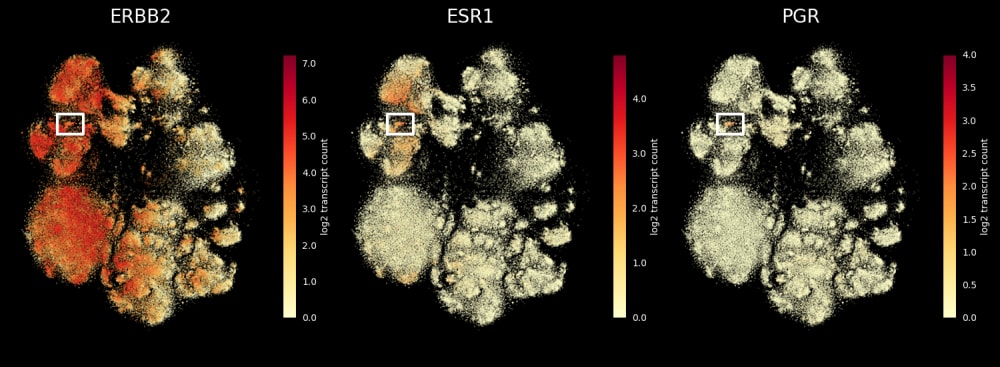
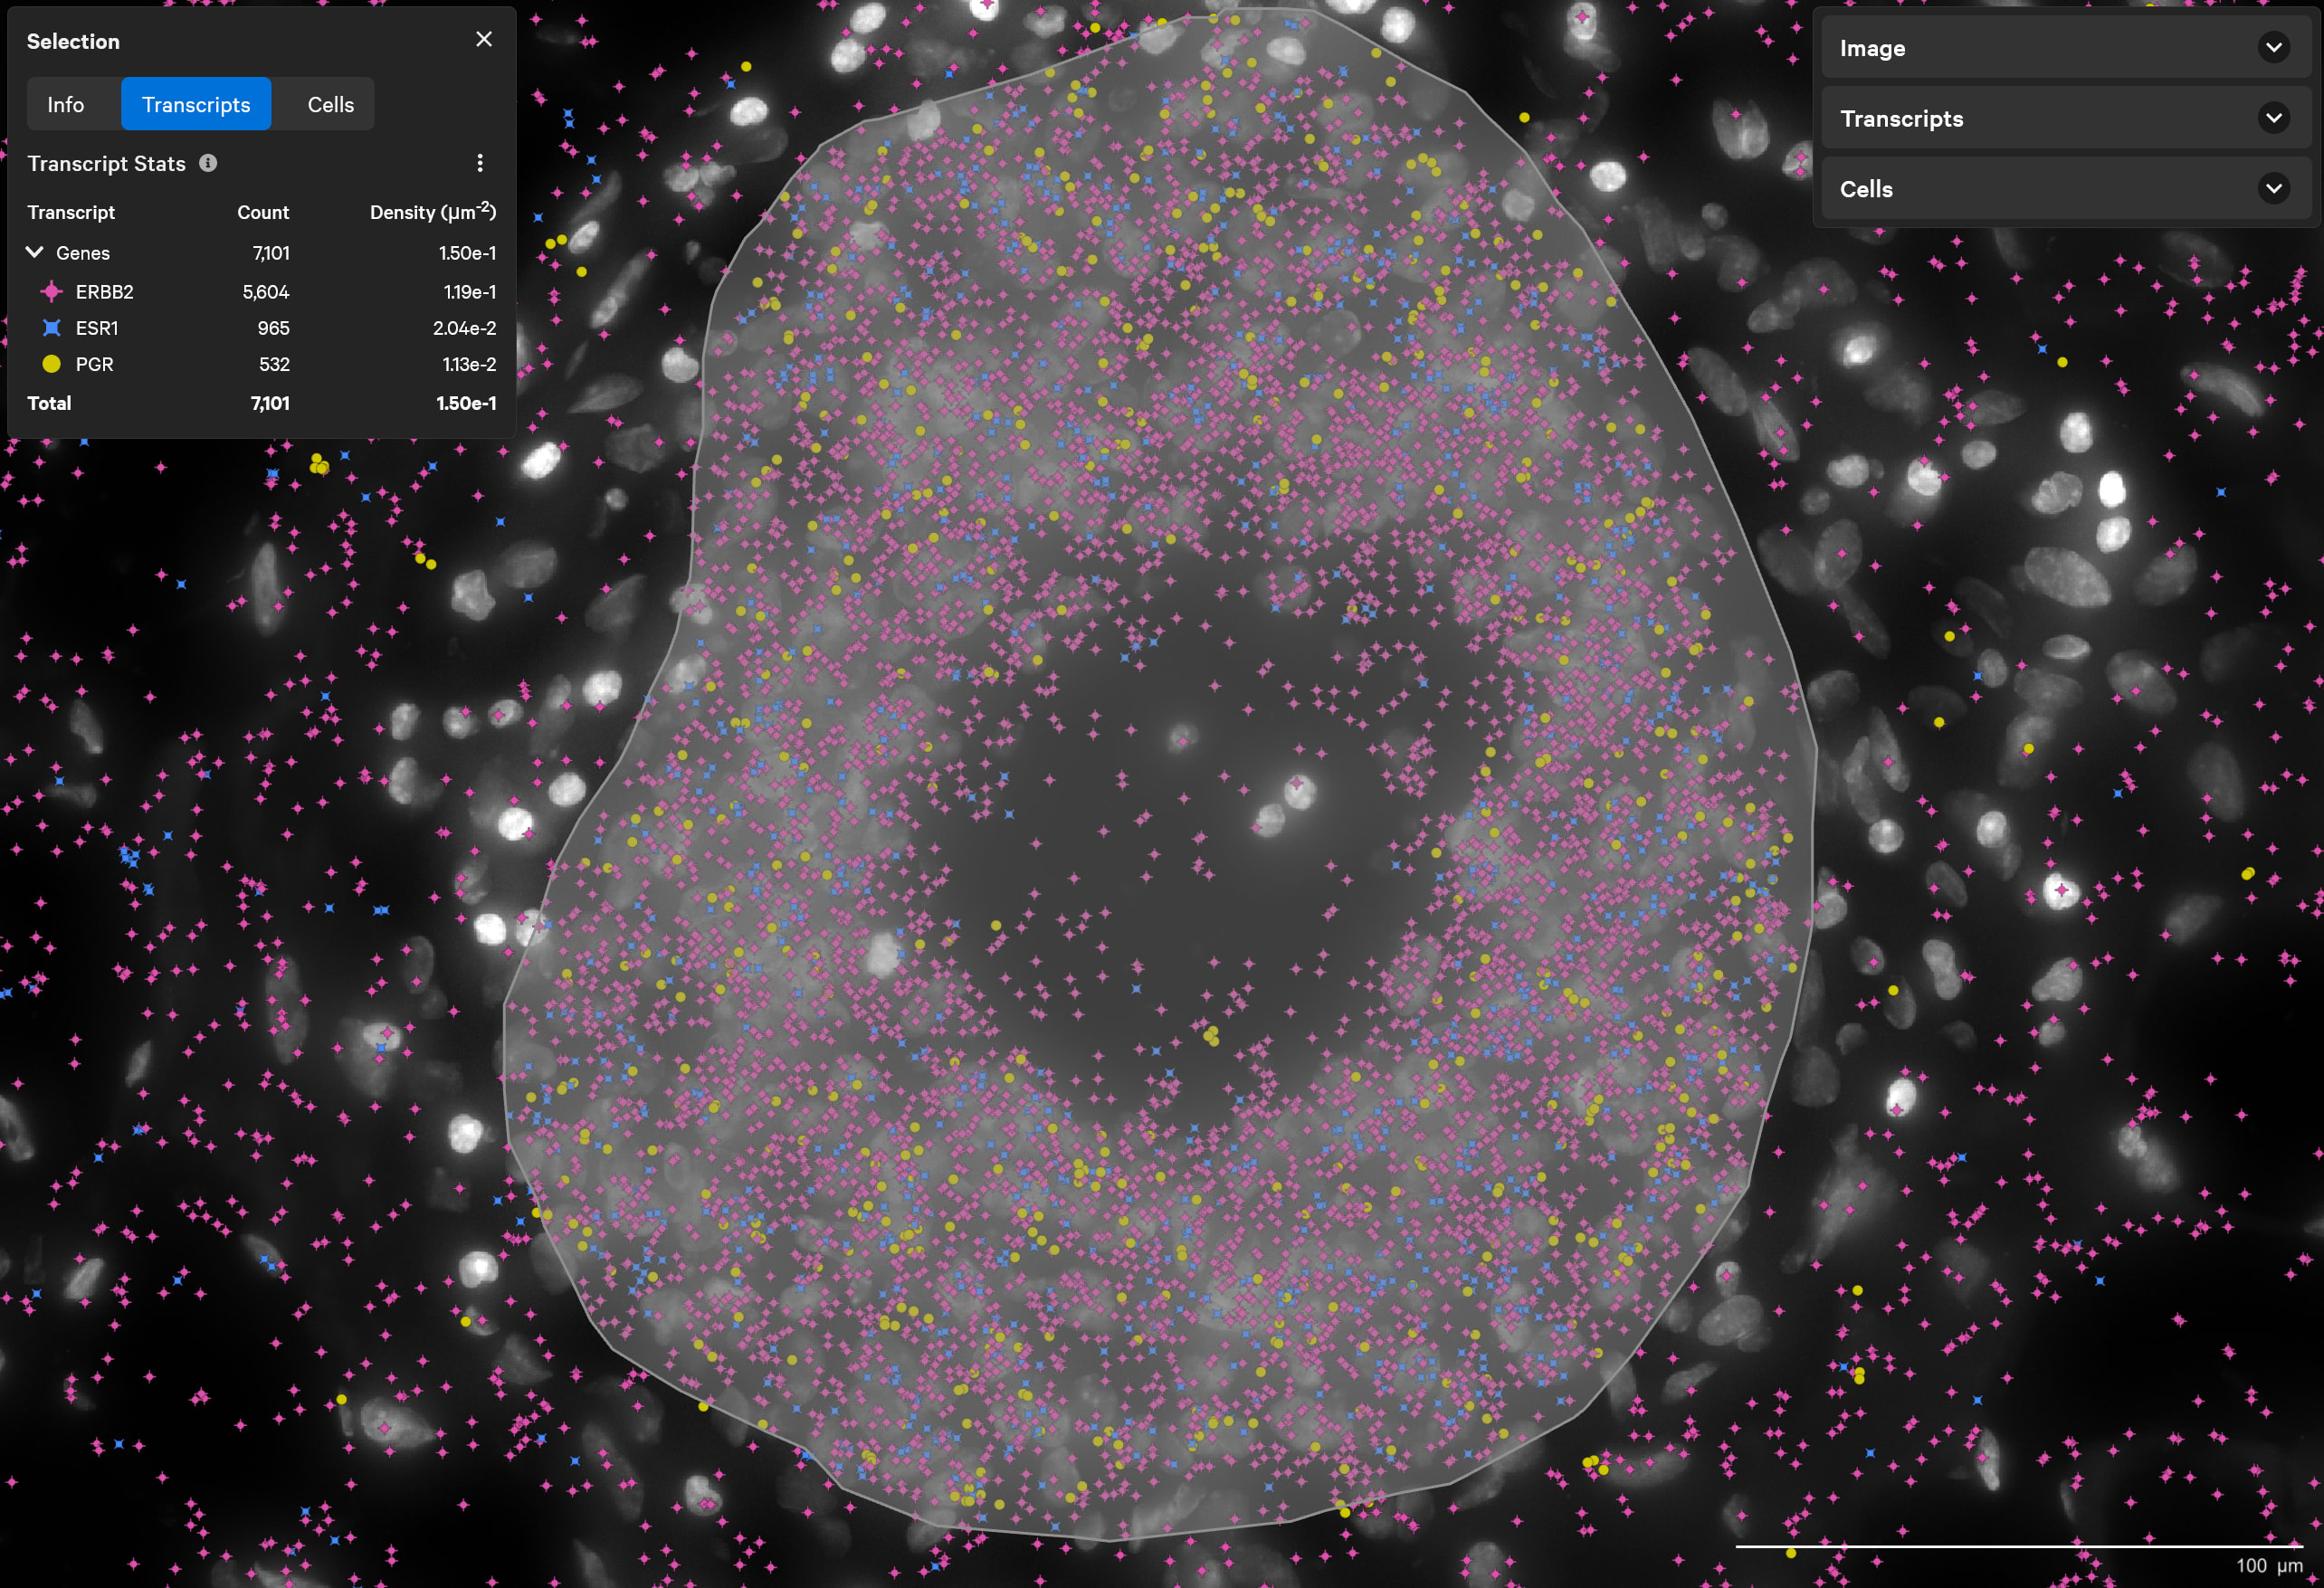
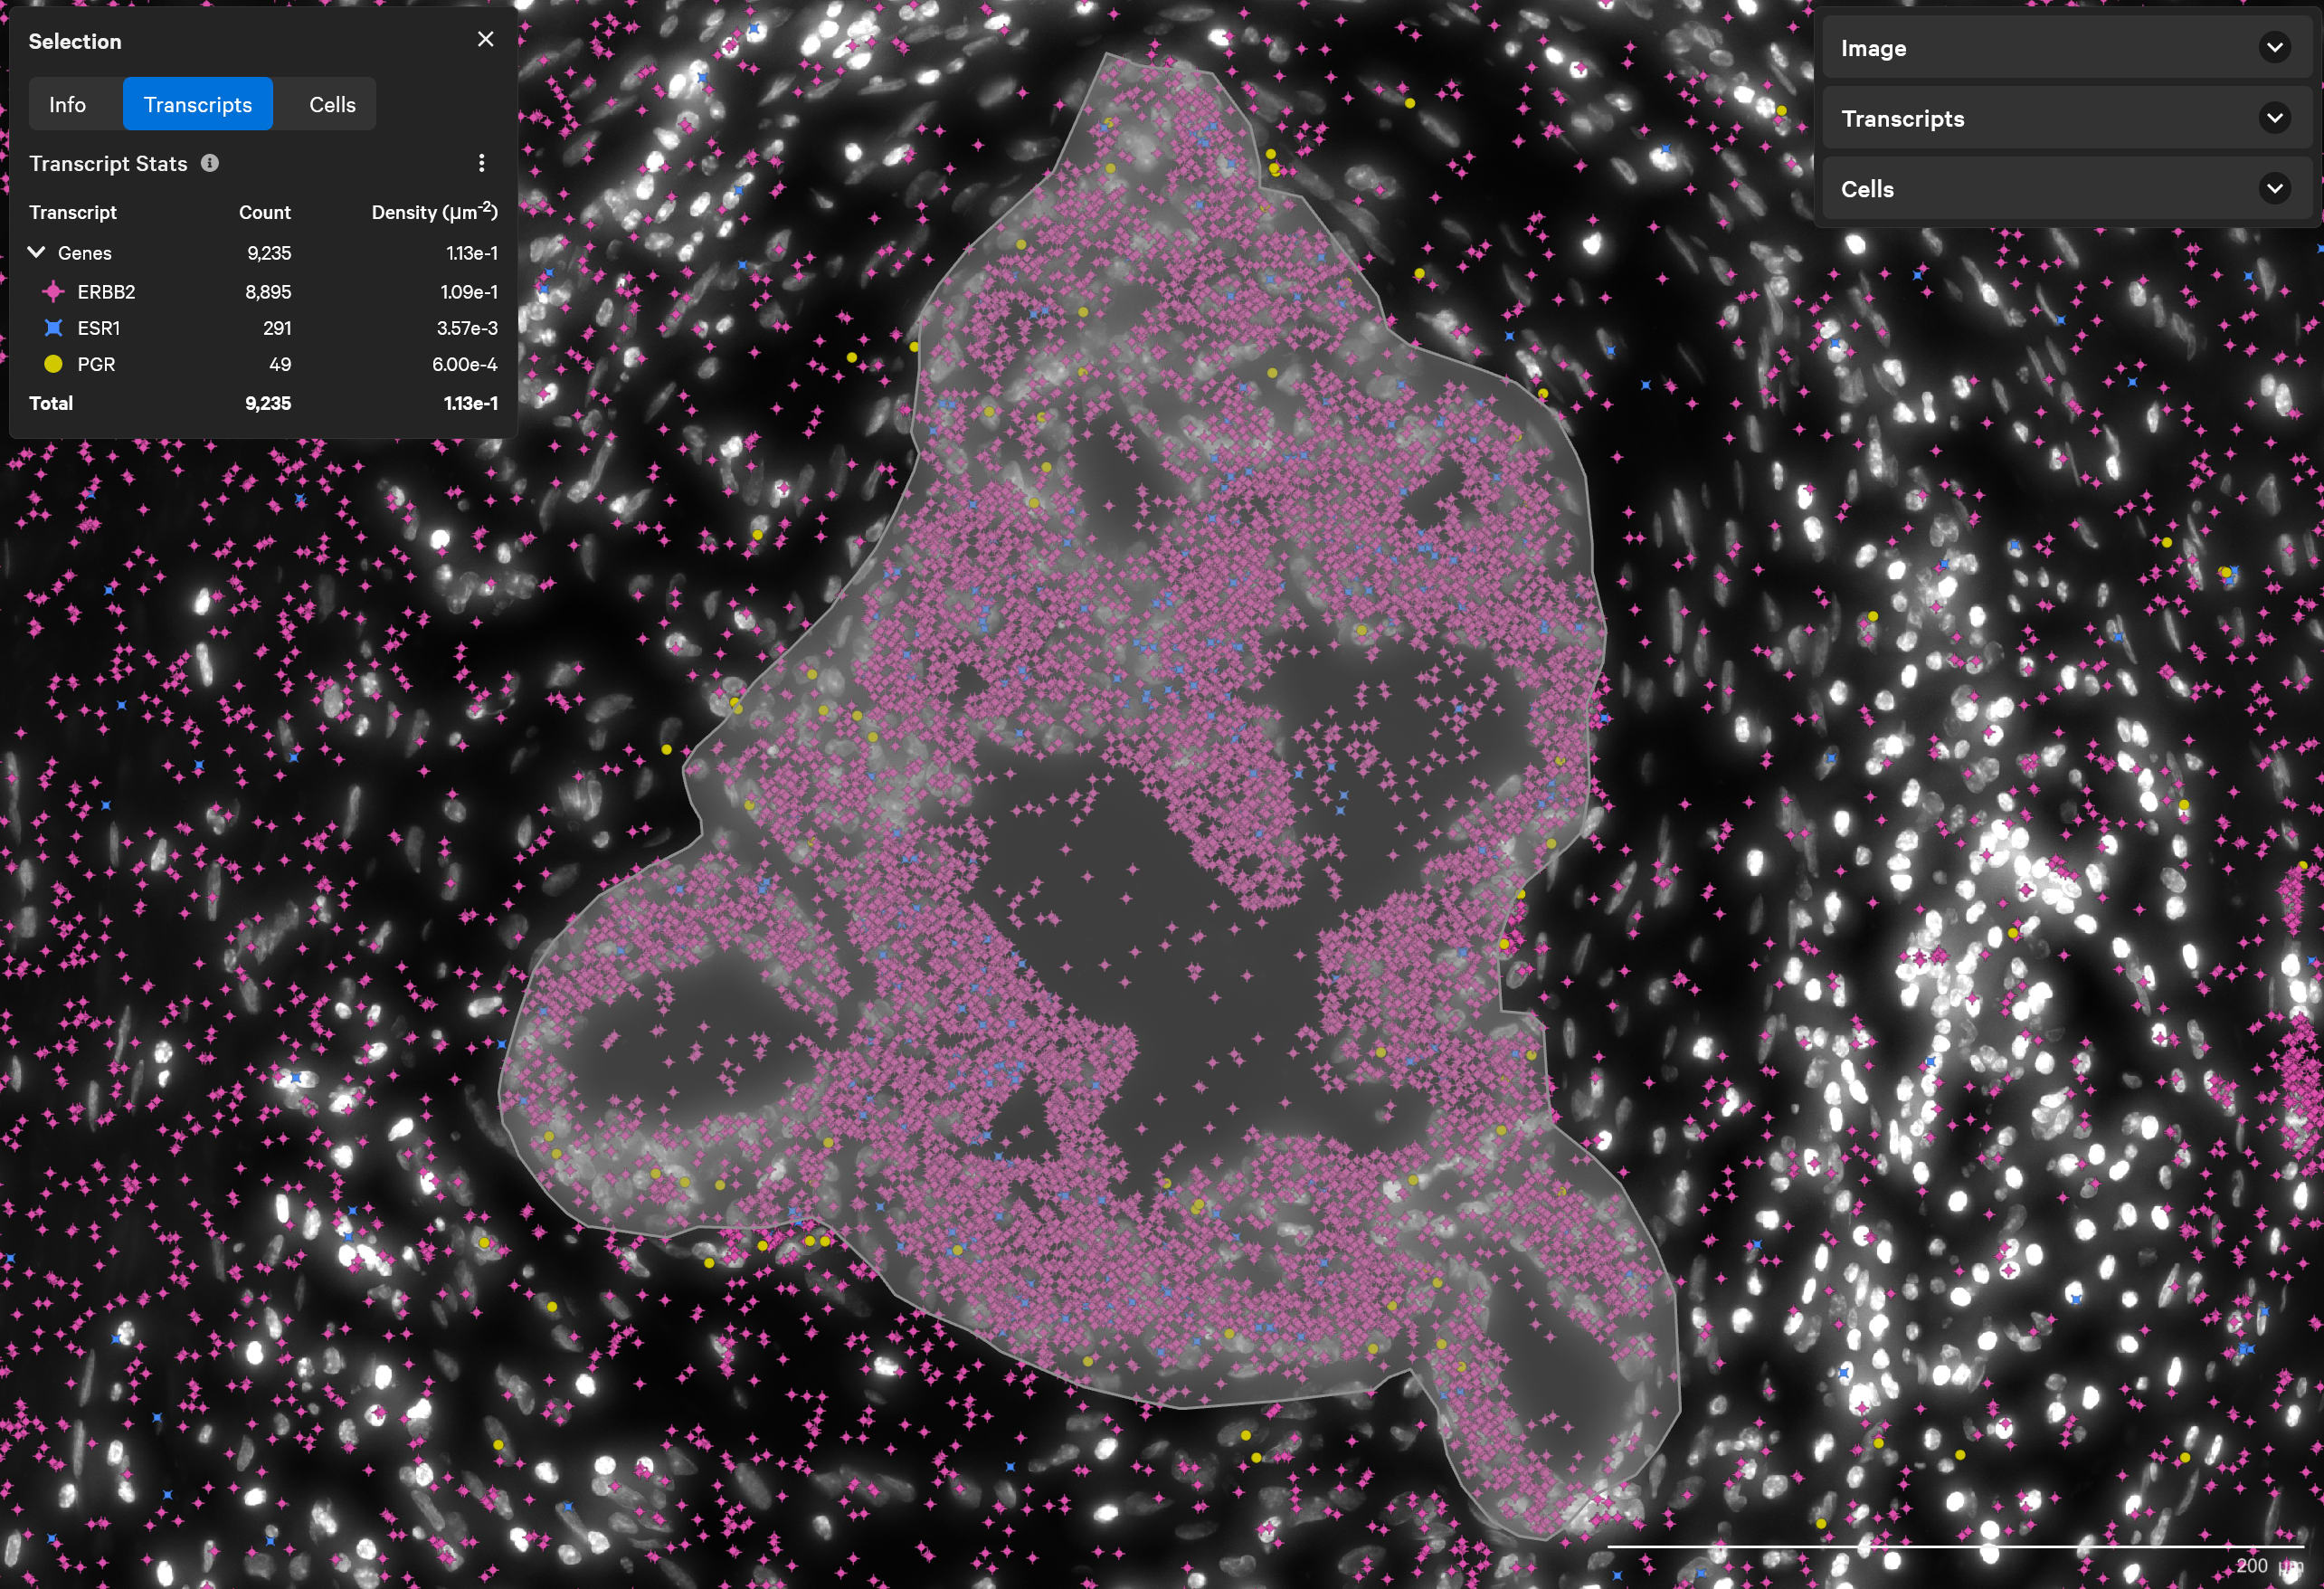
Find triple-positive rare cells

In what is classified as ERBB2(HER2)-positive, ESR1(ER)-positive and PGR(PR)-negative breast tumor, Xenium finds rare triple-positive cells that express all three hormonal receptors.

Transcript view of ERBB2, ESR1, PGR and the rest of gene
Expression level of three genes visualized in tSNE
Transcript view of ERBB2, ESR1, PGR, and other genes. Triple-positive region shown in yellow. Scale bar 1 mm (top). Expression level of three genes visualized in t-SNE. The small population of triple-positive cells are highlighted in white box (bottom).
Triple-positive (ESR1+/PGR+/ERBB2+) DCIS
Double positive (ESR1+/ERBB2+) DCIS
Transcript count and density within the ROI manually drawn using the freehand selection tool in Xenium Explorer. (Top) Triple-positive (ESR1+/PGR+/ERBB2+) DCIS and (bottom) double positive (ESR1+/ERBB2+) DCIS

Explore other Xenium datasets

Mouse Brain Neurobiology
Use Xenium Explorer Demo to explore a Xenium In Situ dataset from a 0.66 cm² fresh frozen mouse brain coronal section using a pre-designed 248-gene Xenium Mouse Brain Gene Expression panel.
Learn about the mouse brain datasets
Xenium In Situ
  • High-performance in situ gene expression mapping
  • Expertly curated and easily customizable content
  • Easy-to-use, high-throughput analyzer
  • Intuitive visualization software
Learn about the platform