Xenium Panel Designer
What is the Xenium Panel Designer?
Order a 10x Genomics pre-designed, off-the-shelf panel or design a custom panel with the Xenium Panel Designer app to perform Xenium In Situ Gene Expression analyses. Combine custom targets with pre-designed panels or build a standalone custom panel for maximum flexibility. Sign in to your existing 10x Cloud account or create a new account to get started today.
Workflow & tutorials
- 1
Start Panel Request
Use the Xenium Panel Designer app to request custom panel designs. First, choose your custom panel design option. Then read the panel design request workflow guide to follow either the standard or advanced workflow.
- 2
Add Sample Info
Tell us about your panel request and enter a design ID if you have one.
- 3
Select Panel Type
Add on to a pre-designed panel or design a standalone custom panel. Select the panel type and number of targets.
- 4
Provide Reference Datasets
Reference datasets are used to predict highly expressed genes that can cause optical crowding. For optimal results, use a dataset that closely aligns with your sample.
- 5
Add Custom Genes
Submit a list of custom genes to request for your custom panel design. Genes should be ranked in priority order from most to least important. In the standard workflow, the panel designer app will clean up the custom genes list and then generate a design for you to review.
- 6
Upload Sequences
For advanced target custom design requests, submit additional sequence information. This is not necessary for standard workflow design requests.
- 7
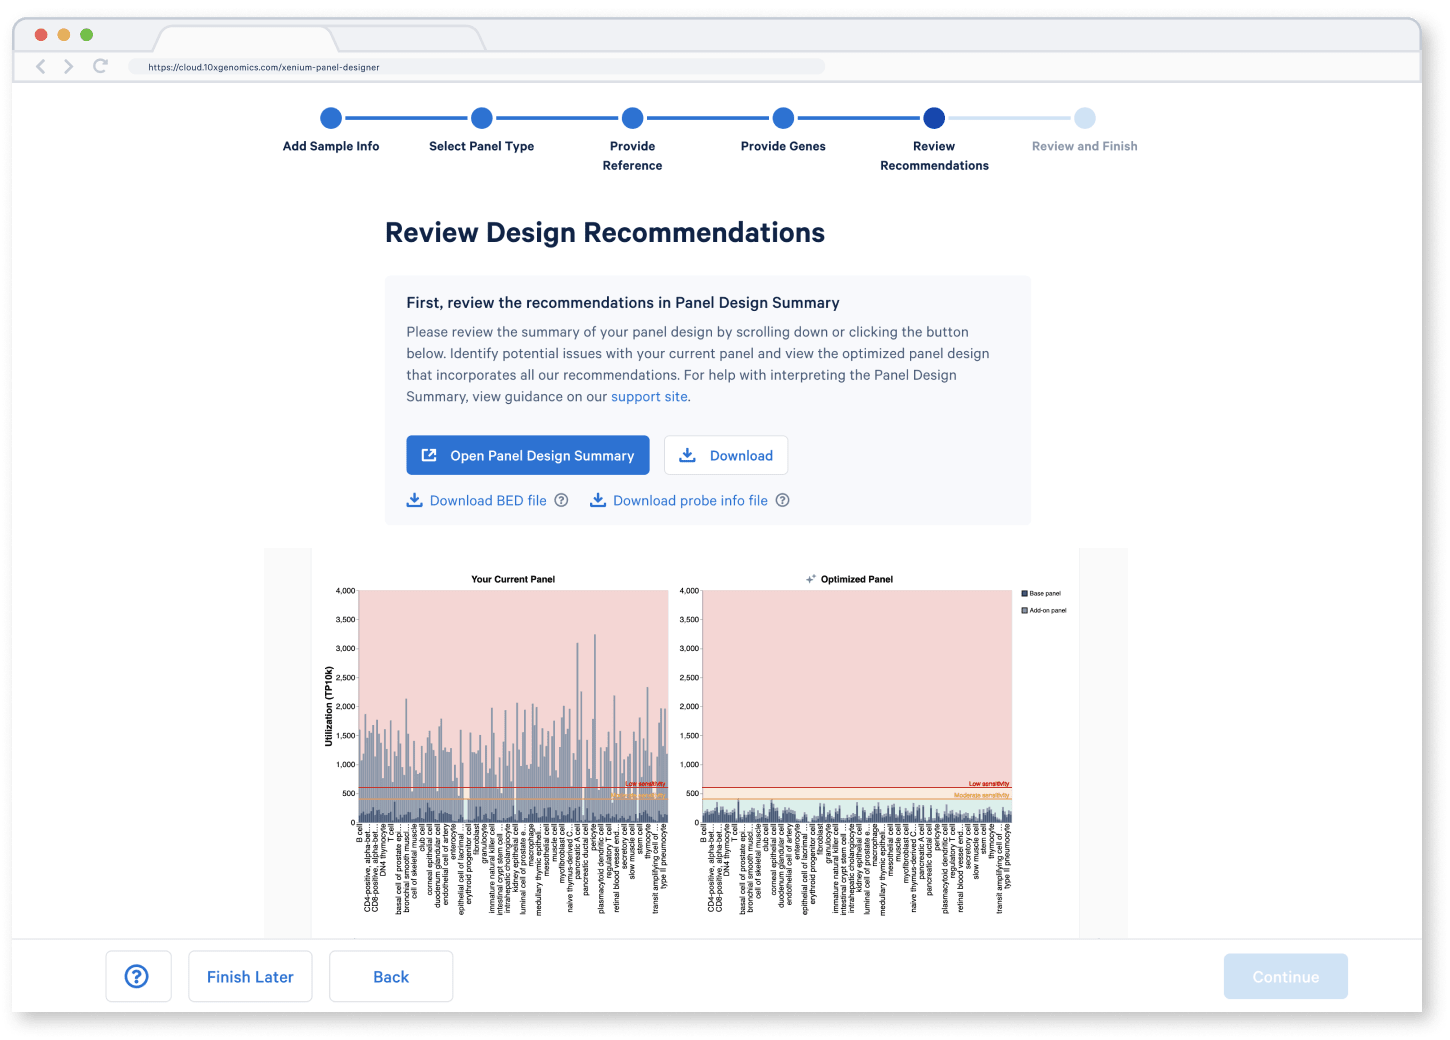
Review Recommendations
Identify potential issues with your current panel and view the optimized panel design that incorporates all our recommendations.
- 8
Review and Finish
If satisfied with the design, finalize to complete request. Please note that after designs are finalized, no further changes can be made to your panel design.
Q&A
Find answers to frequently asked questions about design ID, custom designs, and reference data.
Release Notes
We regularly add new features to the 10x Genomics Xenium Panel Designer. Find details about the updates and improvements on this page.
Datasets
Access free, publicly available data generated with Xenium In Situ Gene Expression solutions.