- Learn how to find subgroups within broader cell types and larger clusters based on the expression levels of marker genes.
- Learn how to modify subgroups with manual selection.
Loupe Browser allows you to create cell subgroups, both via expression filtering and by manual selection. We will use both techniques here to identify substructure within B cells (CD79A/CD79B) using the lung squamous cell carcinoma tutorial dataset.
We will use two B cell markers, CD79A and CD79B, to identify and filter B cells in this dataset.
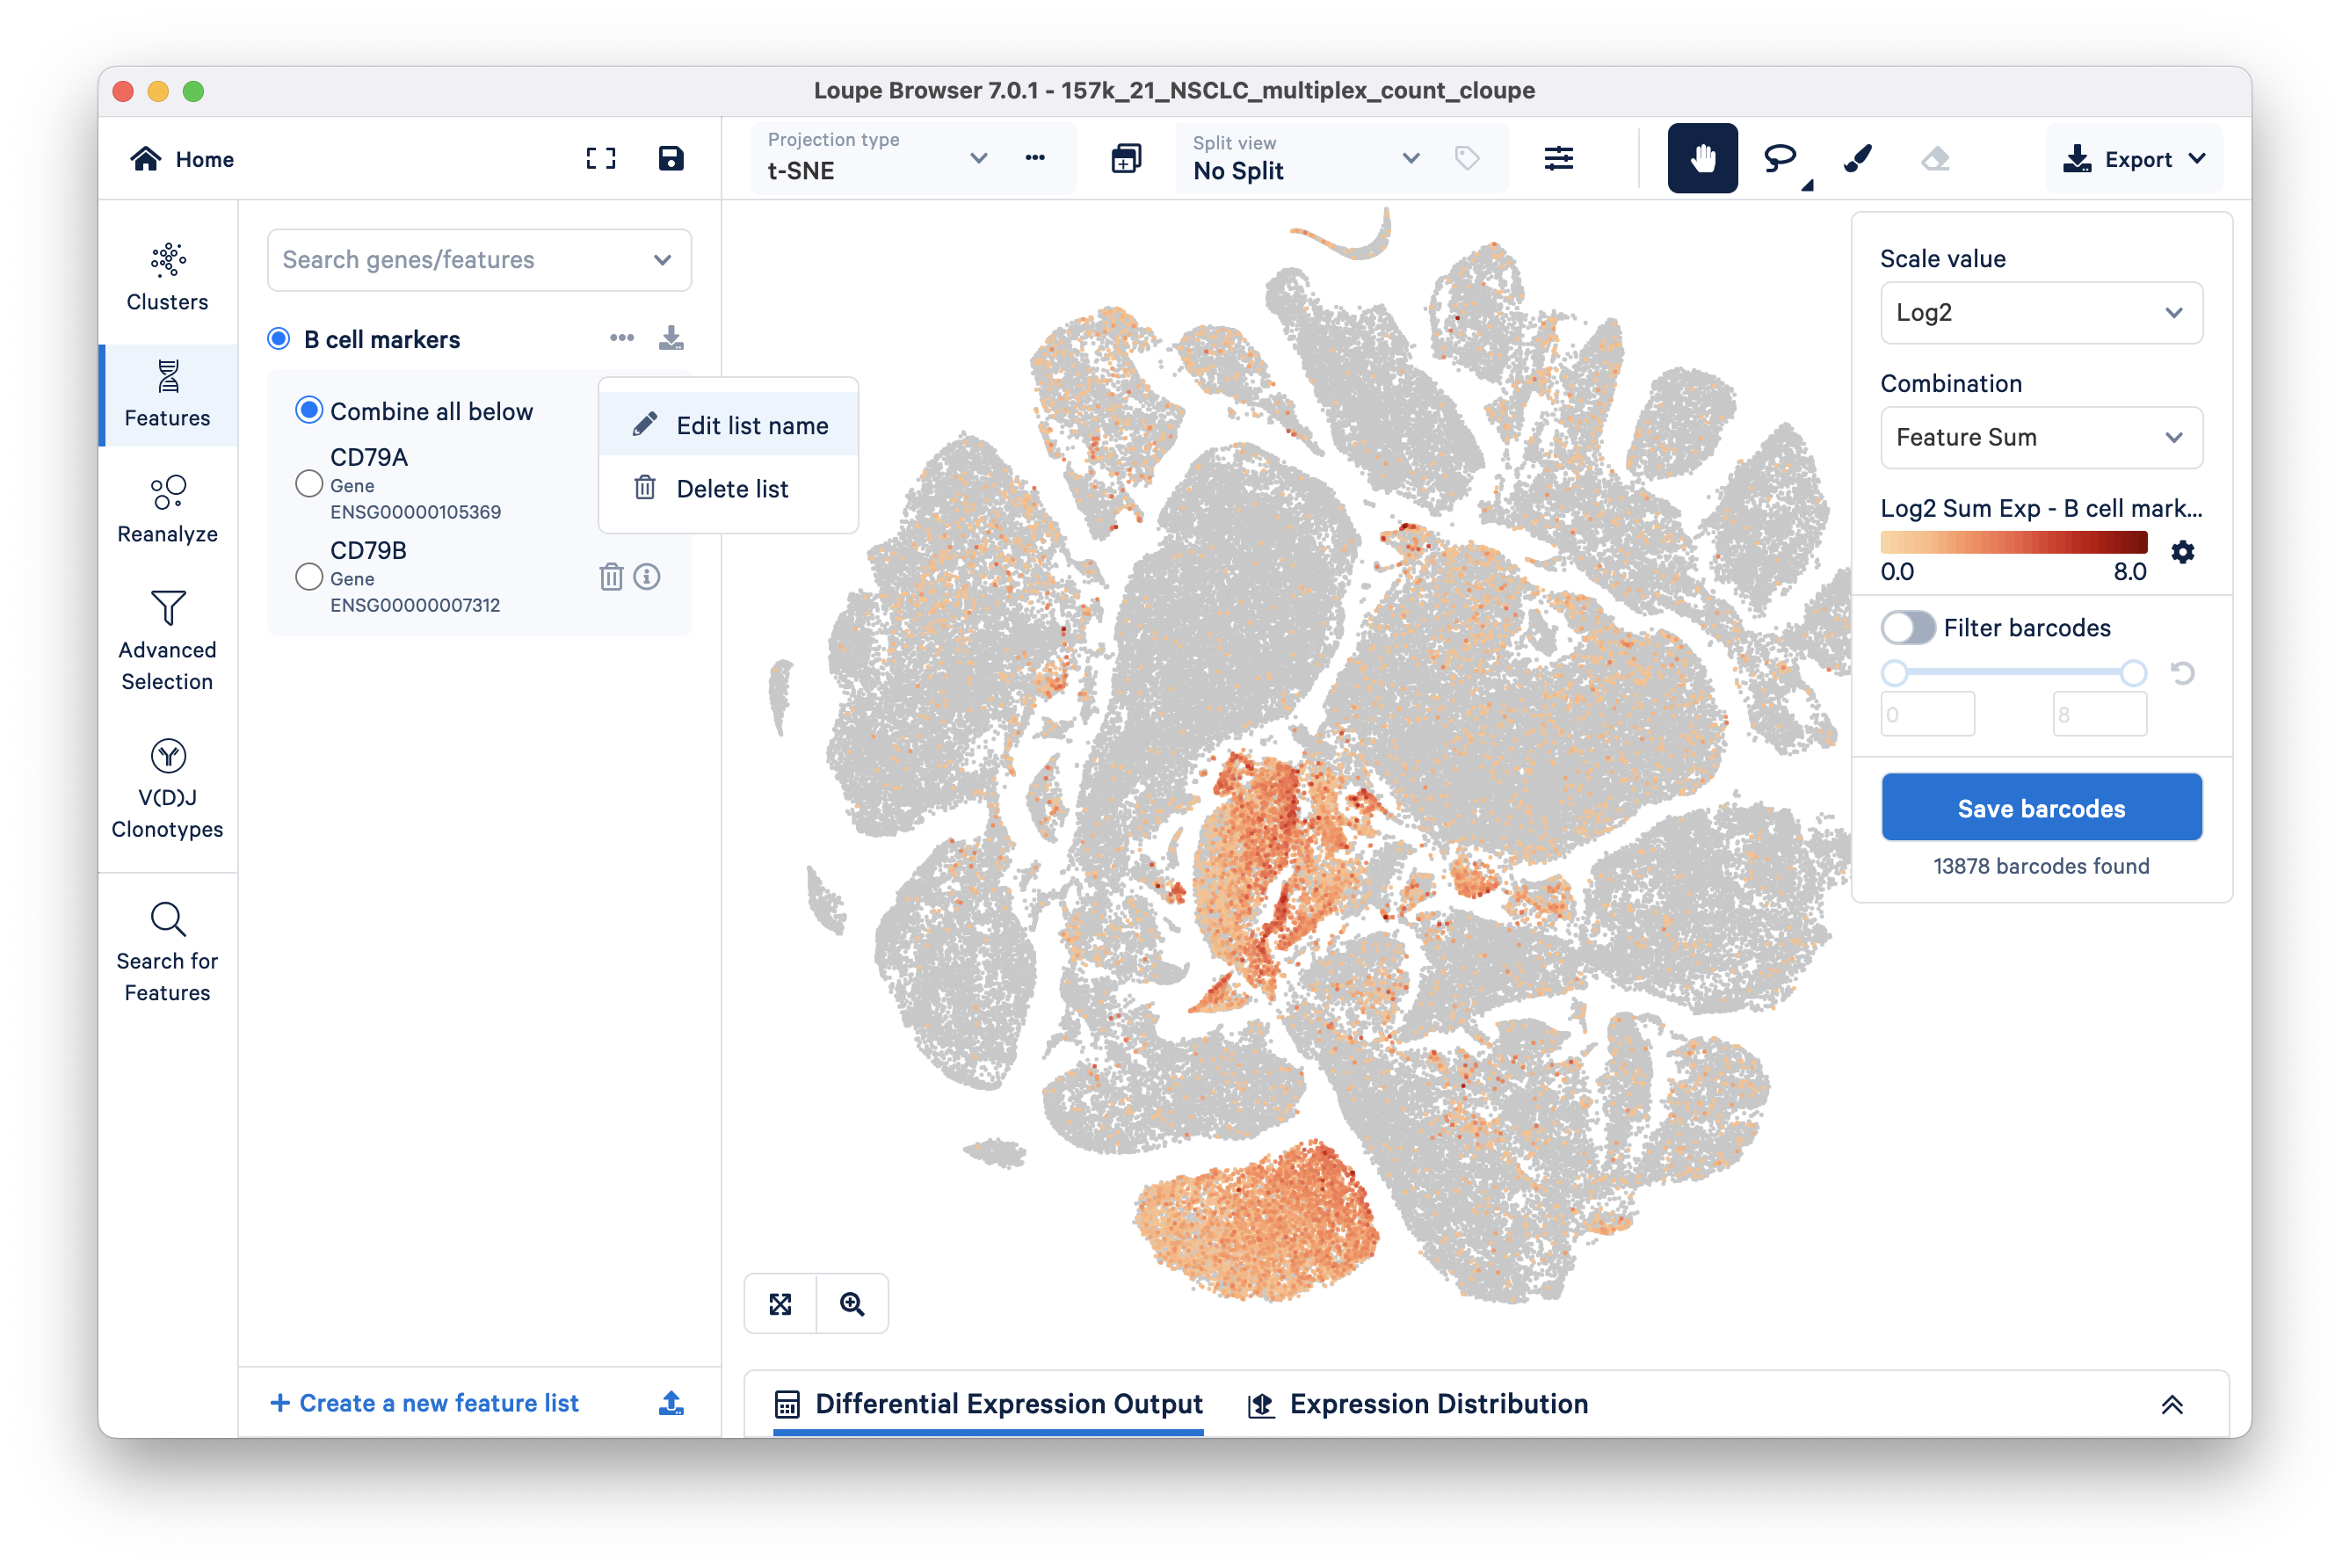
In the Features mode, search for 'CD79A' by typing in the 'Search genes/features' box at the top. Clicking on the gene name in the search results should add this feature to the Untitled List (default). Repeat this step for 'CD79B', then rename the Untitled List to something more informative, e.g., B cell markers as shown here:
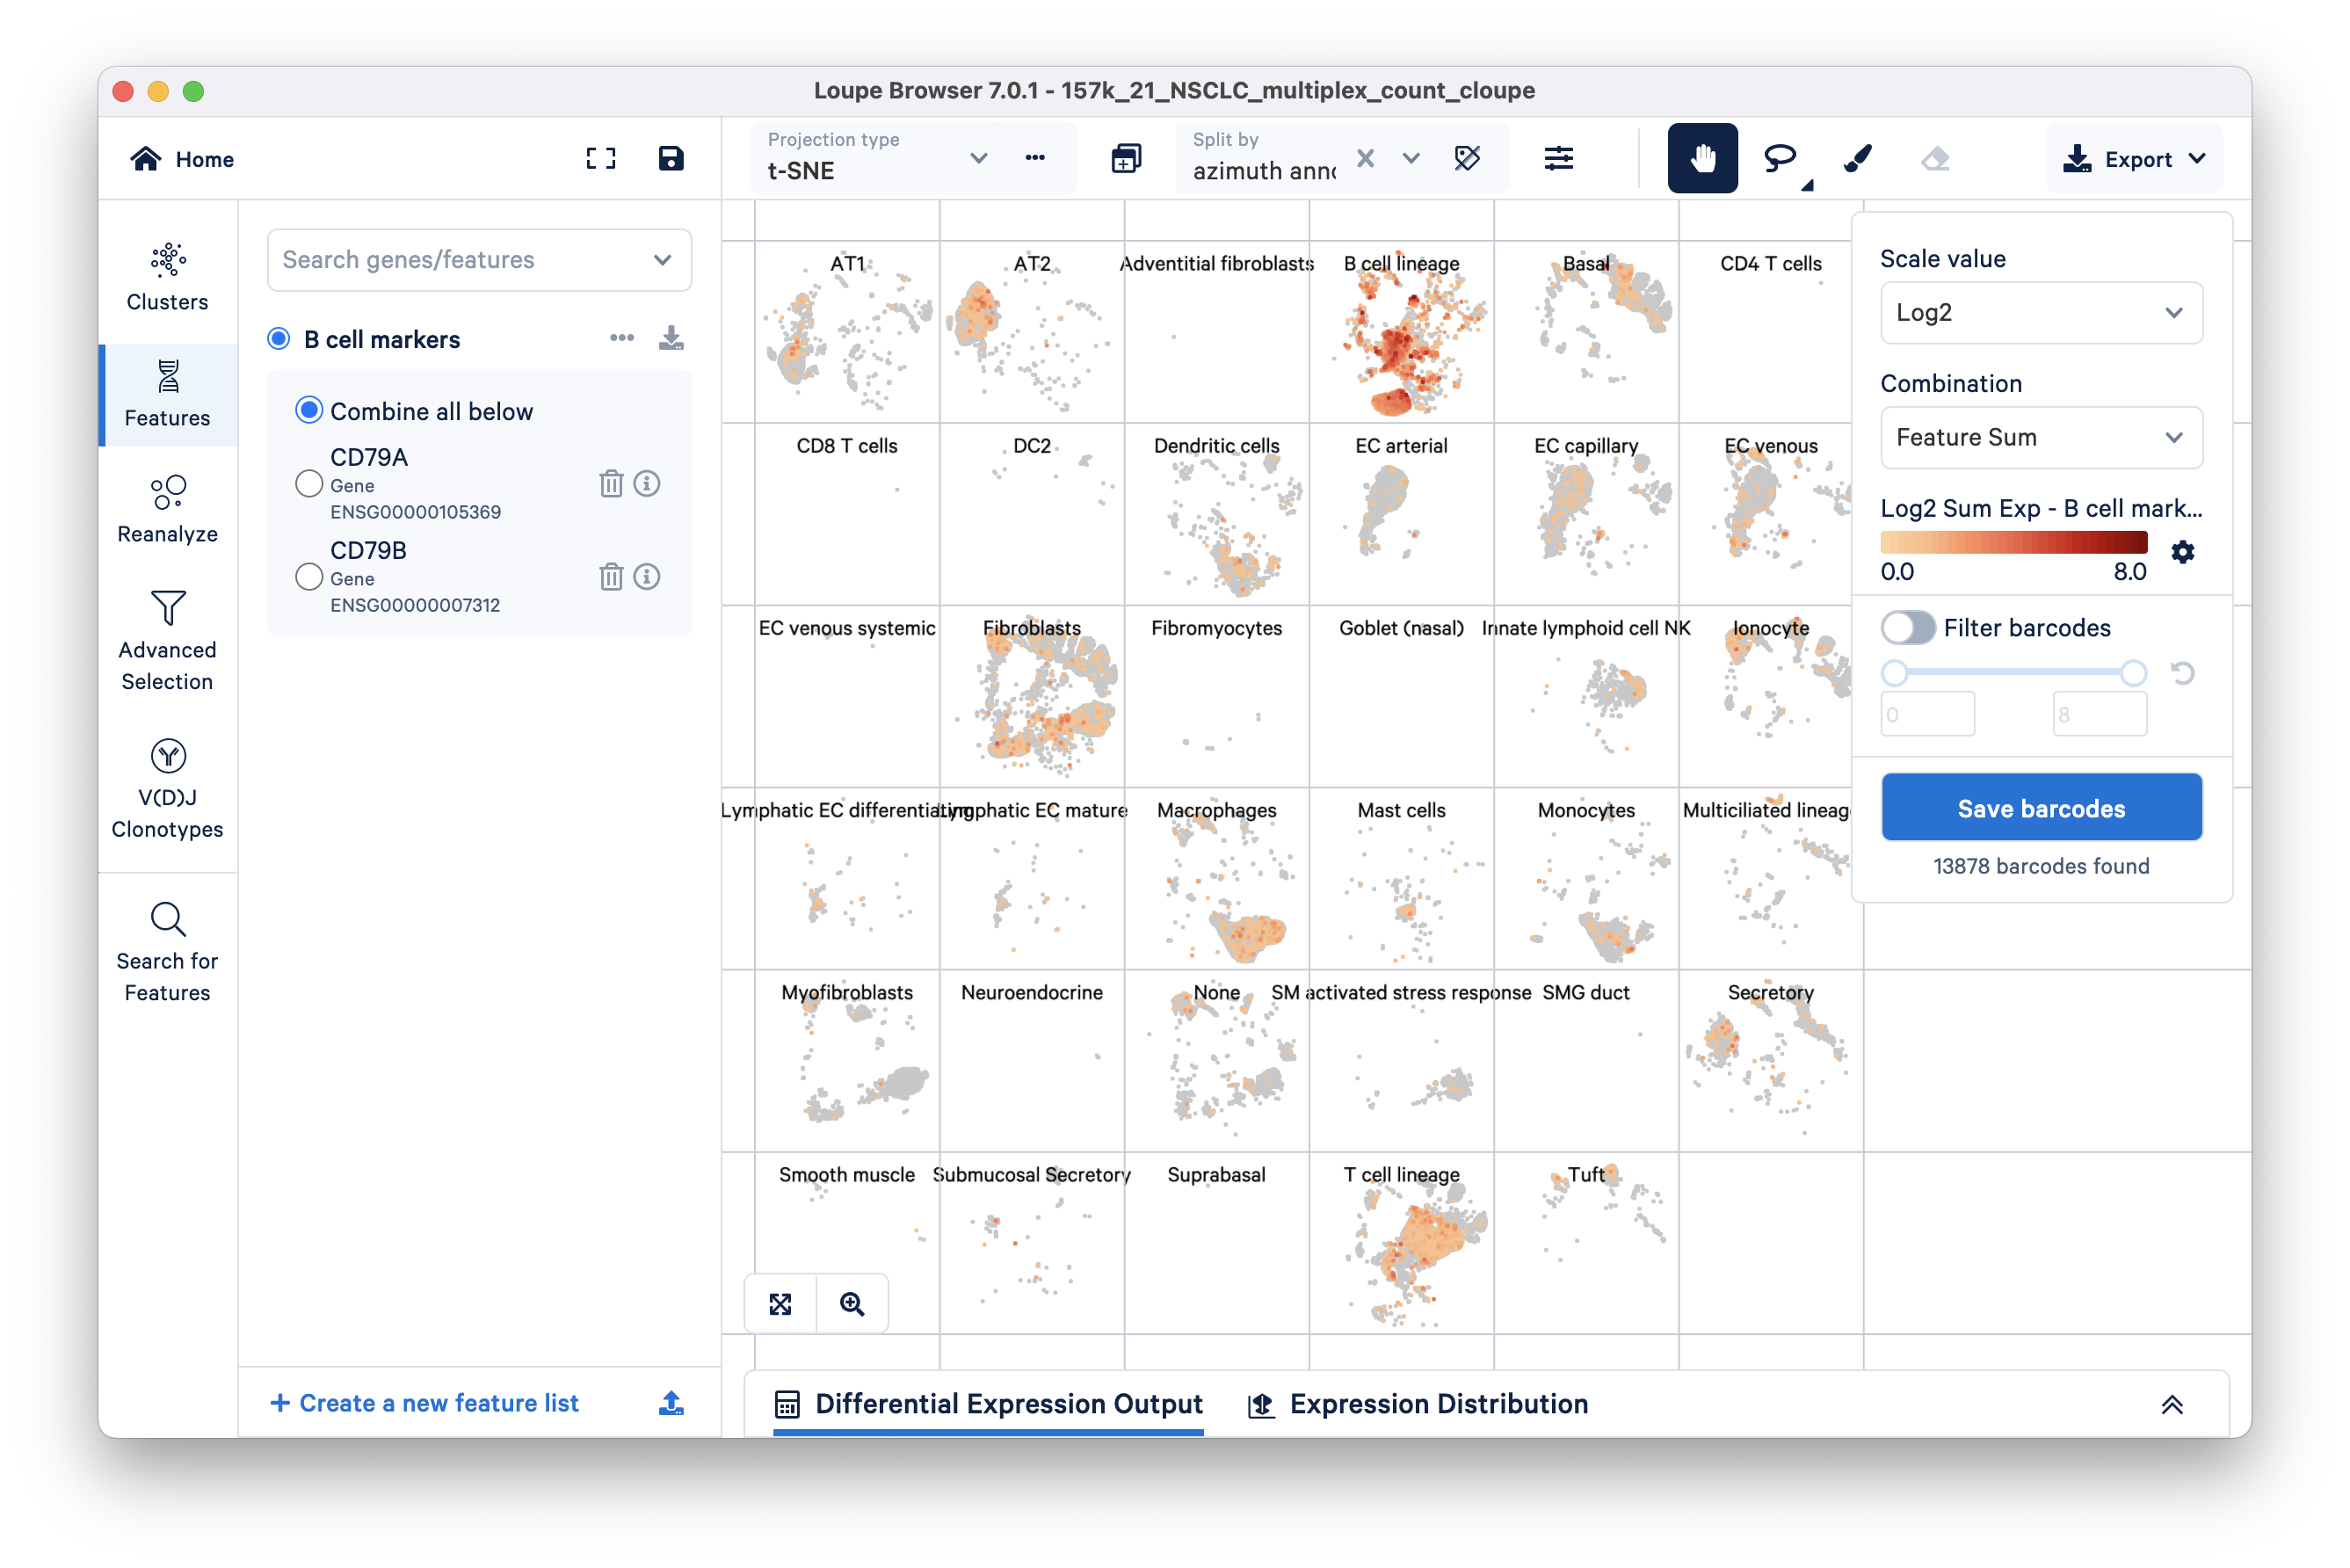
We can compare barcodes expressing these B cell markers to the Azimuth annotations embedded in this tutorial dataset by selecting 'azimuth annotations' in the Split by drop down located at the top of the t-SNE. As expected (image below), the barcodes in the B cell lineage have high expression of the CD79+ markers. However, there is some signal in the other groups as well (e.g., fibroblasts, T cells).
We can filter for barcodes that have higher than a set range of expression values by turning on the Filter Barcodes toggle on the right side. Use the sliding scale to set a threshold; in this example, setting the minimum to 3 (range 3-8) appears to mostly retain barcodes corresponding to the B cell lineage group. Note that the expression values here correspond to Log2 transformed UMI counts per the scale value selected and we are looking at the sum of the genes in our Untitled list per the Combination method selected (Feature Sum is the default).
Click the blue Save Barcodes button (below the filtering option), name the selected cluster 'B cell markers', and make a new group called 'All B cells'. Clicking the Finish button should take you back to Clusters mode, where there is now a new group called 'All B cells'.
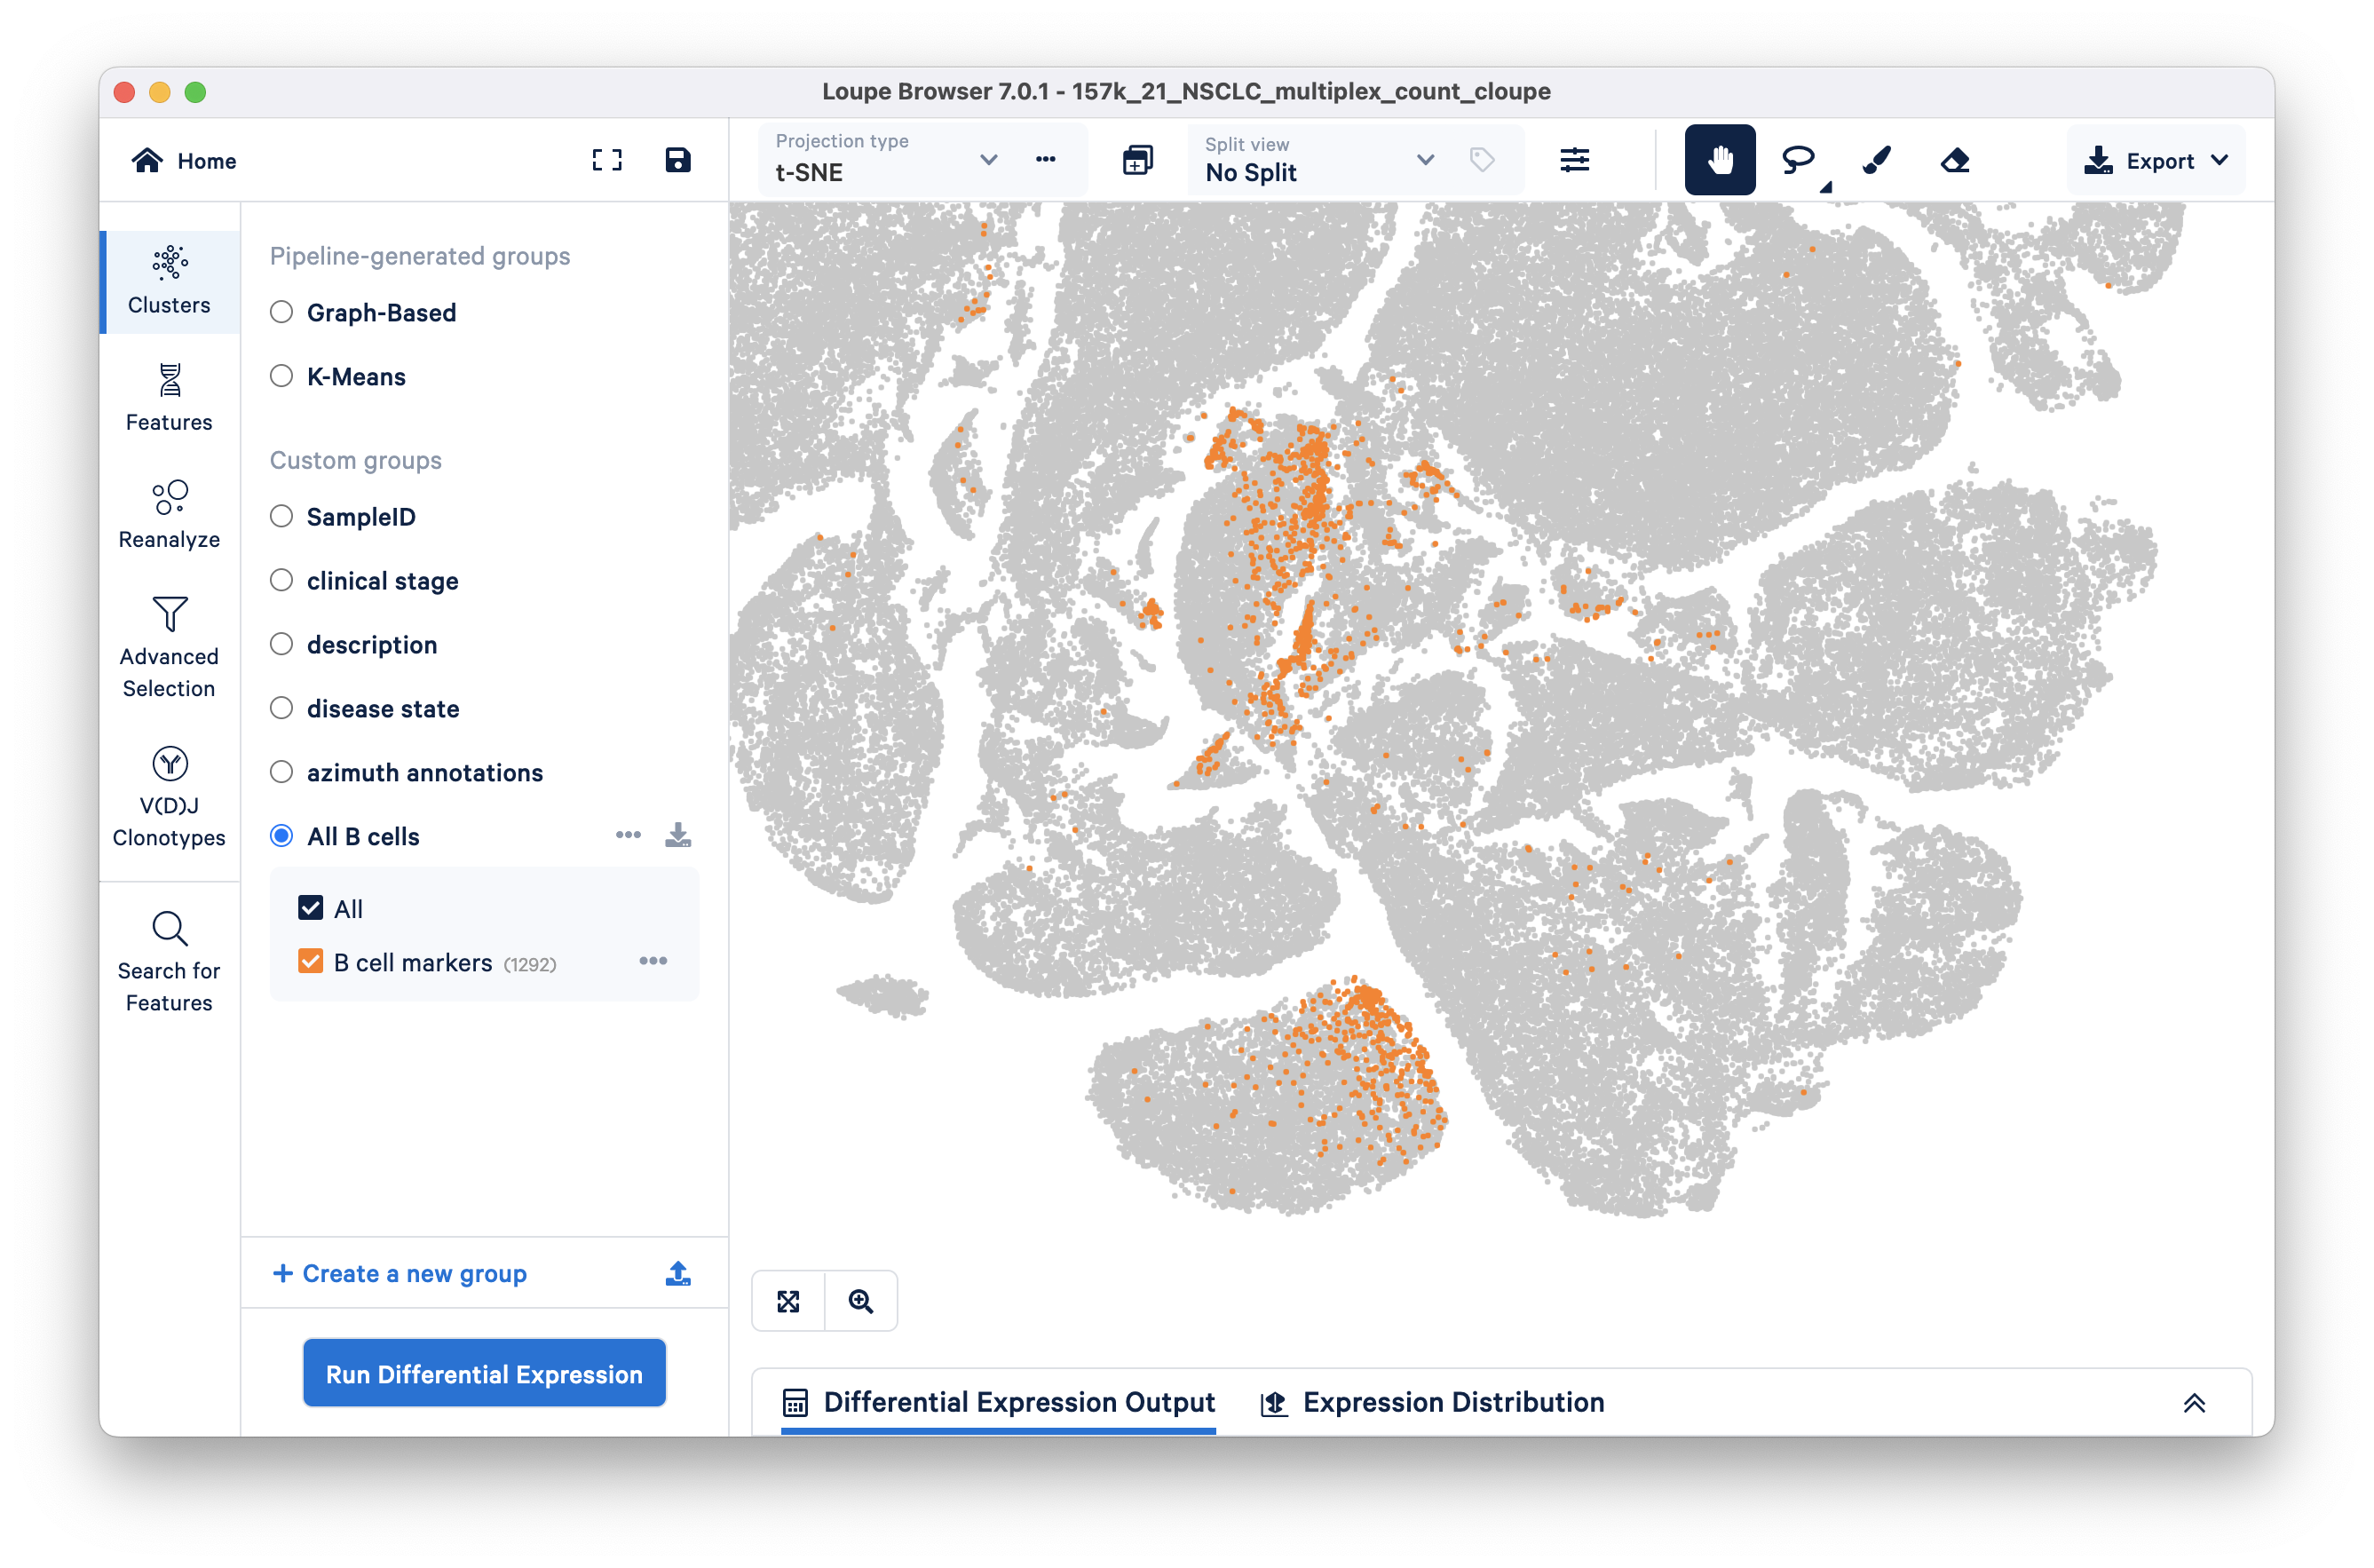
Clear the split view (click on the x next to the drop down) to see where the B cell marker group falls in the t-SNE. It looks like there are at least two broad subclusters within the "All B cells" group.
To compare these two main subclusters in the B cell population, we will first define custom cluster boundaries (visually) using the freehand selection tool and remove any barcodes that lie outside.
Split the t-SNE by B cell markers and then click on the Lasso/rectangle selector ![]() drop down to choose the freehand selector tool.
drop down to choose the freehand selector tool.
Use the freehand selector to define the two main clusters and call them B cell cluster 1 and B cell cluster 2 (shown in this video):
We can now easily exclude barcodes outside these two custom-defined clusters.
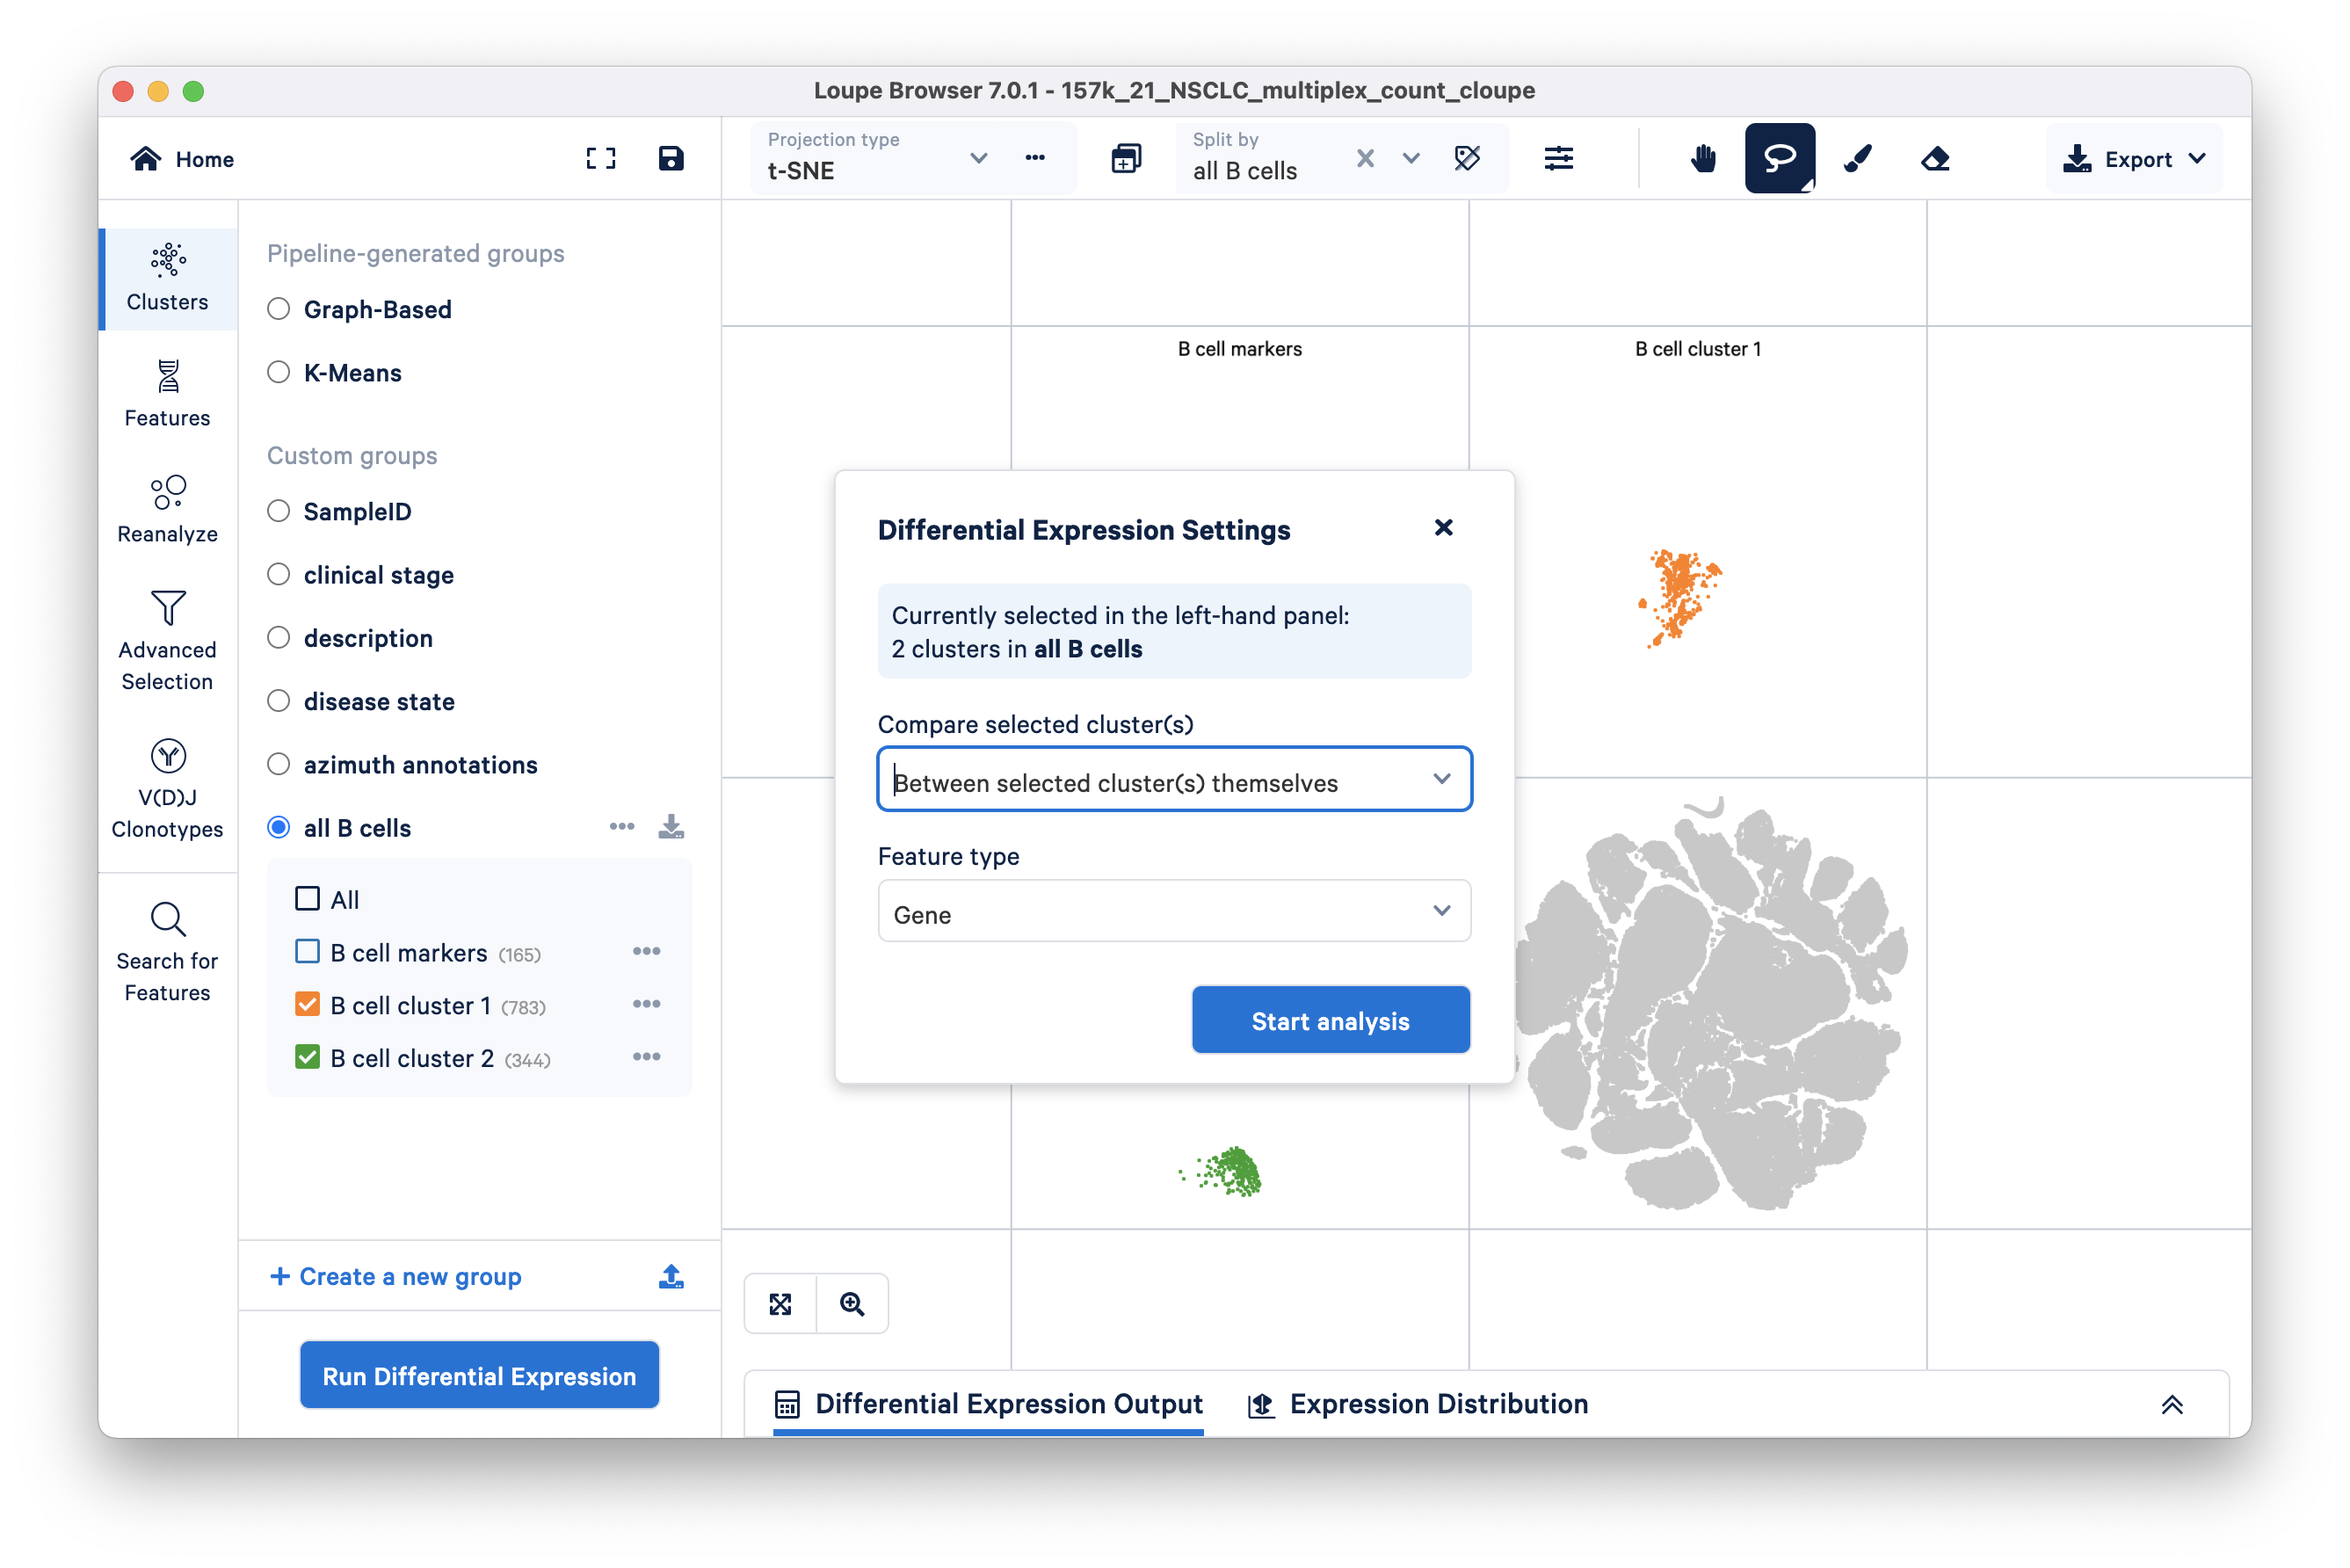
After defining the subclusters, you can perform differential gene expression analysis specifically on these subclusters by unchecking the B cell markers cluster and clicking Run Differential Expression. Be sure to compare between selected clusters.
Go to the next tutorial to see what insights can be gained by identifying cell subtypes within this group.