The import-segmentation pipeline allows you to specify new 2D nuclei and/or cell segmentation results from community-developed tools and recalculate all Xenium Onboard Analysis (XOA) outputs that depend on segmentation.
The input files for import-segmentation are:
- The Xenium output bundle generated by the Xenium Onboard Analysis pipeline (see Input overview).
- Segmentation file(s) from community-developed tools (see compatible formats for examples). Xenium Ranger supports importing 2D segmentation results.
The xeniumranger import-segmentation command line arguments are listed on the Xenium Ranger command line arguments page. There are separate command line arguments for Baysor inputs due to differences in how it generates segmentation results.
Here are examples for importing segmentation results from community-developed tools. Make sure to edit the paths to input/output files in the examples below.
Generate polygon segmentation results in GeoJSON format (i.e., from QuPath) and then import:
polygon.geojsoncontaining GeoJSON polygons- Note: we recommend including nucleus segmentation when running cell detection so both nucleus and cell segmentations are in one GeoJSON file (default export format for QuPath), with nucleus segmentations named
nucleusGeometry. - Features where
object_typeis notcellwill be ignored (i.e.,annotations).
Example to import nucleus and cell segmentation using a single GeoJSON that contains both:
# Note: the --cells argument must be run with the --nuclei argument
xeniumranger import-segmentation --id=polygon-demo \
--xenium-bundle=/path/to/xenium/files \
--nuclei=polygon.geojson \
--cells=polygon.geojson \
--units=pixels
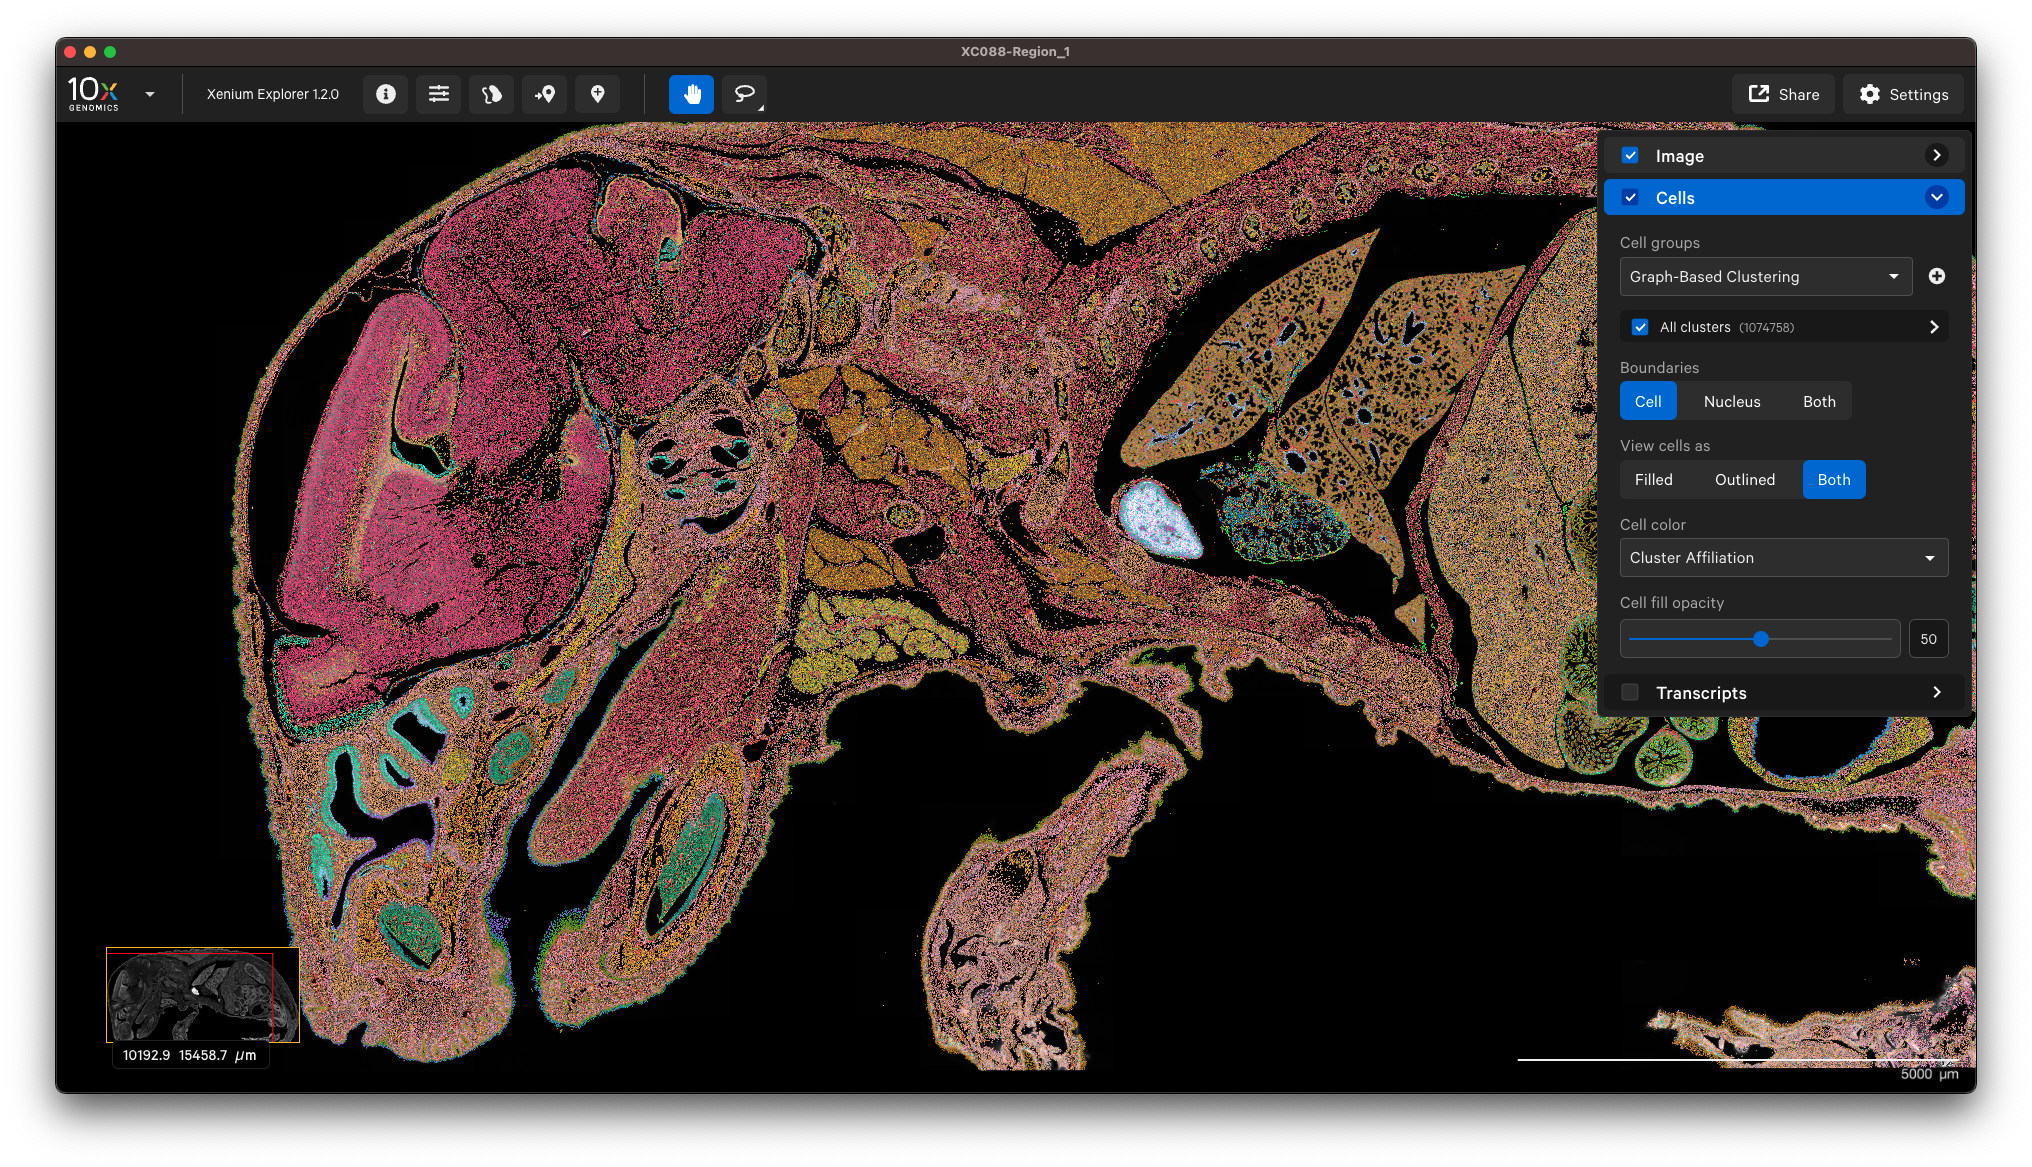
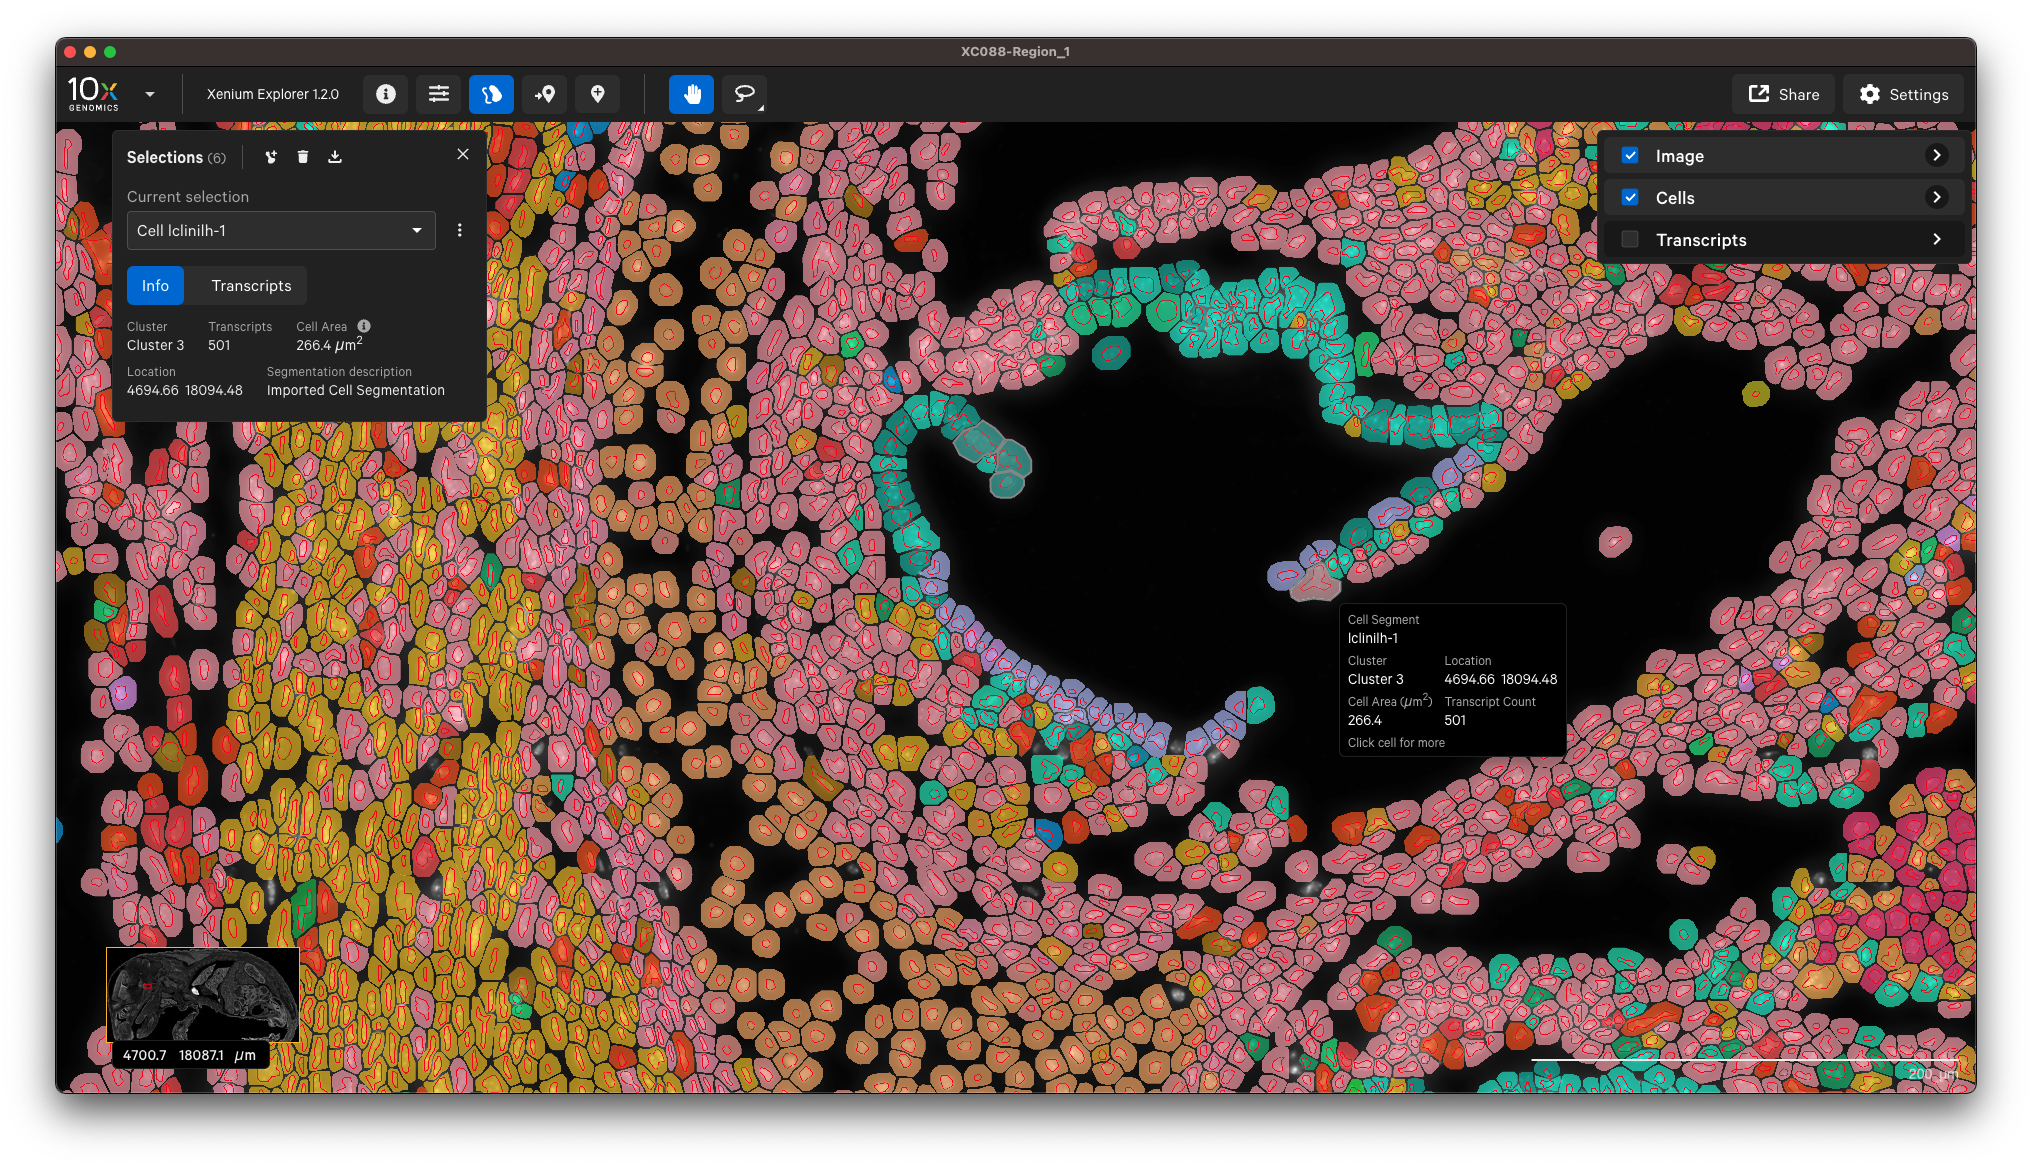
You can view the output in Xenium Explorer. For example, here are the cell clusters with nuclei outlines for a mouse pup sample with cell segmentation results generated by QuPath:
Example to only import nucleus segmentation:
xeniumranger import-segmentation --id=polygon-demo-nuclei \
--xenium-bundle=/path/to/xenium/files \
--nuclei=polygon.geojson \
--units=pixels
Generate 2D mask segmentation results (i.e., 2D from Cellpose) and then import. The nucleus and cell segmentation files can be in either TIFF or NPY format. For example:
nuclei.tifornuclei.npycontaining nucleus segmentation resultscells.tiforcells.npycontaining cell segmentation results
Example to import nucleus and cell segmentation:
# Note: the --cells argument must be run with the --nuclei argument
xeniumranger import-segmentation --id=mask-demo-nuclei \
--xenium-bundle=/path/to/xenium/files \
--nuclei=nuclei.tif \
--cells=cells.npy
Example to only import nucleus segmentation:
xeniumranger import-segmentation --id=mask-demo-cells \
--xenium-bundle=/path/to/xenium/files \
--nuclei=nuclei.tif
Generate segmentation results using transcripts (e.g., Baysor; example analysis) and then import:
segmentation.csvcontaining segmentation and transcript assignment resultssegmentation_polygons.jsoncontaining GeoJSON polygons
xeniumranger import-segmentation --id=baysor-demo \
--xenium-bundle=/path/to/xenium/files \
--transcript-assignment=segmentation.csv \
--viz-polygons=segmentation_polygons.json \
--units=microns
For this use case, some nuclei and cell import-segmentation metrics are not computed because a single segmentation_polygons GeoJSON file is imported (compared to the polygon input usage).
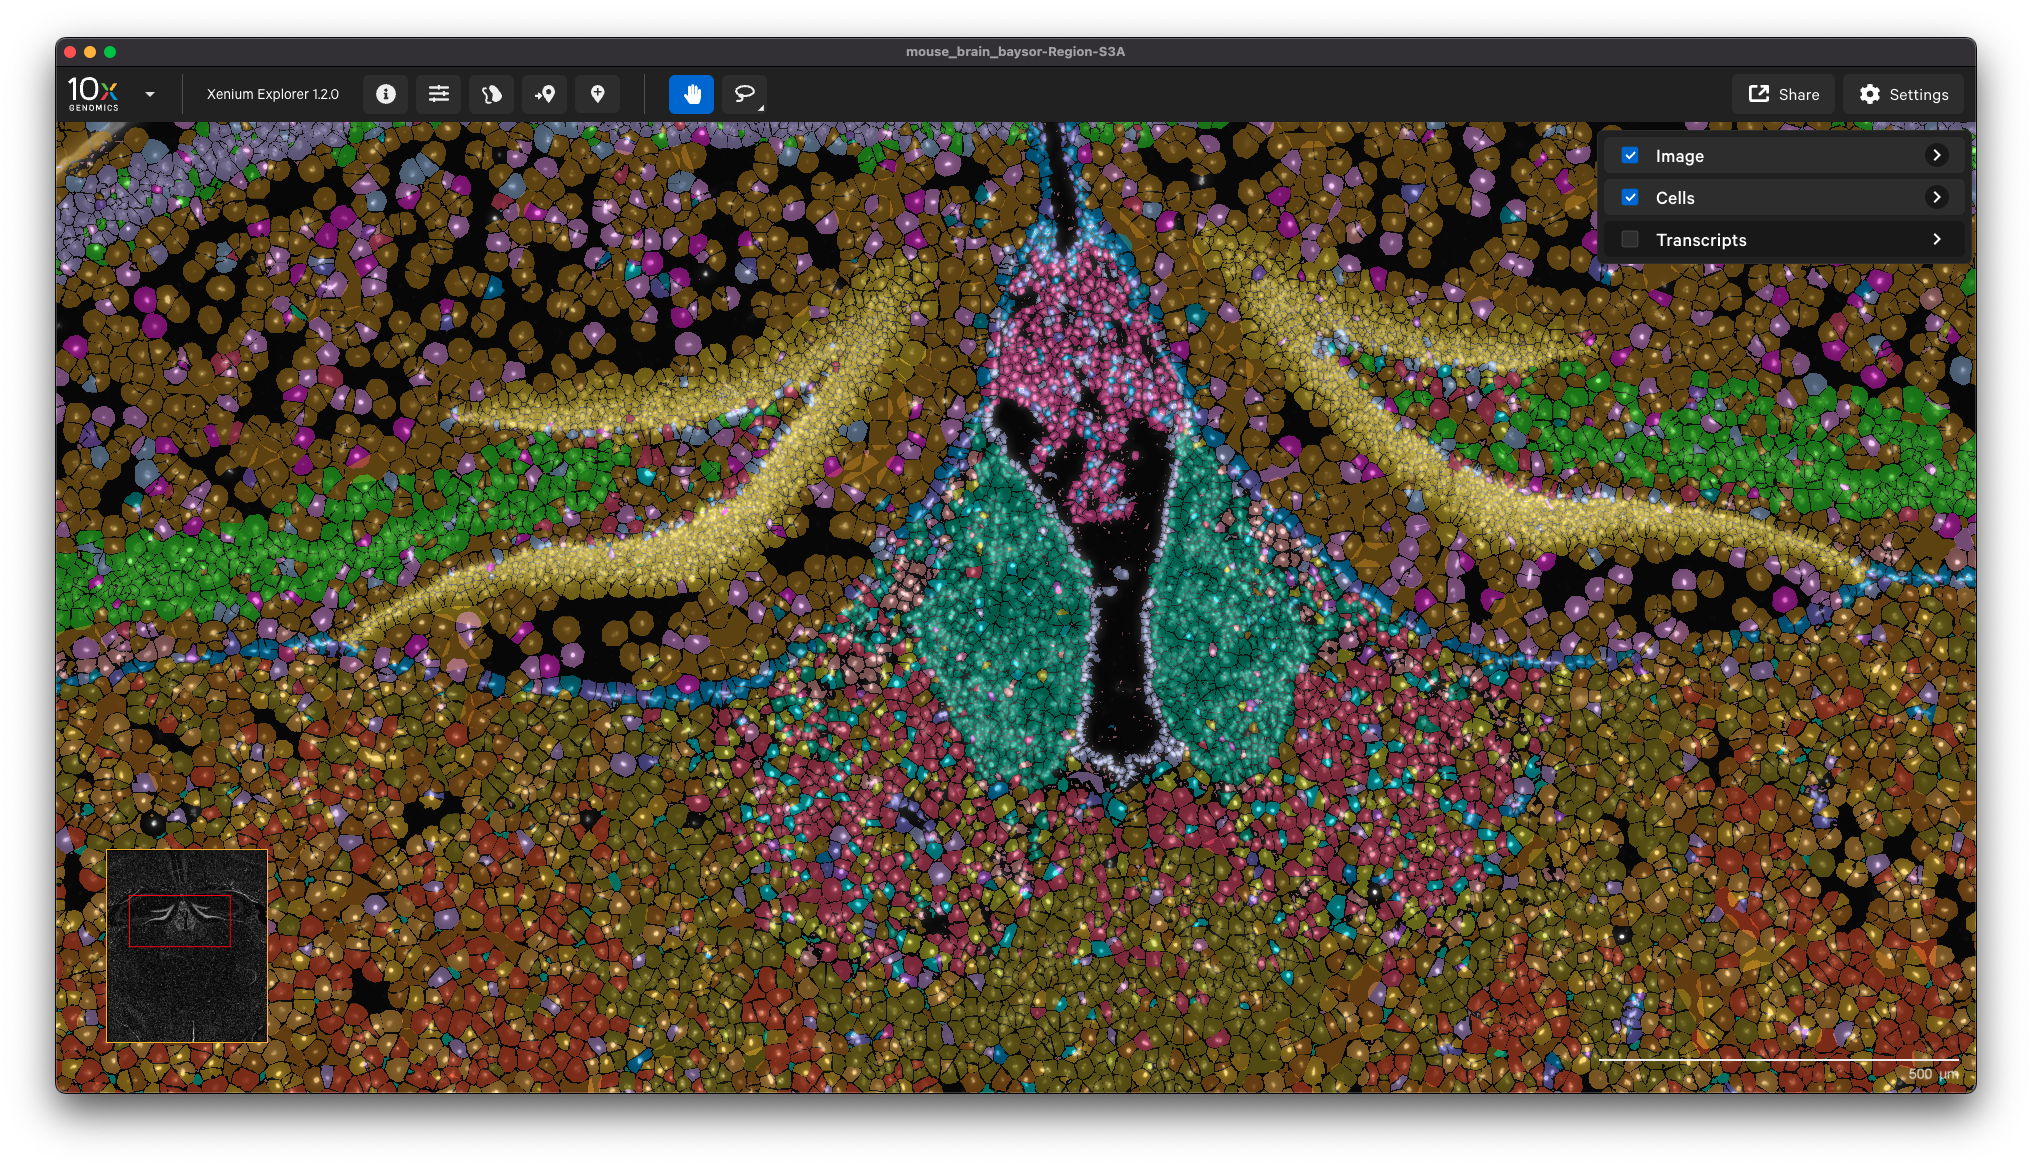
You can view the output in Xenium Explorer. For example, here are the cell clusters for a mouse brain sample with cell segmentation results generated by Baysor:
This option enables you to inform your Xenium analysis with cell segmentation based on post-Xenium imaging. You can use Xenium Explorer or community-developed tools to align a post-Xenium H&E or IF image and generate an image alignment transformation matrix for input to Xenium Ranger’s import-segmentation pipeline.
The image alignment file format should be a 3x3 transformation matrix, where the last row is [0,0,1]. It captures the translation, scaling, rotation, and reflection applied to the imported image (see Xenium Explorer's alignment algorithm section). Some image alignment CSV files are available on the Xenium Human Colon Preview dataset page (for Non-diseased, pre-designed panel and Cancer, pre-designed + add-on panel samples).
In this example, the cells and nuclei are segmented on a post-Xenium H&E image using QuPath. The image is then aligned in Xenium Explorer, where the image alignment CSV transformation matrix is downloaded.
To visualize the QuPath cell/nucleus segmentation polygons on the H&E image in Xenium Explorer, we need to import the QuPath results into the Xenium output bundle.
The QuPath GeoJSON segmentation results and the Xenium Explorer matrix CSV are the inputs for Xenium Ranger import-segmentation:
xeniumranger import-segmentation --id=image-transform-demo \
--xenium-bundle=/path/to/xenium/files \
--coordinate-transform=demo_imagealignment.csv \
--nuclei=qupath.geojson \
--cells=qupath.geojson \
--units=pixels
In Xenium Ranger v1.7, the segmentation results can be in either polygon or mask format.
After running this command, the dataset can be opened in Xenium Explorer to visualize segmentation and transcript results overlaid on the H&E image (select option to upload the image alignment matrix to open the already aligned H&E image).
After the pipeline completes, check the output outs/ directory (see Output overview). For example, look at these files:
- Analysis summary: check metrics and plots on the Cell Segmentation tab. There are new metrics (described below) for imported segmentation results (present in
analysis_summary.htmlandmetrics_summary.csv). - All secondary analysis files
- All cell, nuclei, and transcript files
Morphology images are unchanged. The updated segmentation results can be visualized in Xenium Explorer.
The additional metrics are described below and are generated for scenarios described in the import-segmentation algorithms section.
| Import-segmentation metrics | Description |
|---|---|
| Percentage of pixels found to be ambiguous when importing nucleus segmentation polygons | The percentage of pixels found to be ambiguous when converting polygons into a mask. Ambiguities occur when polygons overlap one another. (Only calculated when polygon GeoJSON boundaries imported with --nucleus and --cell) |
| Percentage of pixels found to be ambiguous when importing cell segmentation polygons | The percentage of pixels found to be ambiguous when converting polygons into a mask. Ambiguities occur when polygons overlap one another. (Only calculated when polygon GeoJSON boundaries imported with --nucleus and --cell) |
| The percentage of imported nucleus polygons that were removed | The percentage of nuclei that were removed when importing polygons for nucleus segmentation. Nuclei are removed when they cannot be made consistent with the 2D nucleus mask. This can happen if there are nuclei completely contained within another or when a nucleus has a large portion of its area overlapping another nucleus. (Only calculated when polygon GeoJSON boundaries imported with --nucleus and --cell) |
| The percentage of imported cell polygons that were removed | The percentage of cells that were removed when importing polygons for cell segmentation. Cells are removed when they cannot be made consistent with the 2D cell mask. This can happen if there are cells completely contained within another or when a cell has a large portion of its area overlapping another cell. (Only calculated when polygon GeoJSON boundaries imported with --nucleus and --cell) |
| Percentage of cells without a nucleus | The percentage of cells that do not have a nucleus. This can happen when an imported community-developed cell or nucleus segmentation is not in agreement with the 10x-generated or the imported community-developed nucleus segmentation. |
| Percentage of nuclei without a cell | The percentage of nuclei that are not contained within a cell. This can happen when an imported community-developed cell or nucleus segmentation is not in agreement with the 10x-generated or the community-developed cell segmentation. |