Whole transcriptome spatial discovery at single cell scale

Flexible assays that meet your needs
Overview
HD WT Panel Gene Expression
Protein coding gene coverage
Recommended assay for differential gene expression in human, mouse, and rat
Most flexible tissue compatibility
Most sequencing-efficient Visium HD assay
HD 3’ Gene Expression
Whole transcriptome coverage
Recommended assay for expanded discovery applications
Most diverse species compatibility
De novo discovery, including feasibility for isoforms, TCRs/BCRs, and more
Product details
Chemistry
Compatible species
Compatible samples
Assay Input
Instrument
Slide architecture & resolution
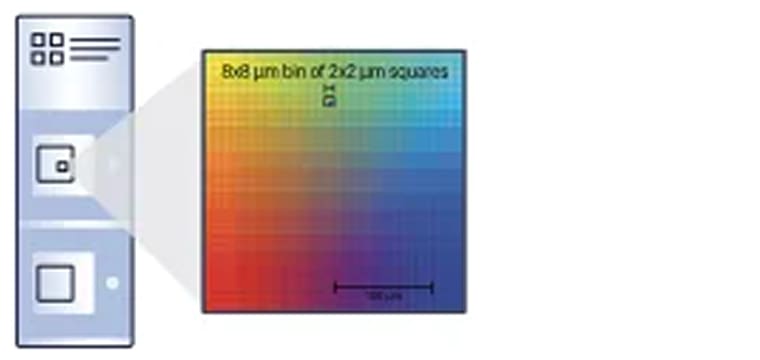
Continuous lawn of 2 μm x 2 μm barcoded squares for single cell–scale resolution
Continuous lawn of 2 μm x 2 μm barcoded squares for single cell–scale resolution
Capture Area sizes
Same-section capabilities
Featured resources
Resources to get started
Explore the unique strengths and applications of the 10x spatial portfolio, plus compare and contrast the Visium and Xenium platforms to find the right fit for your needs.
Get the information you need to write grants featuring Visium experiments (including a technology overview, benchmarking data, and more).
Find helpful user guides and technical documents to get started with Visium HD spatial assays.
Featured publications
Demonstrated the Visium HD assay has superior spatial fidelity compared to other commercially available sequencing-based spatial transcriptomics platforms.
Mapped critical immune cell interactions in the colorectal tumor microenvironment.
Discovered that regionalized signalling drives two distinct T-cell states in the small intestine.