Tissue Microarrays (TMAs) are composed of representative small-tissue cores extracted from formaldehyde fixed paraffin embedded (FFPE) tissue blocks arranged in a predetermined order. The tissue cores can be extracted manually or using an automated TMA machine. TMAs offer the ability to perform high-throughput analysis over a large number of tissue samples under the same experimental conditions. TMAs can contain cores across multiple tissue types, disease conditions, from different time points in the disease progression, or from different donors, with widely different clinical outcomes.
- Learn how to process TMA data on Visium HD slides with Space Ranger v4.1 and Loupe Browser v9.1.
Before you begin, you must:
- Download and install Space Ranger v4.1 or later on a supported Linux machine (see minimum system requirements).
- Download and install Loupe Browser v9.1 or later on a supported Mac or Windows machine.
If this is your first time running Space Ranger, it is recommended to complete the installation and setup tutorial prior to attempting this tutorial.
In this tutorial, we analyze a Visium HD 11 mm human breast cancer TMA dataset.
To begin, download the following data to your working directory on the machine you are using to run Space Ranger:
- FASTQ files
- CytAssist image
- Tissue image (H&E)
- Human probe set CSV (v2.1) - Download from Probe Set downloads section
- Slide layout file - Download from Download Slide File section
You will also need the following metadata:
- Slide serial number:
H2-84BB88N - Capture Area:
A
This tutorial describes two workflow options:
Workflow 1: Run Space Ranger on all cores, followed by reclustering in Loupe Browser
The main advantages of this workflow are that you only need to run spaceranger count once, which saves time and compute resources. However, you will have a single set of output files that includes all tissue cores. This workflow may be preferable for rapid quality control and preliminary analysis.
Workflow 2: Select tissue cores in Loupe Browser, then run Space Ranger separately for each tissue core
The primary advantage of this workflow is that you can obtain a complete, separate set of output files for each tissue core. However, this workflow is more time-consuming and requires more compute resources. Use this workflow if you wish to maximize your analysis options or need to distribute output files for each tissue core to different users.
Once you have installed Space Ranger v4.1 (or later) and downloaded the data listed above, you are ready to run spaceranger count. An example command is shown below with input files located in a working directory named sr-4-1-tma/.
spaceranger count --id=Visium_HD_11mm_Human_Breast_Cancer_TMA \
--fastqs=/path/to/sr-4-1-tma/tma-fastqs \
--probe-set=/path/to/sr-4-1-tma/Visium_Human_Transcriptome_Probe_Set_v2.1.0_GRCh38-2024-A.csv \
--slidefile=/path/to/sr-4-1-tma/H2-84BB88N.vlf \
--slide=H2-84BB88N \
--area=A \
--image=/path/to/sr-4-1-tma/Visium_HD_11mm_Human_Breast_Cancer_TMA_tissue_image.btf \
--cytaimage=/path/to/sr-4-1-tma/Visium_HD_11mm_Human_Breast_Cancer_TMA_image.tif \
--create-bam=false \
--localmem=64 \
--localcores=8
--localcores and --localmem options.path/to with the actual paths to the input files on your machine. When the pipeline completes, download the cloupe.cloupe file from the outs/segmented_outputs directory. Open it in Loupe Browser on a supported Mac or Windows machine.
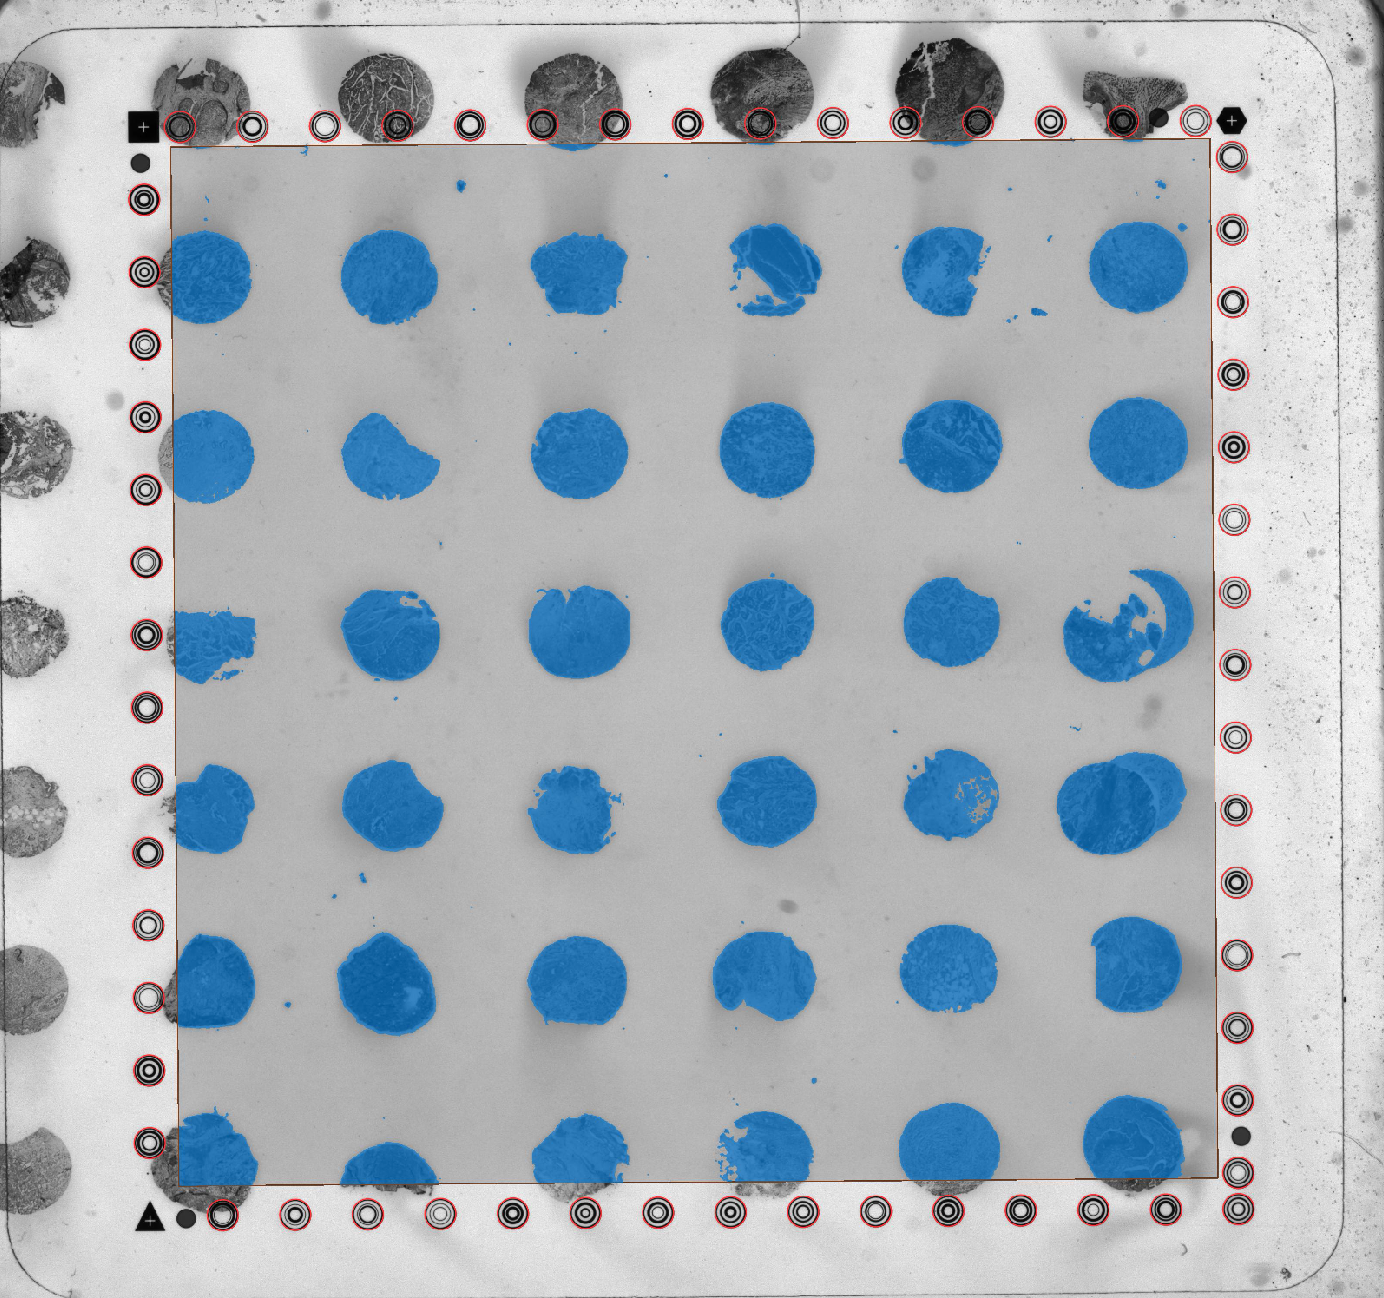
Zoom in to a single tissue core.
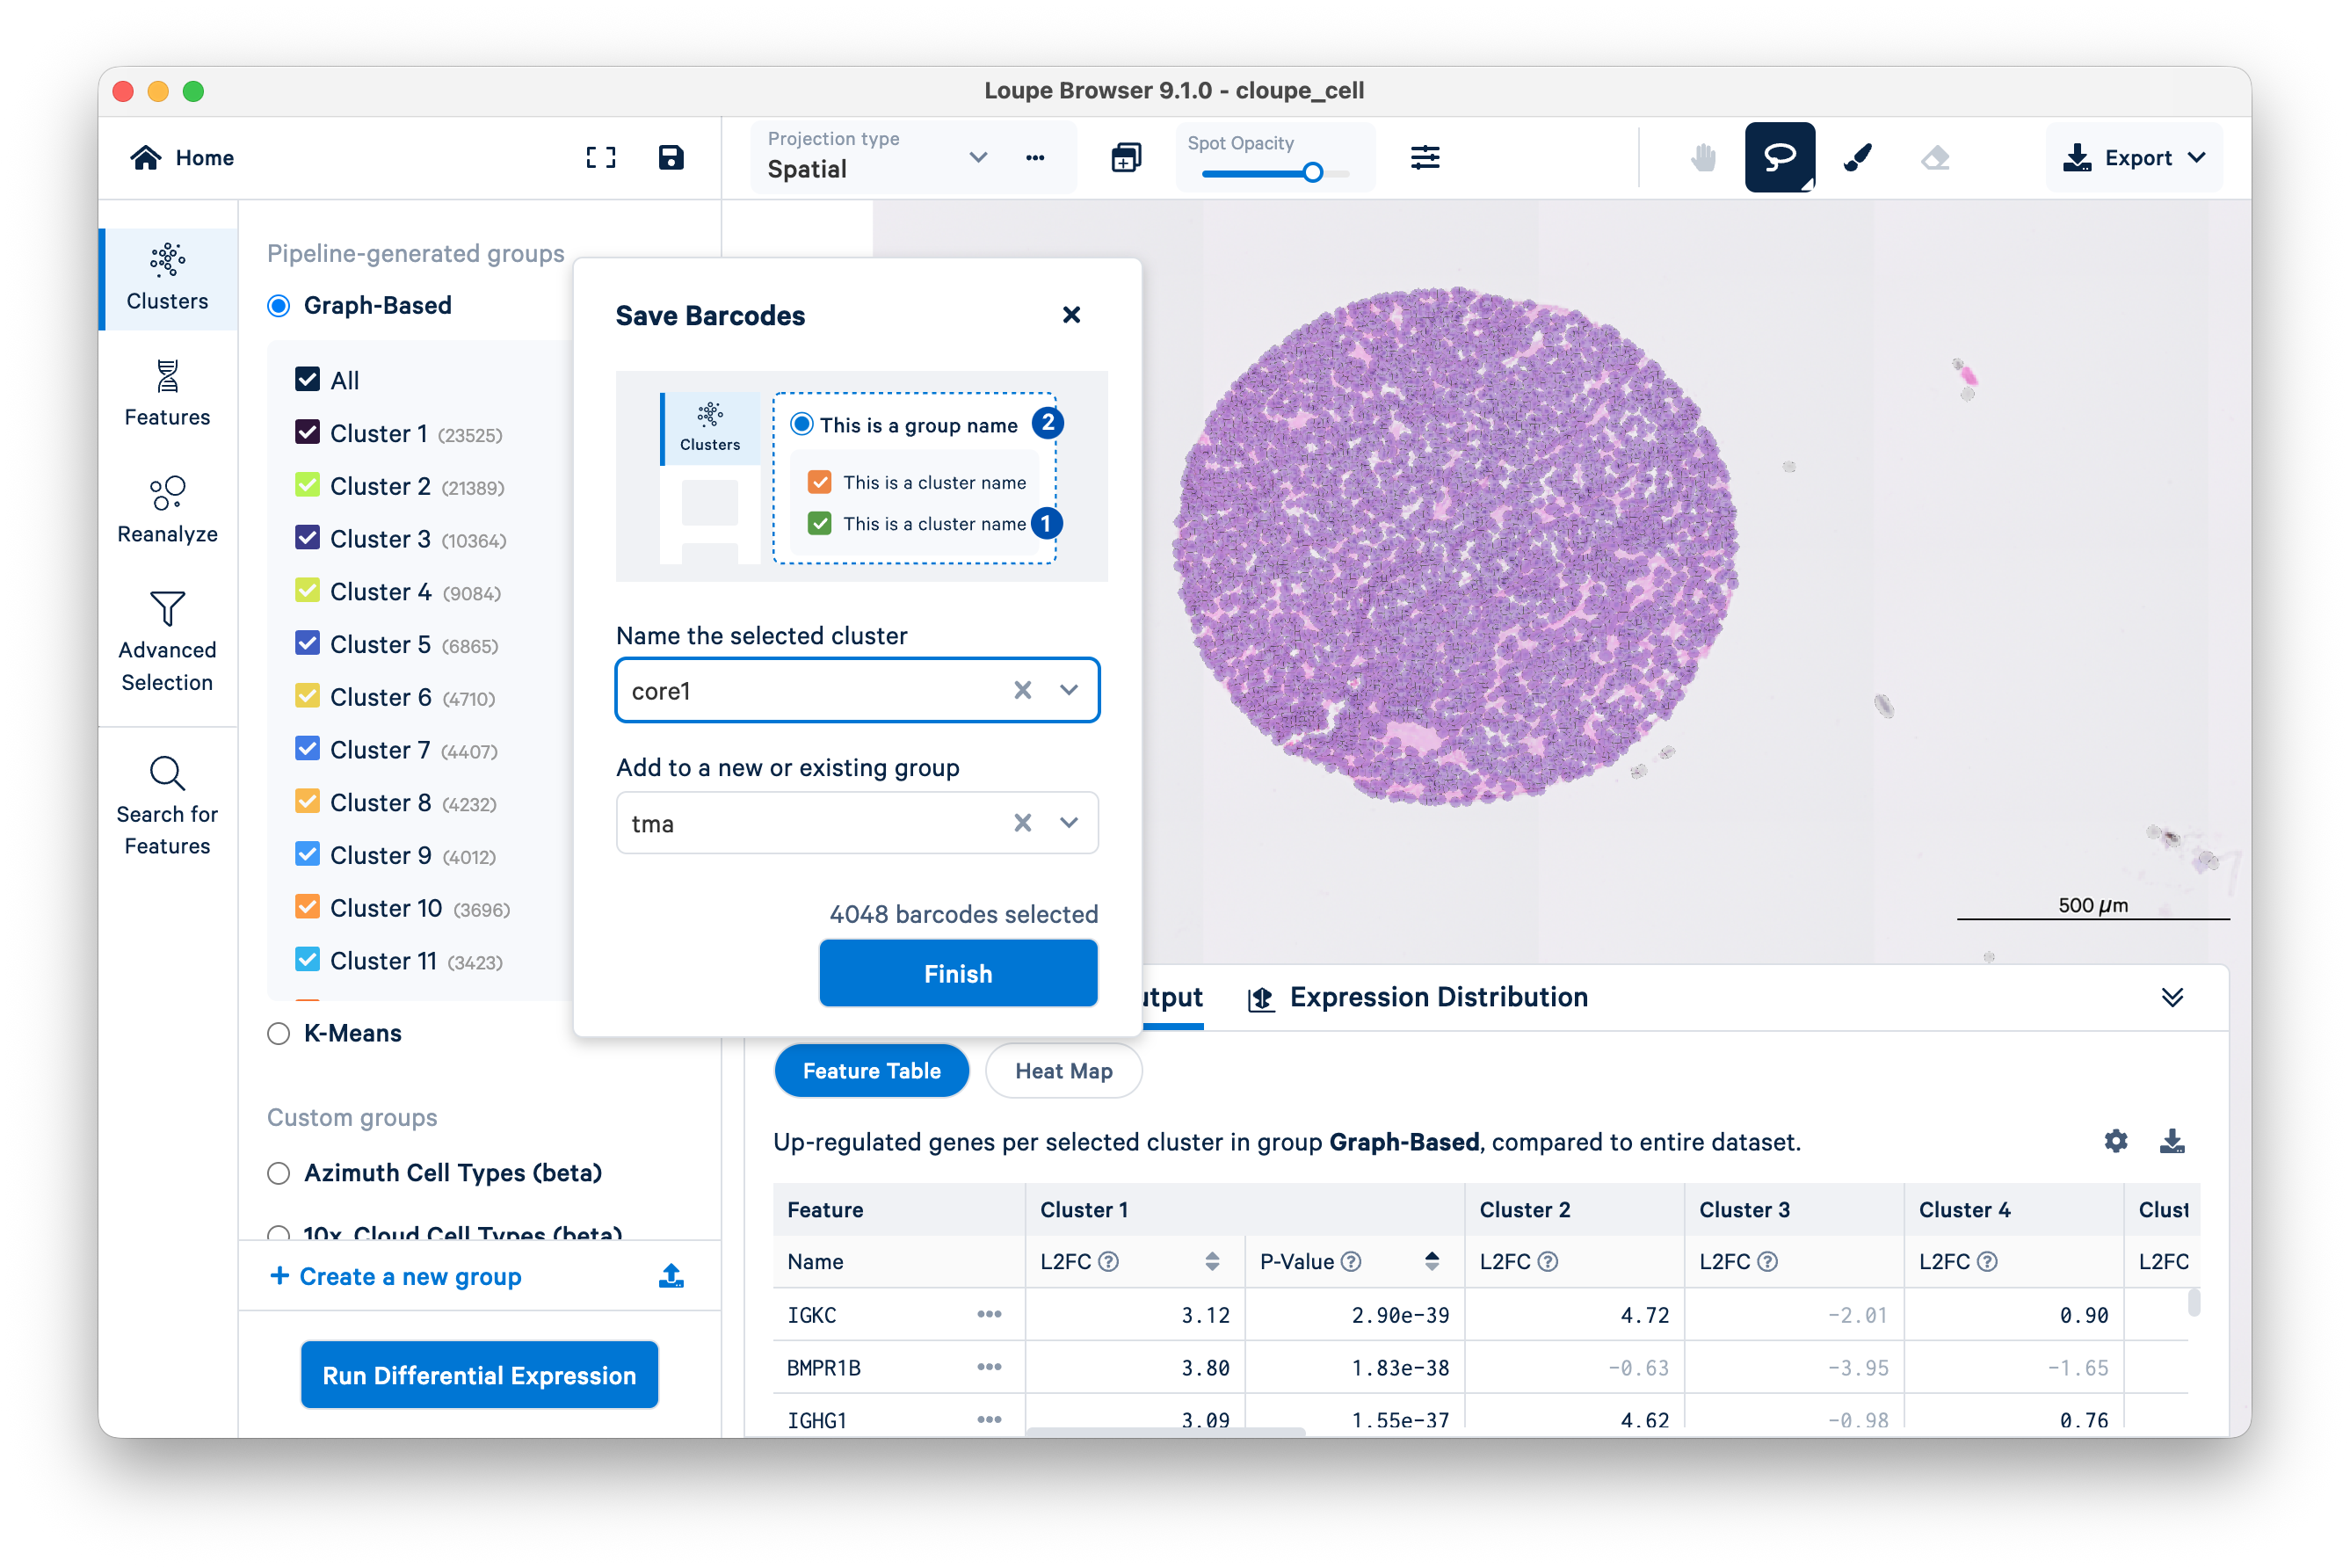
Use the lasso tool to select a single tissue core.
The Save Barcodes prompt will ask you to name the selected cluster and add it to a new or existing group. In this example, name the cluster "core1", add it to a group "tma", and click Finish.
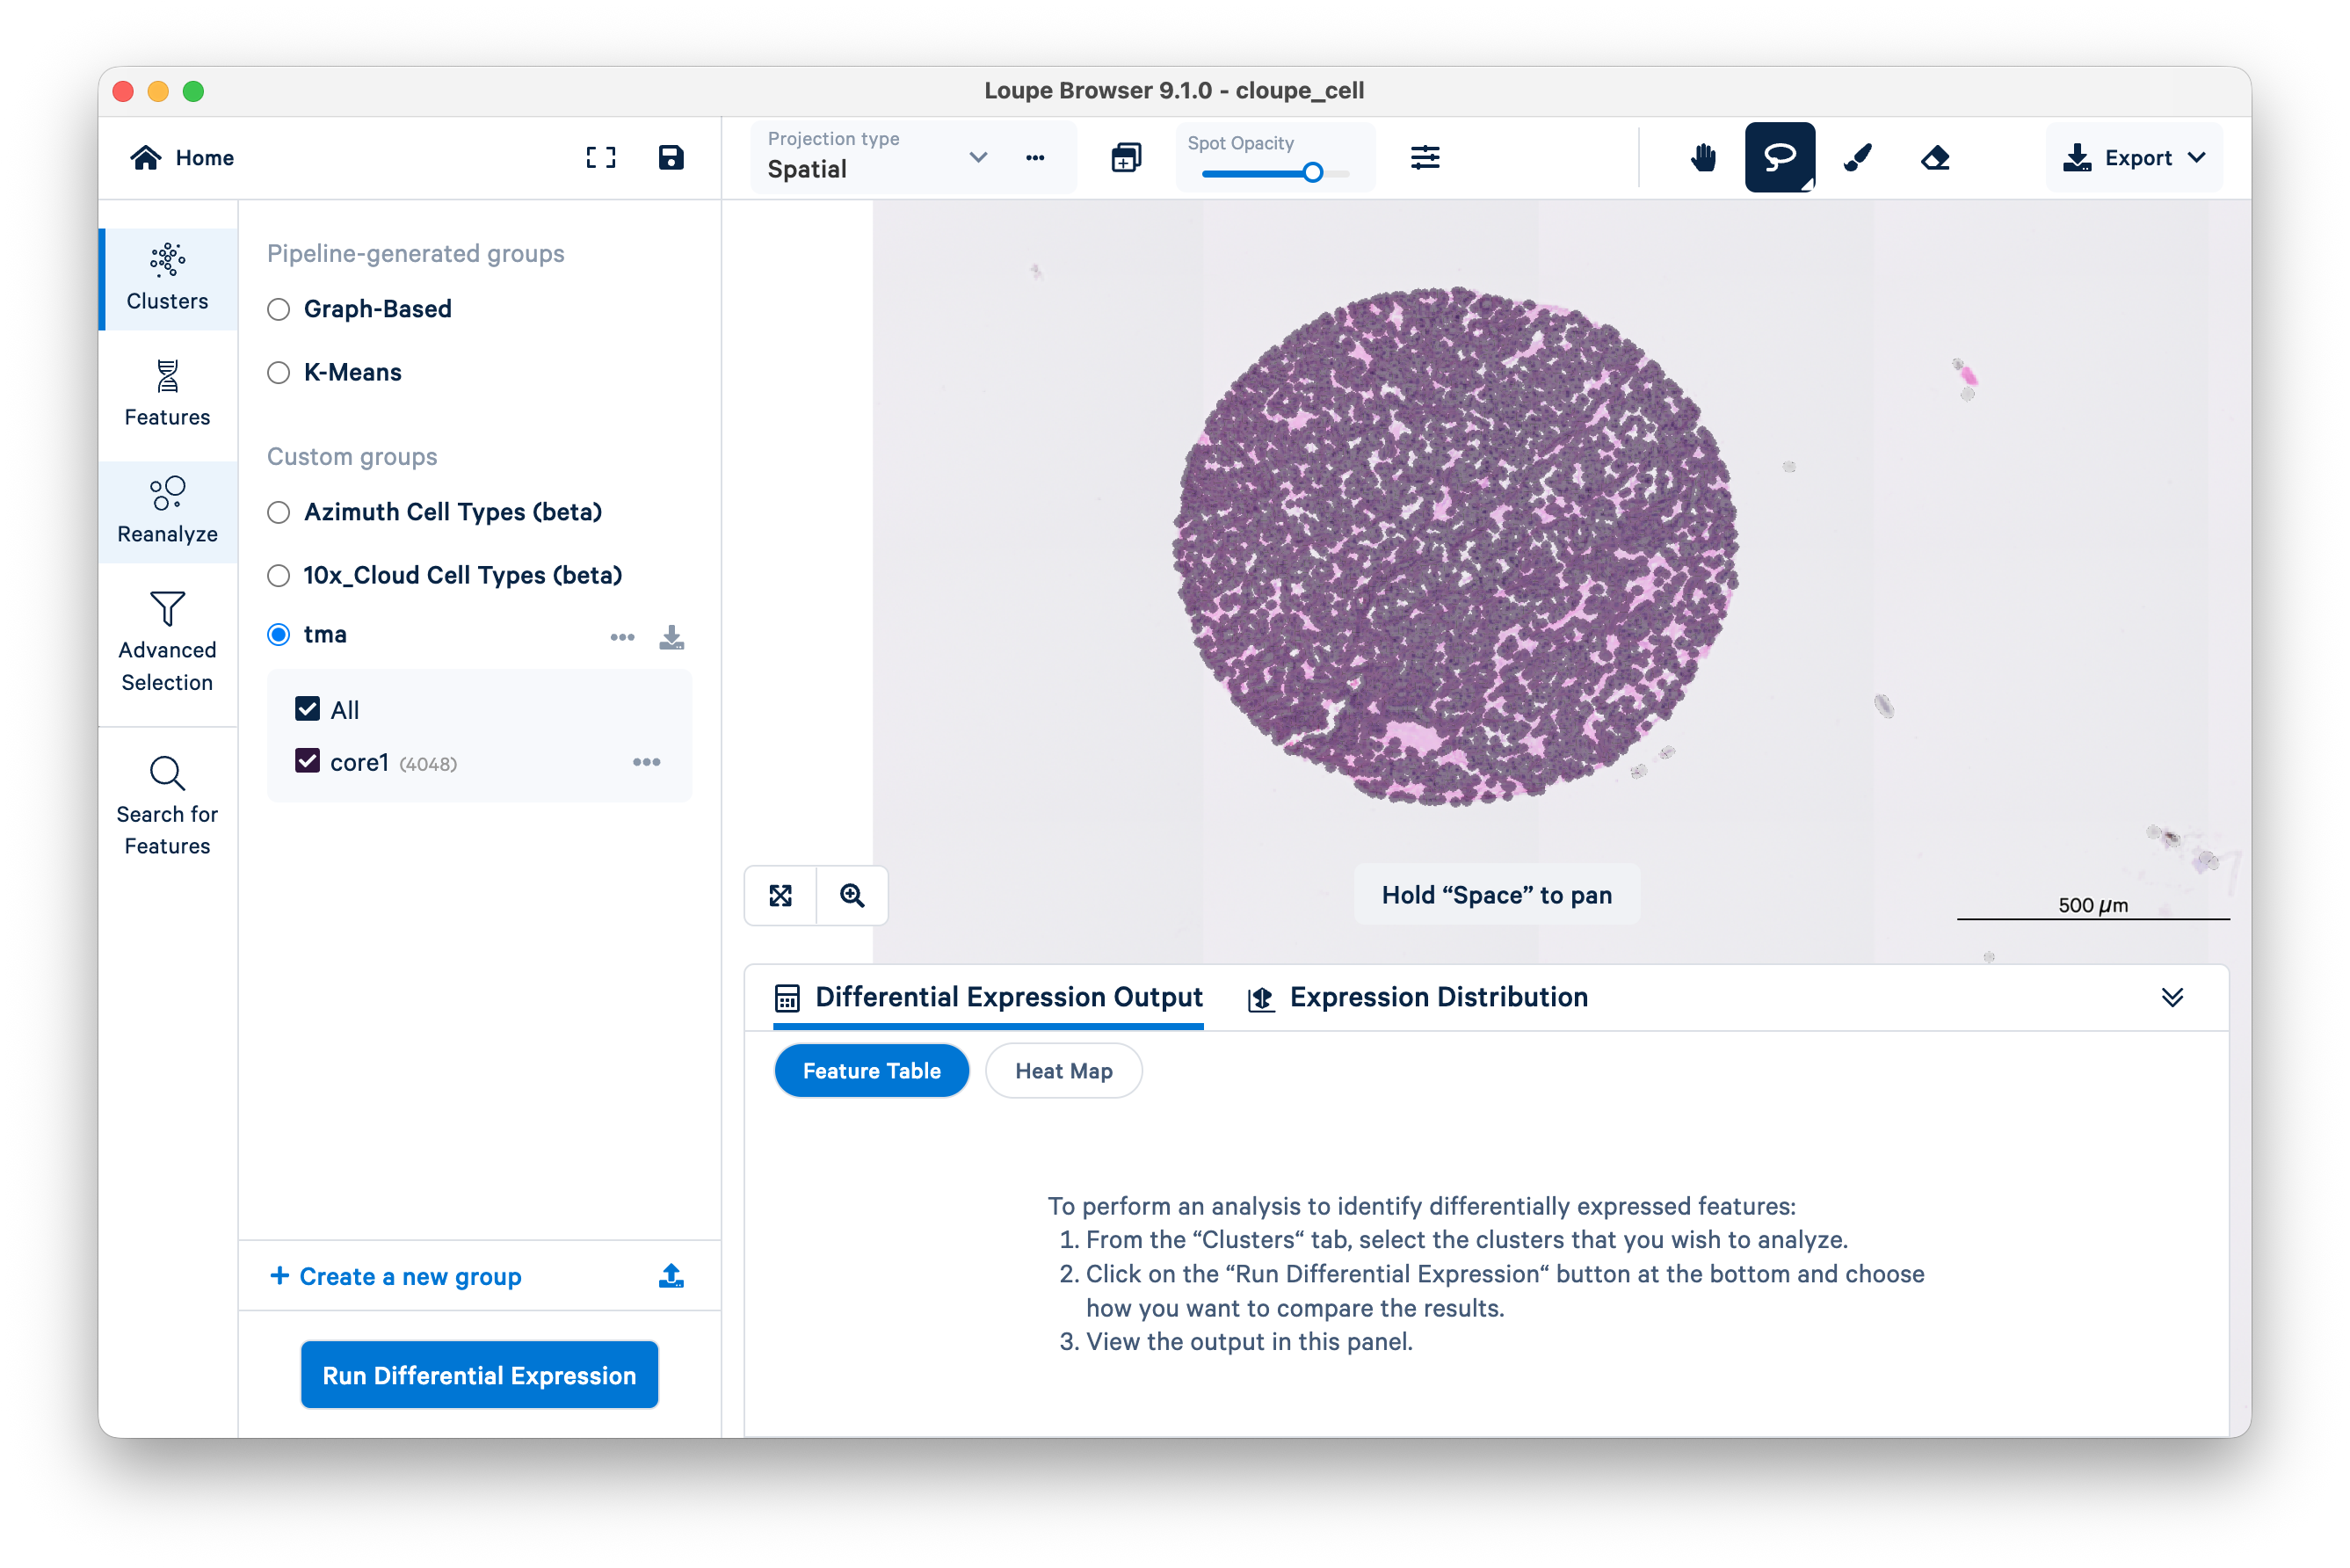
Observe that the "tma" group and "core1" cluster are now displayed on the left-hand side of the window under the Custom groups heading. You can export the barcodes for downstream analysis in a third-party tool of your choice.
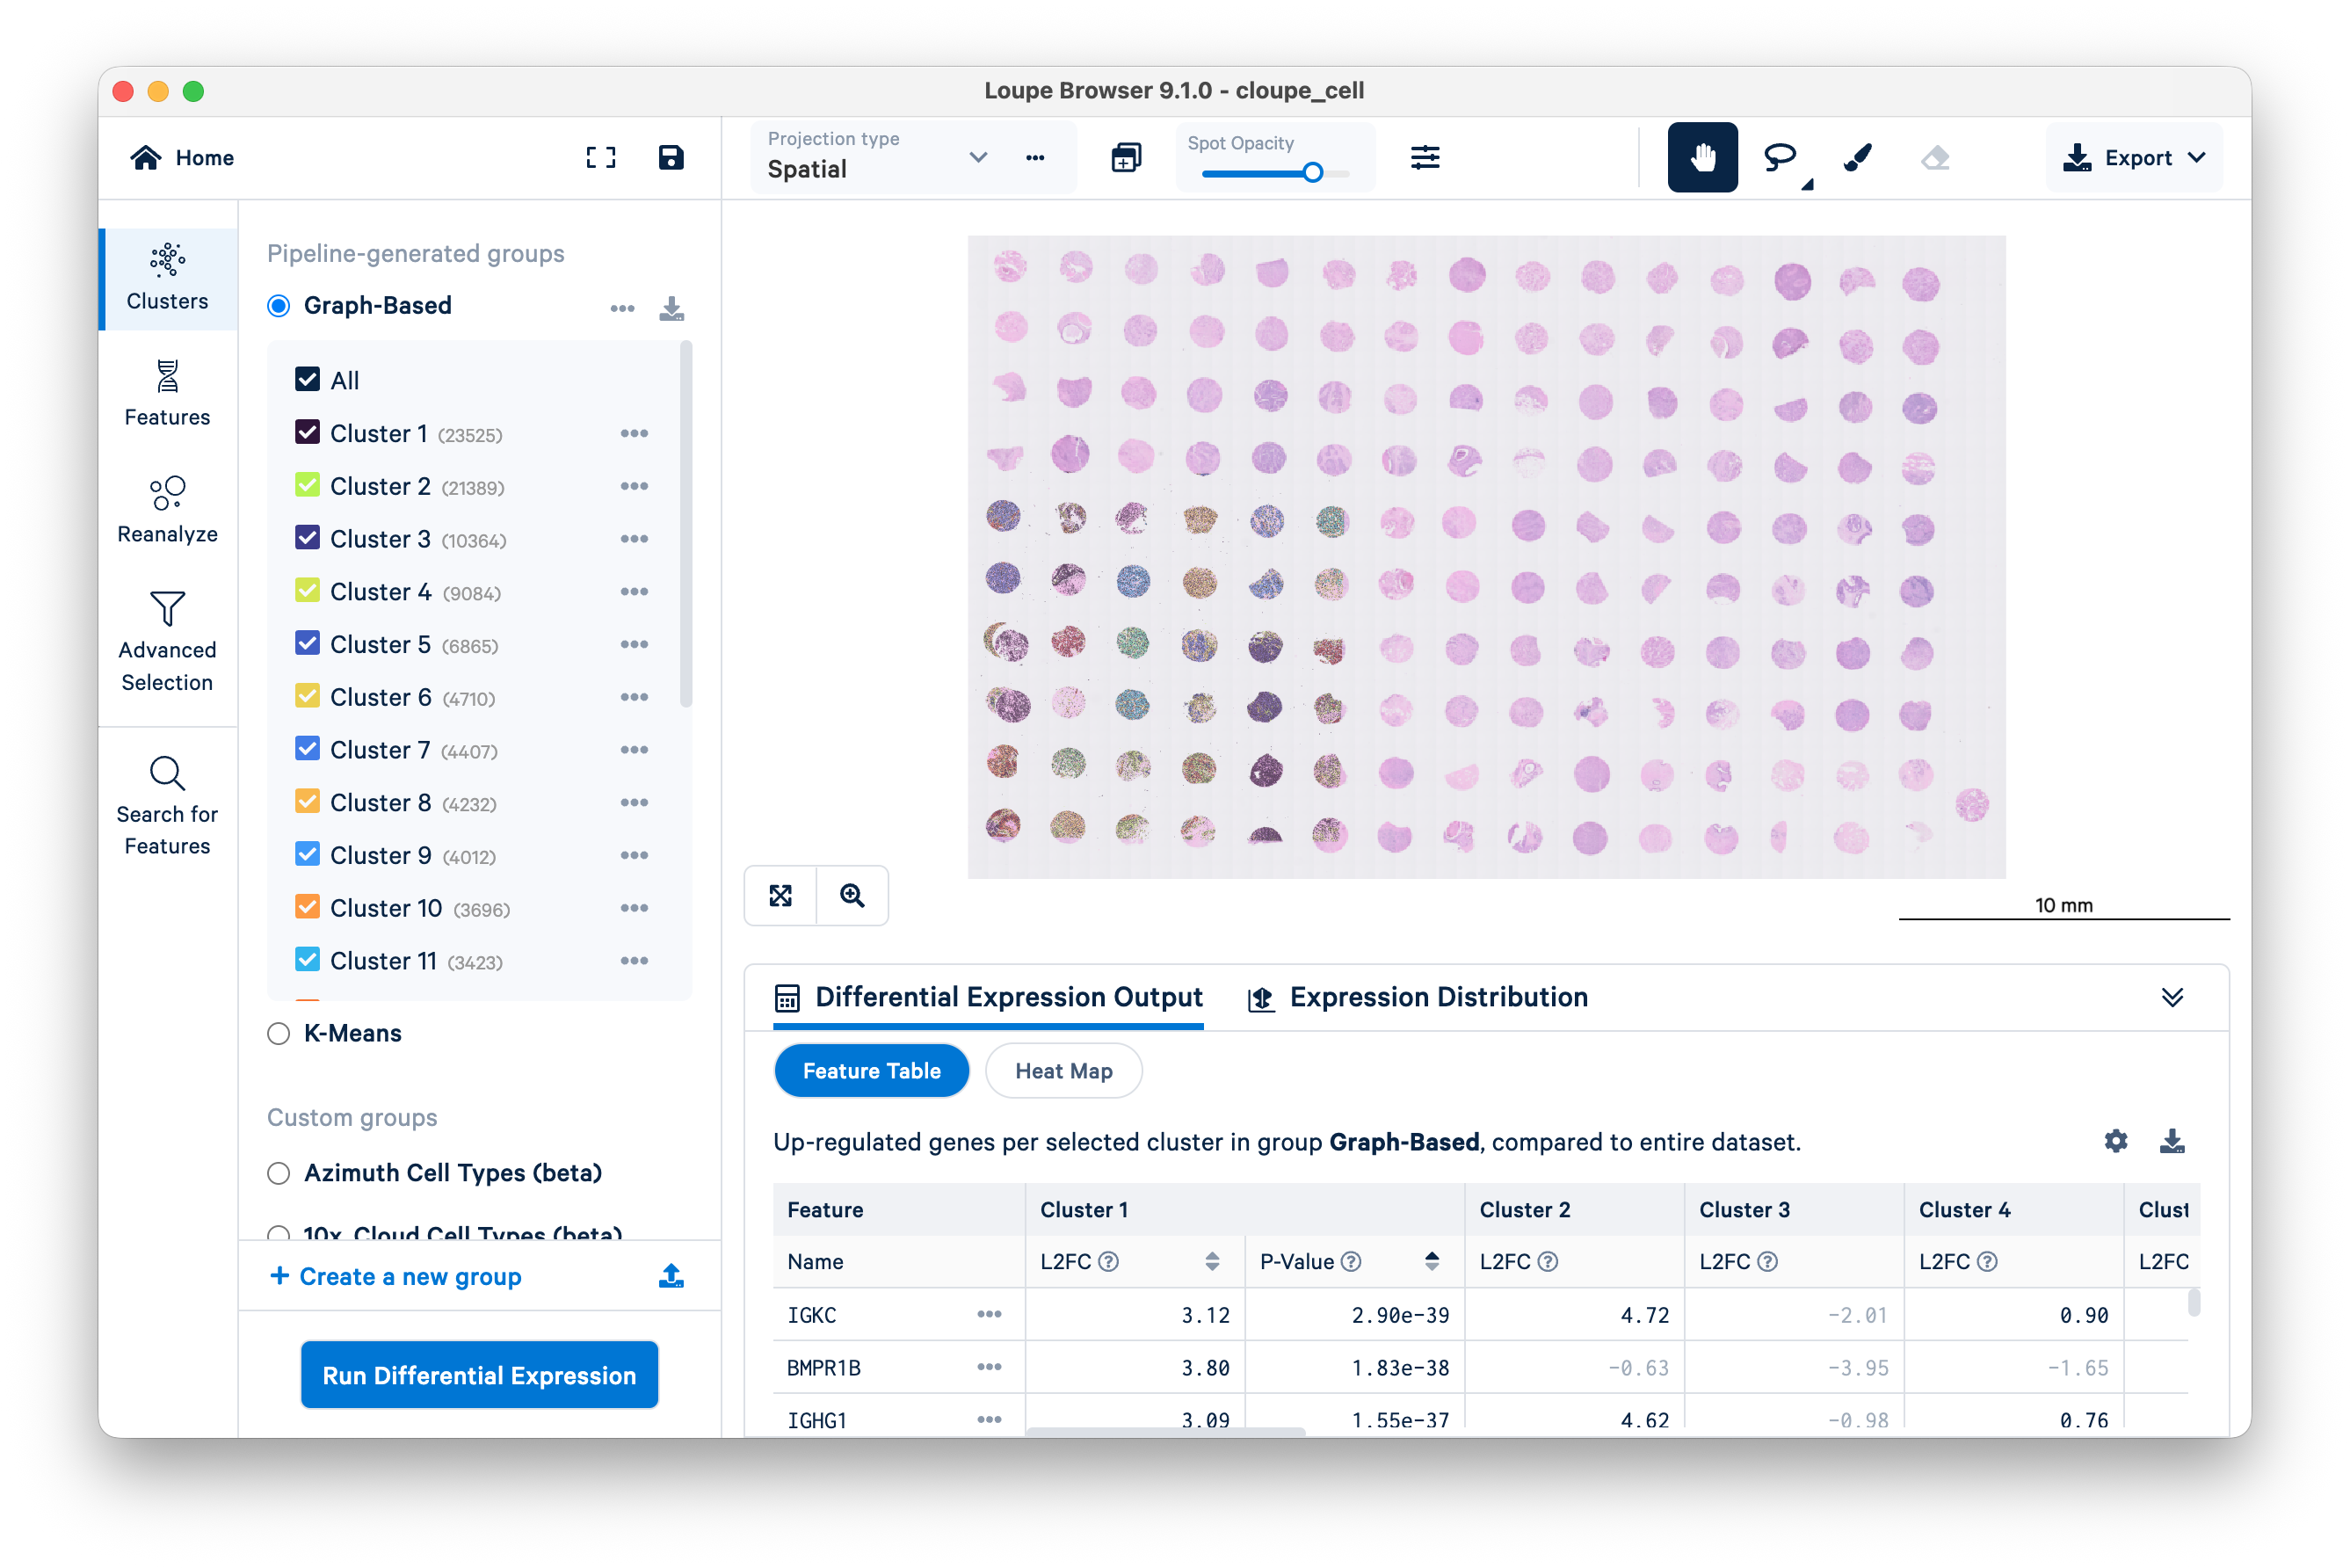
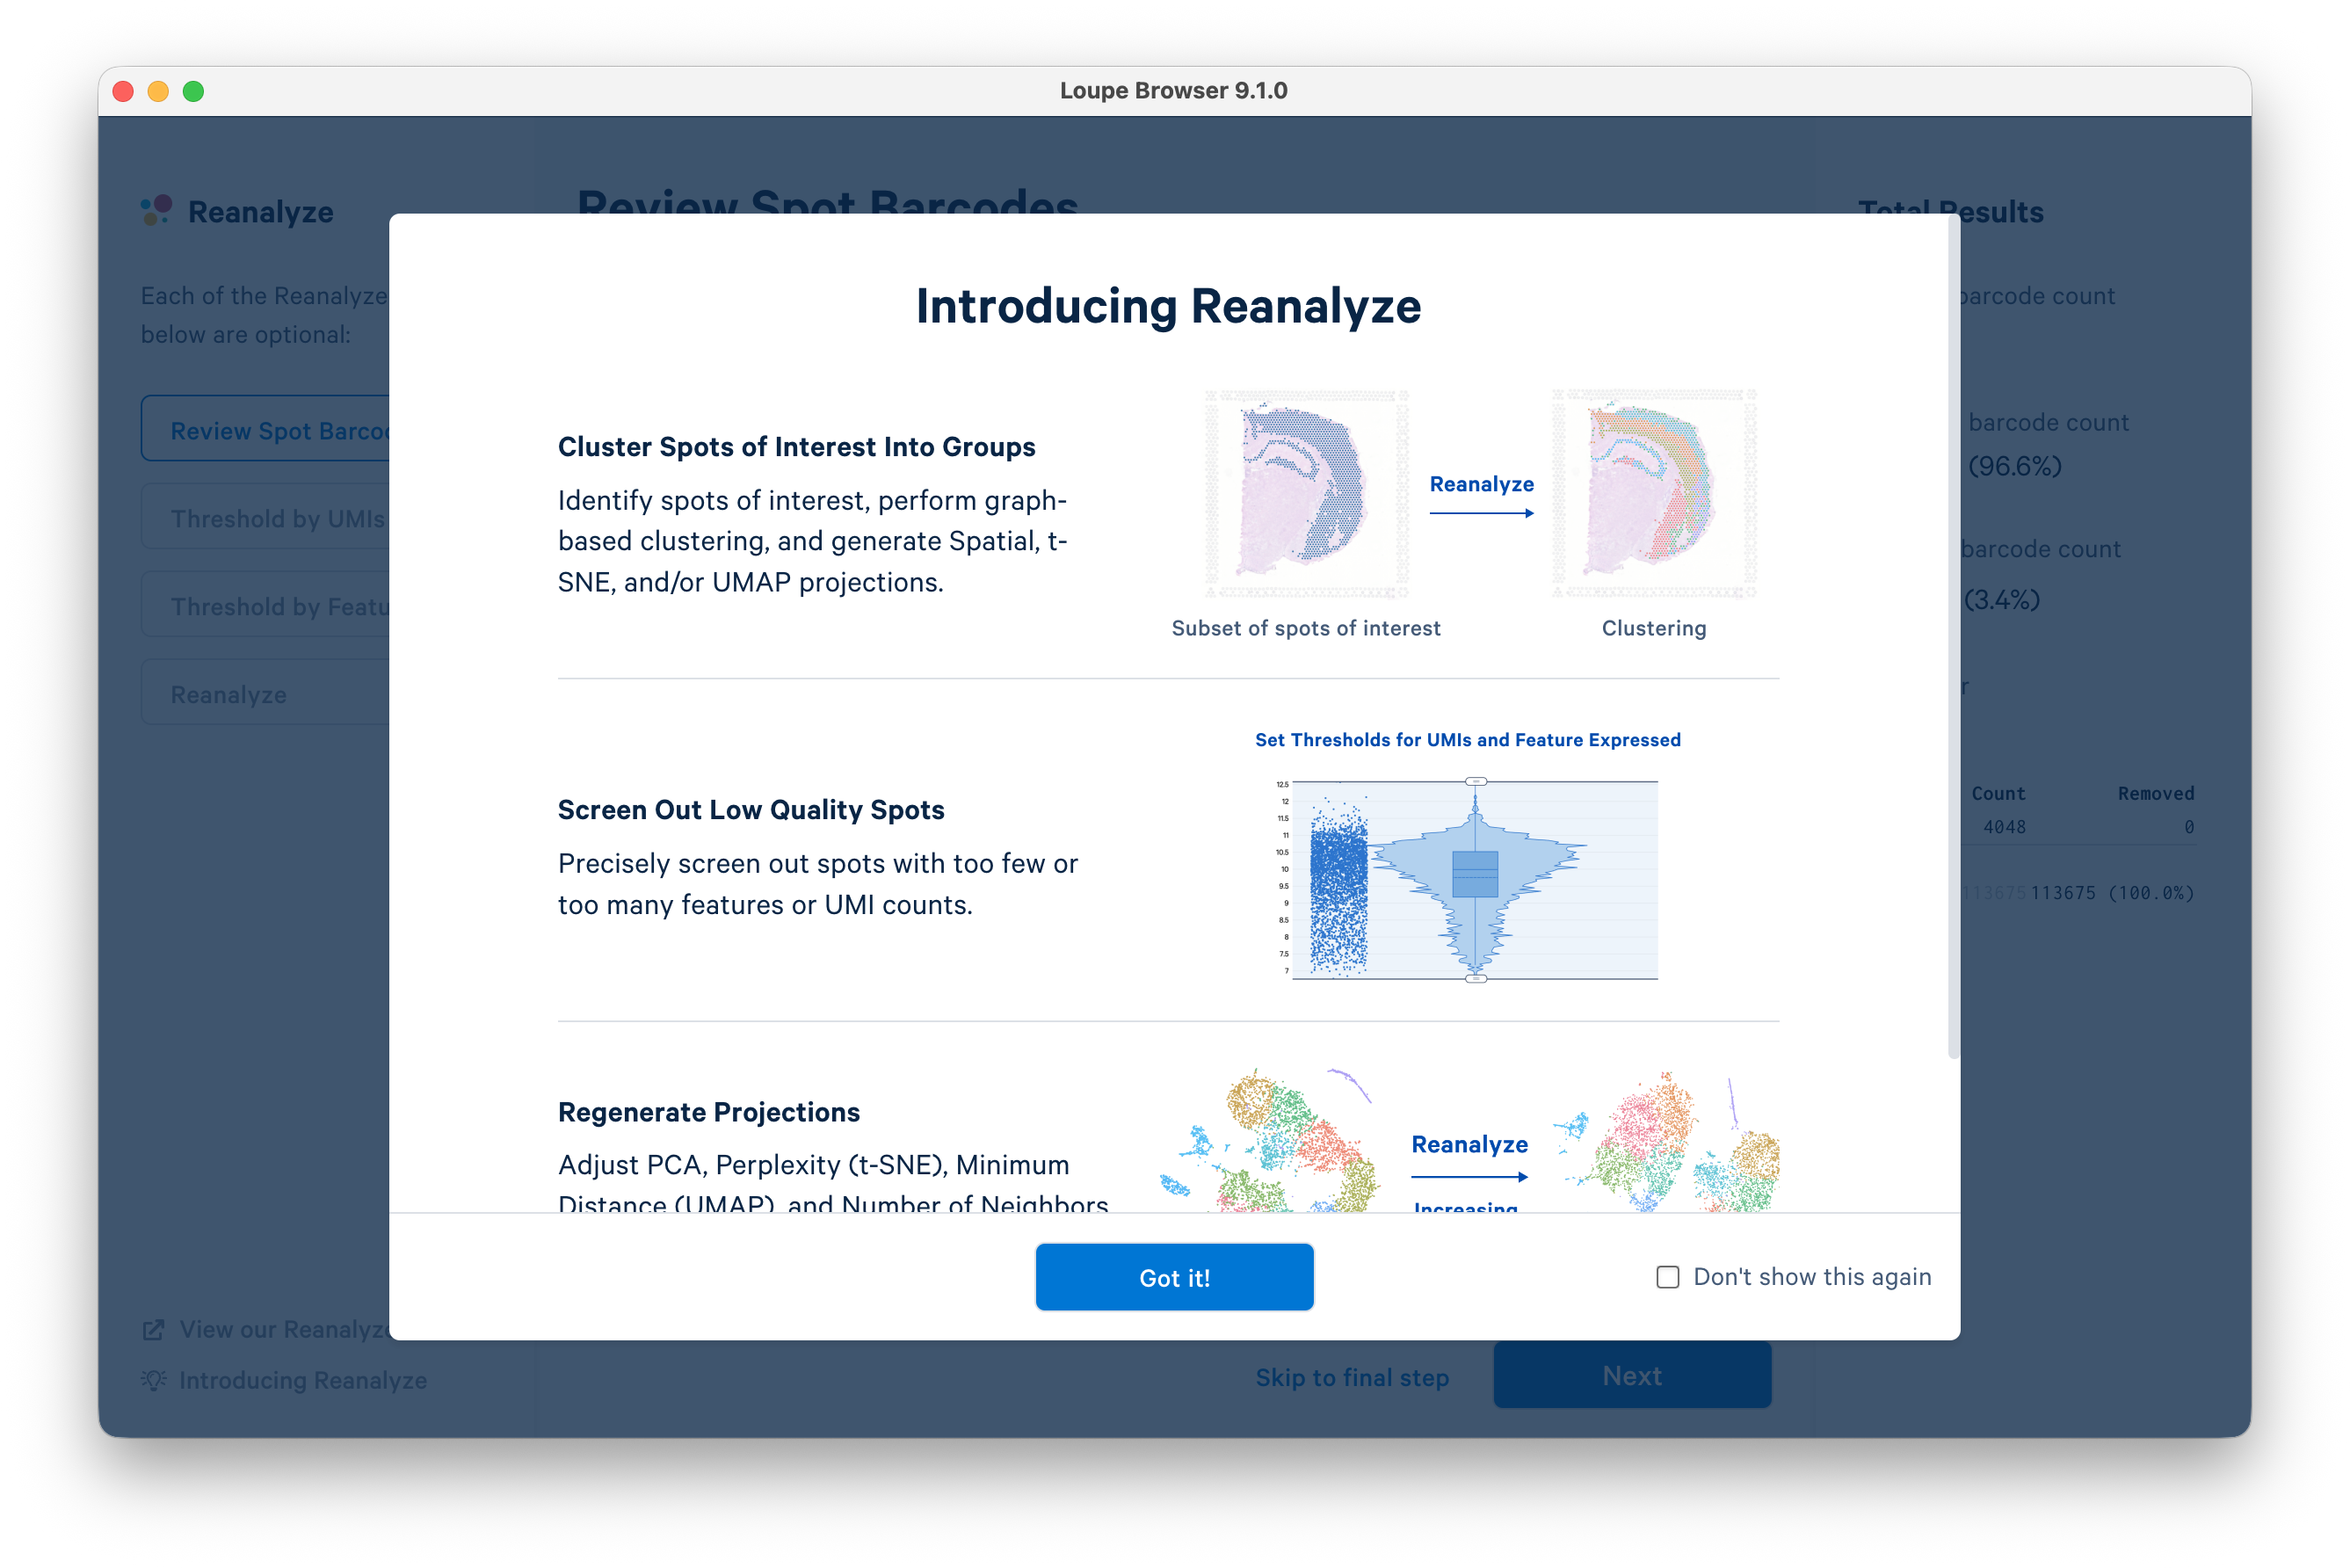
Next, click Reanalyze on the left-hand side of the screen. This will open the Reanalyze workflow in a new window. Click Got it! to proceed.
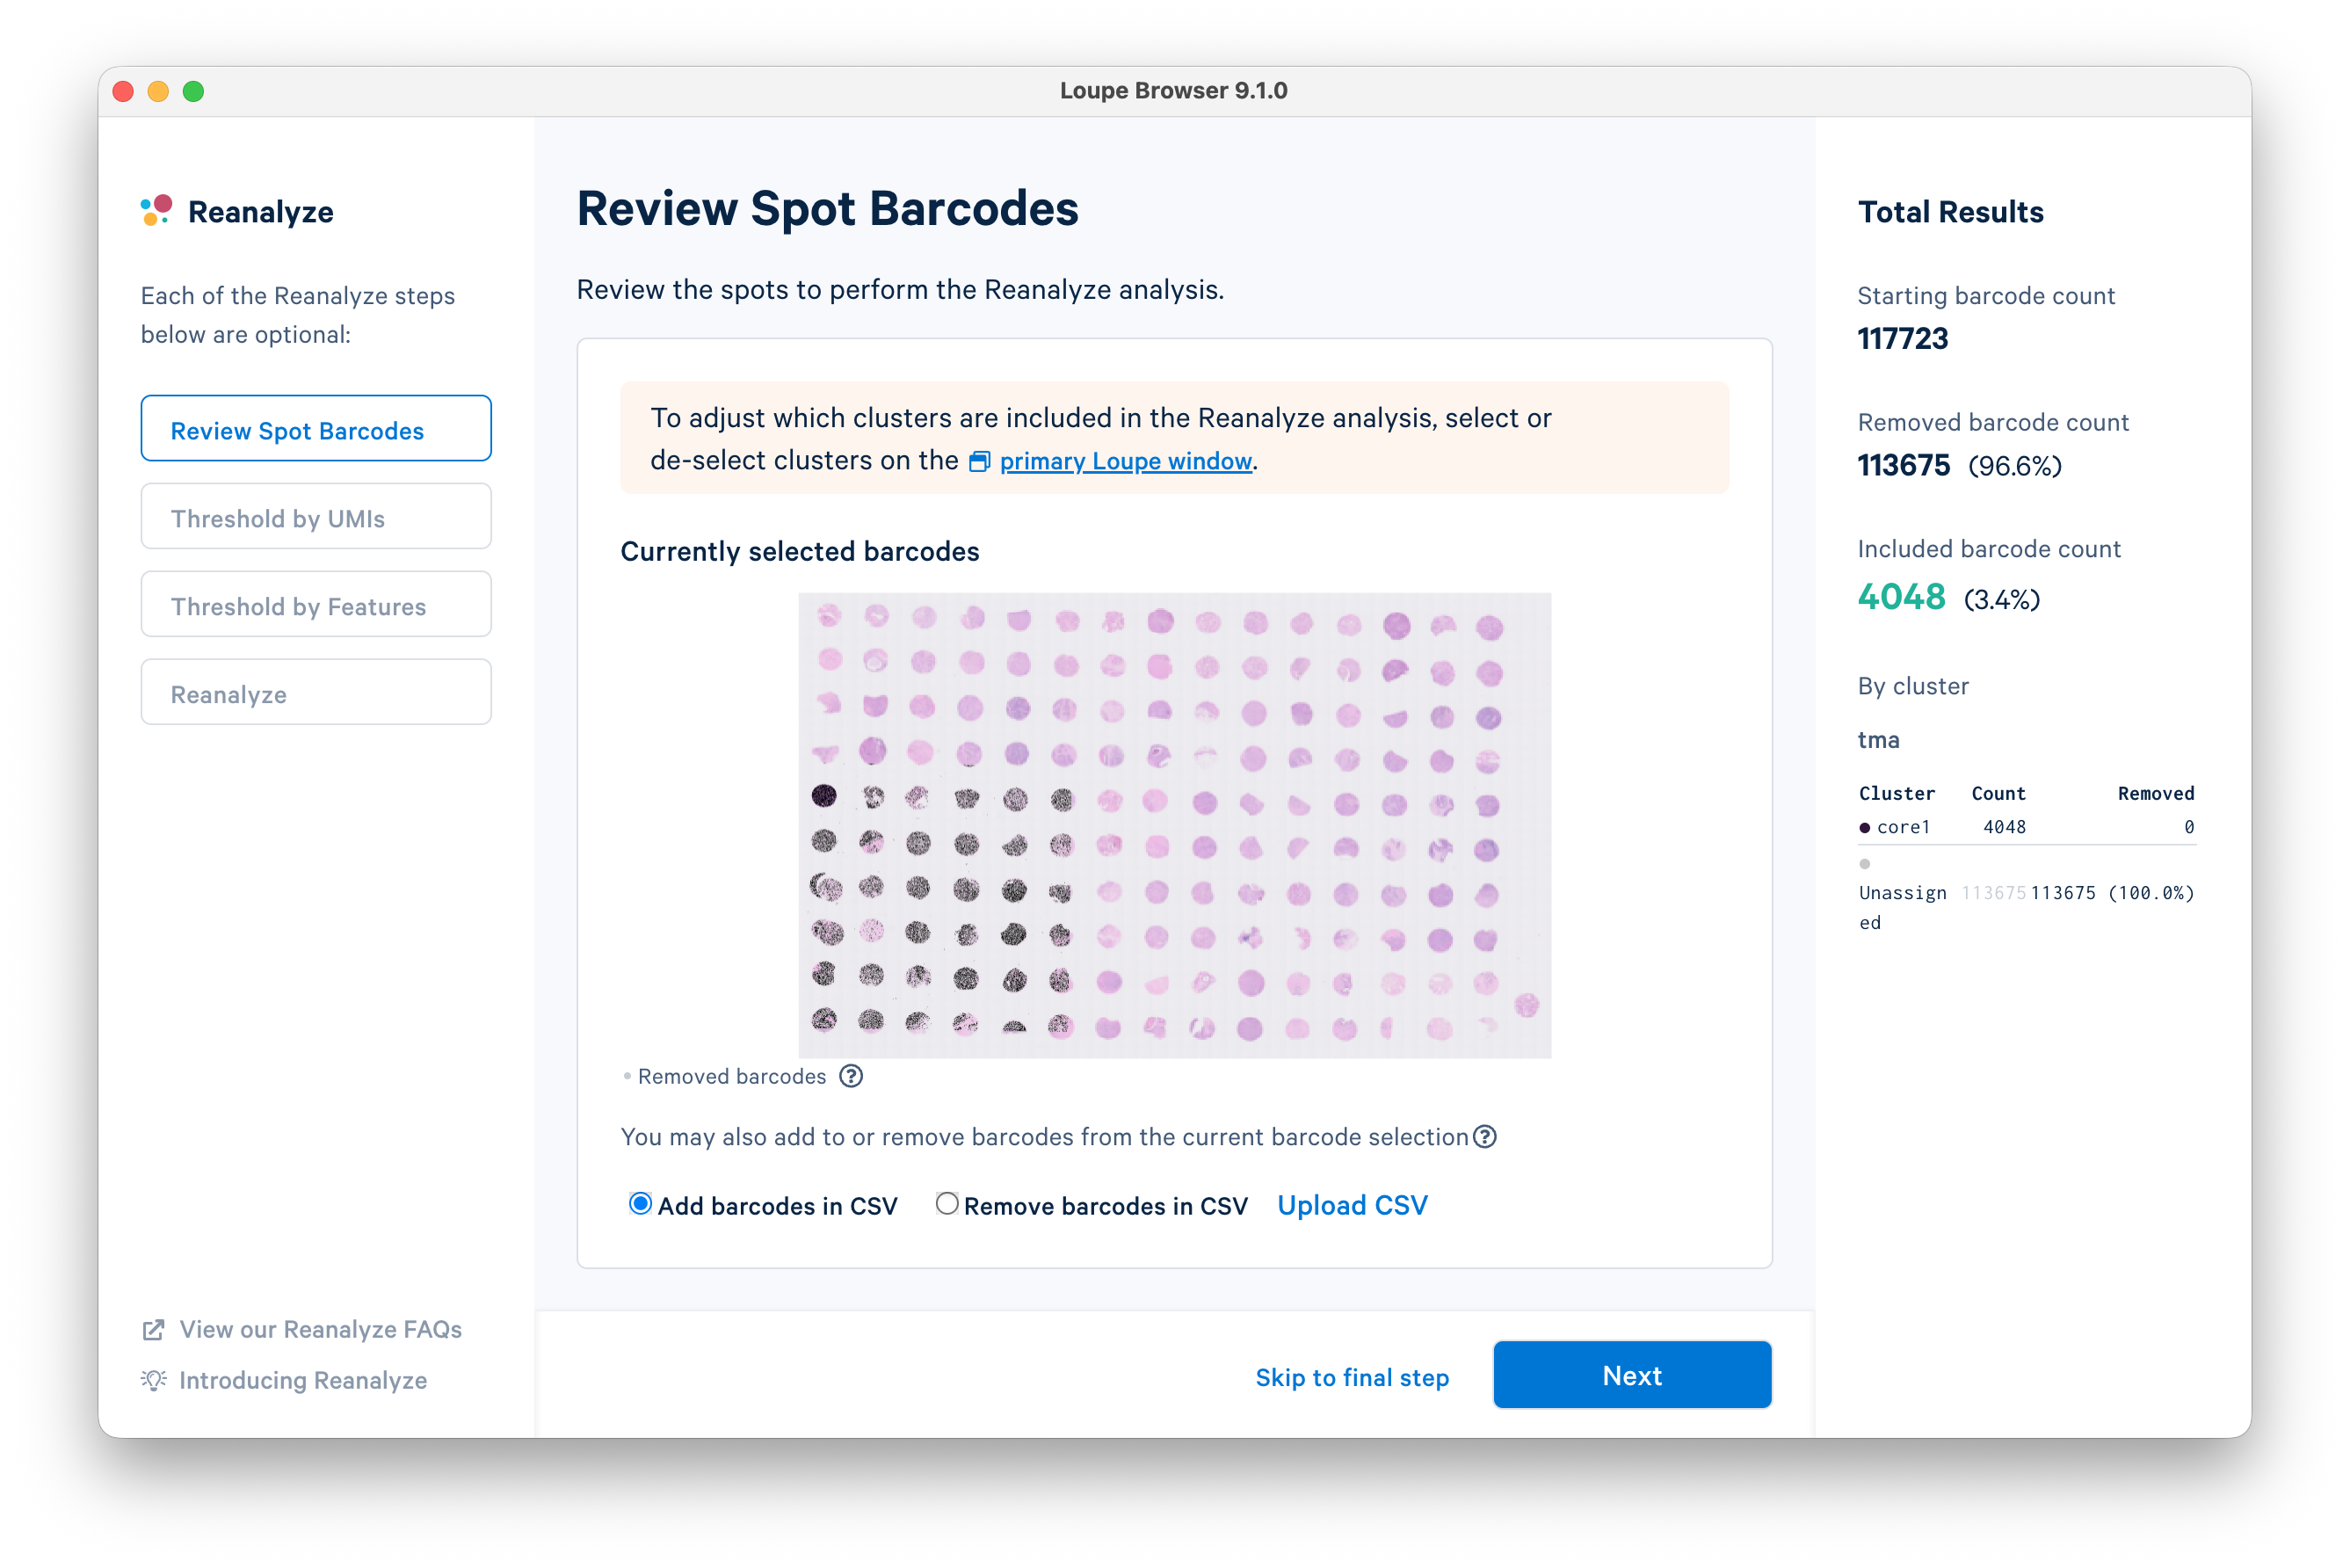
For the purposes of this tutorial, it is not necessary to review spot barcodes or threshold by UMIs/features. Click Skip to final step on the bottom of the window.
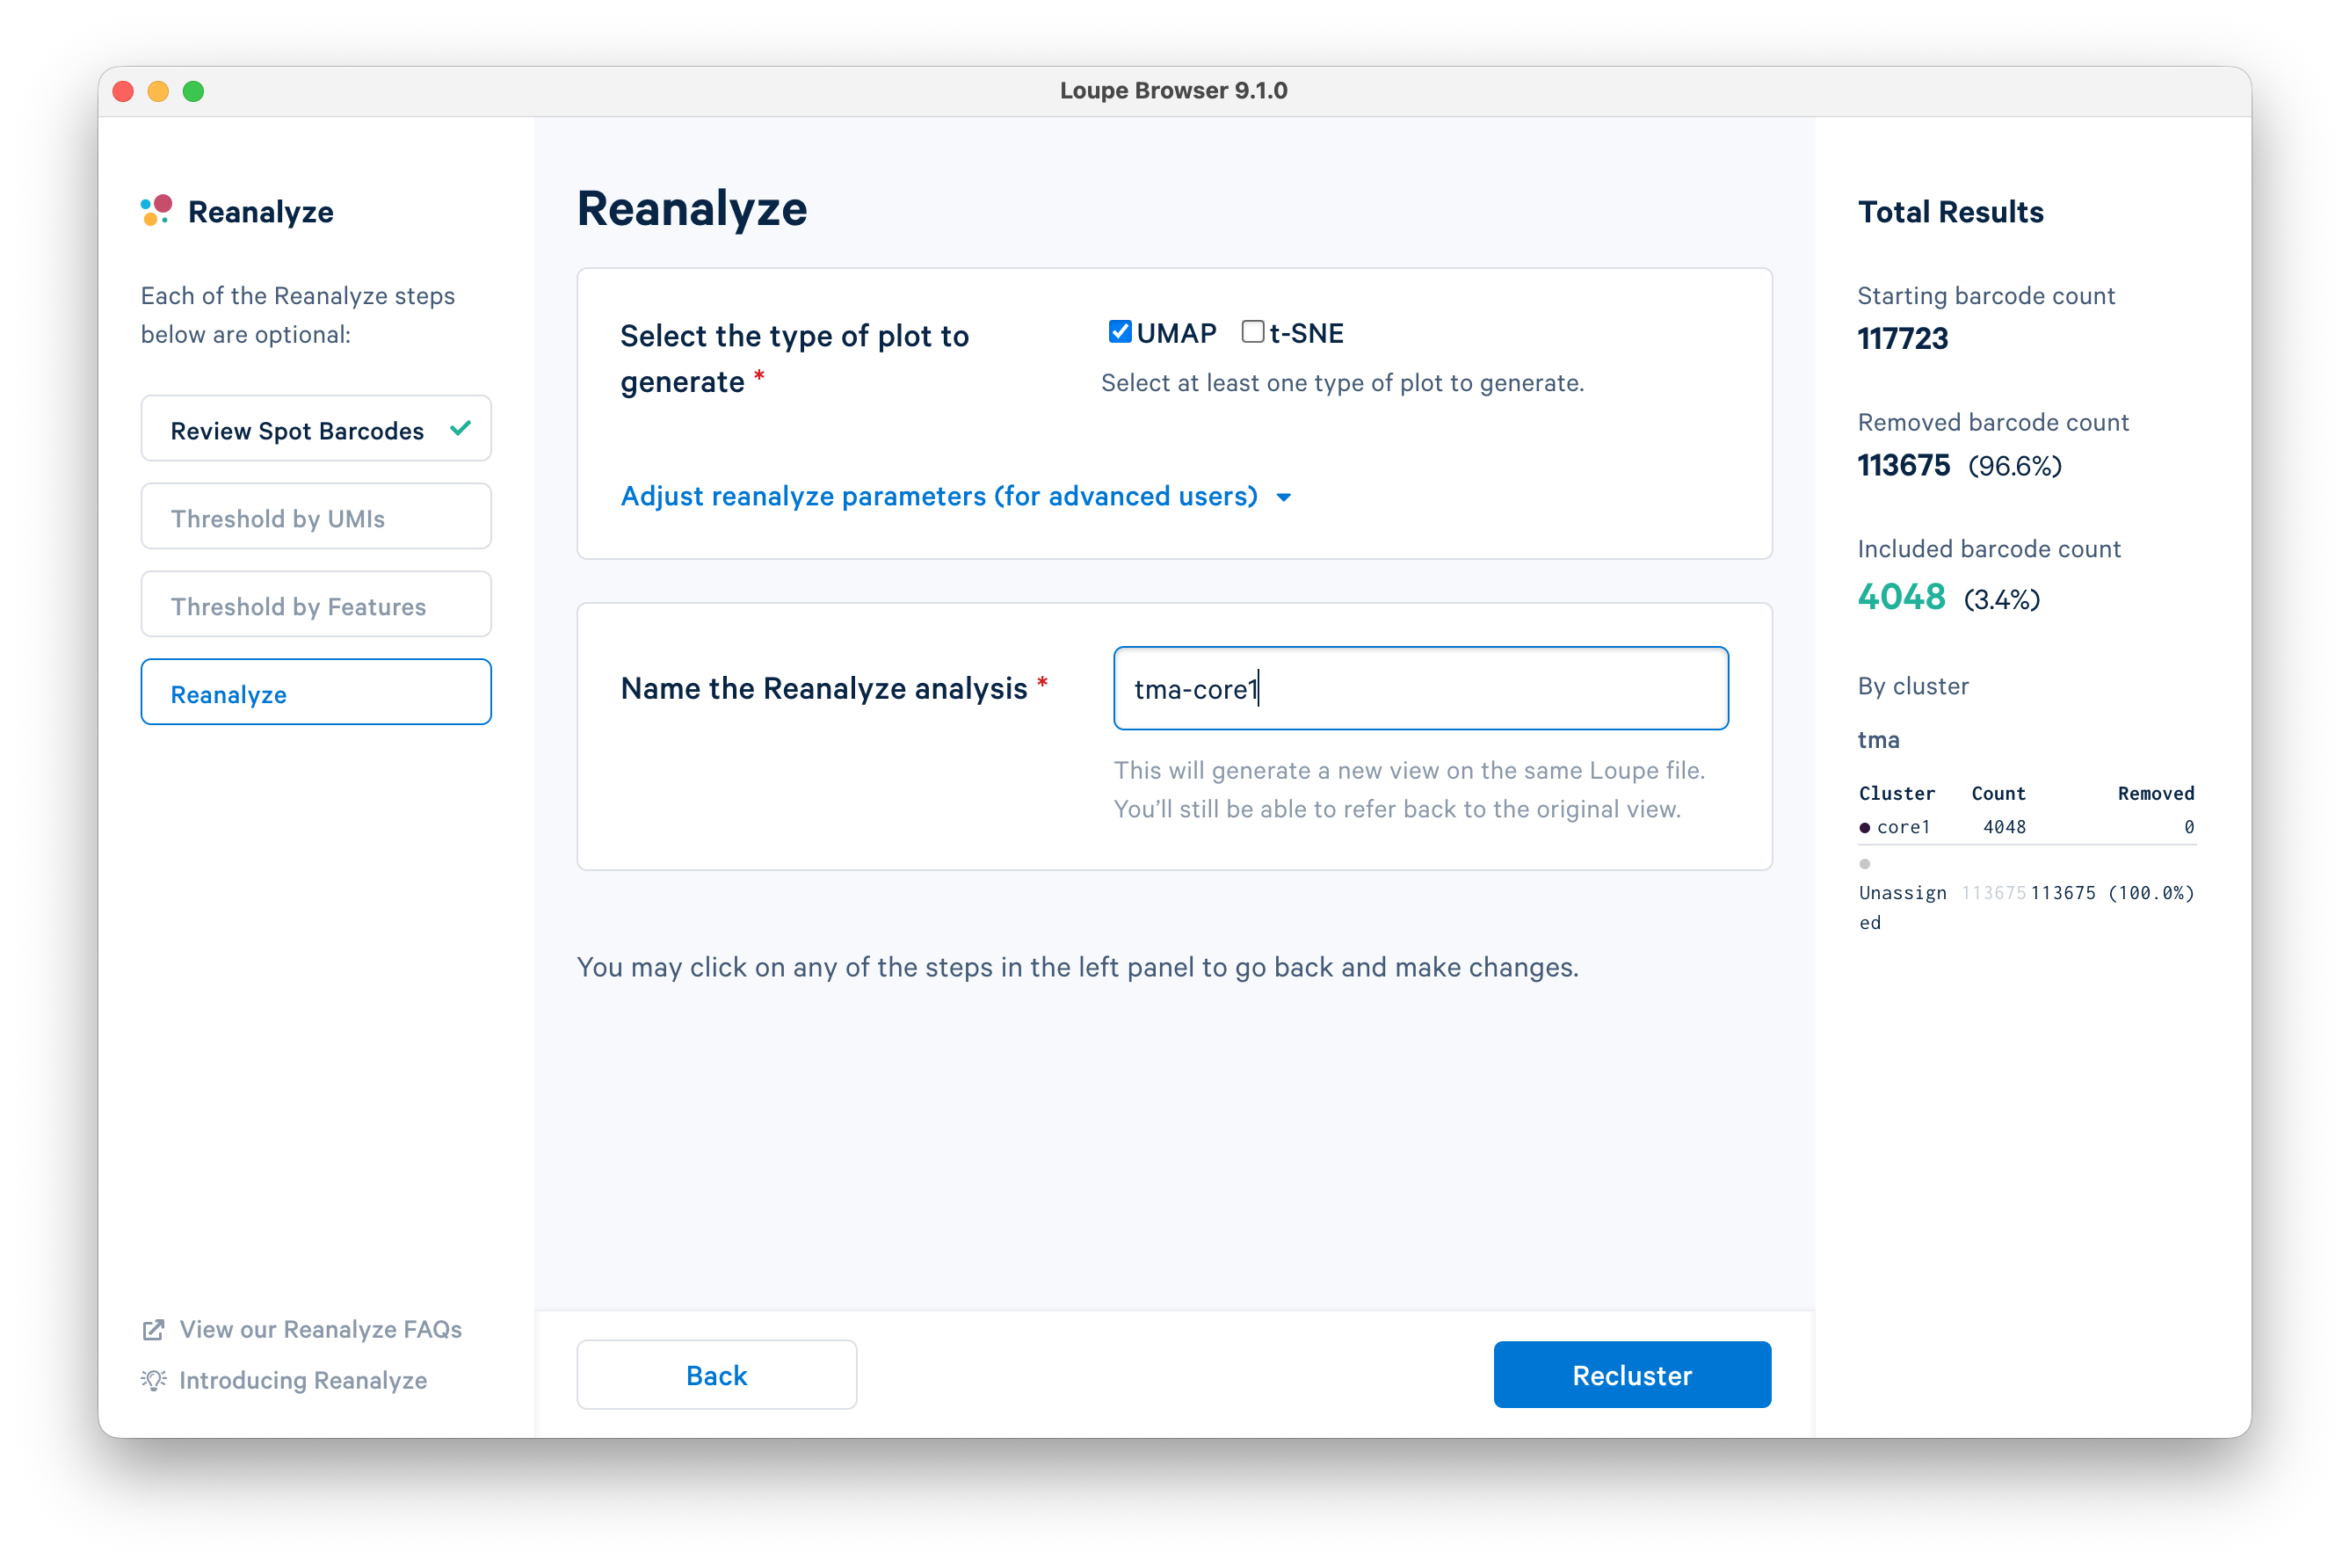
Name the analysis "tma-core1" and click Recluster.
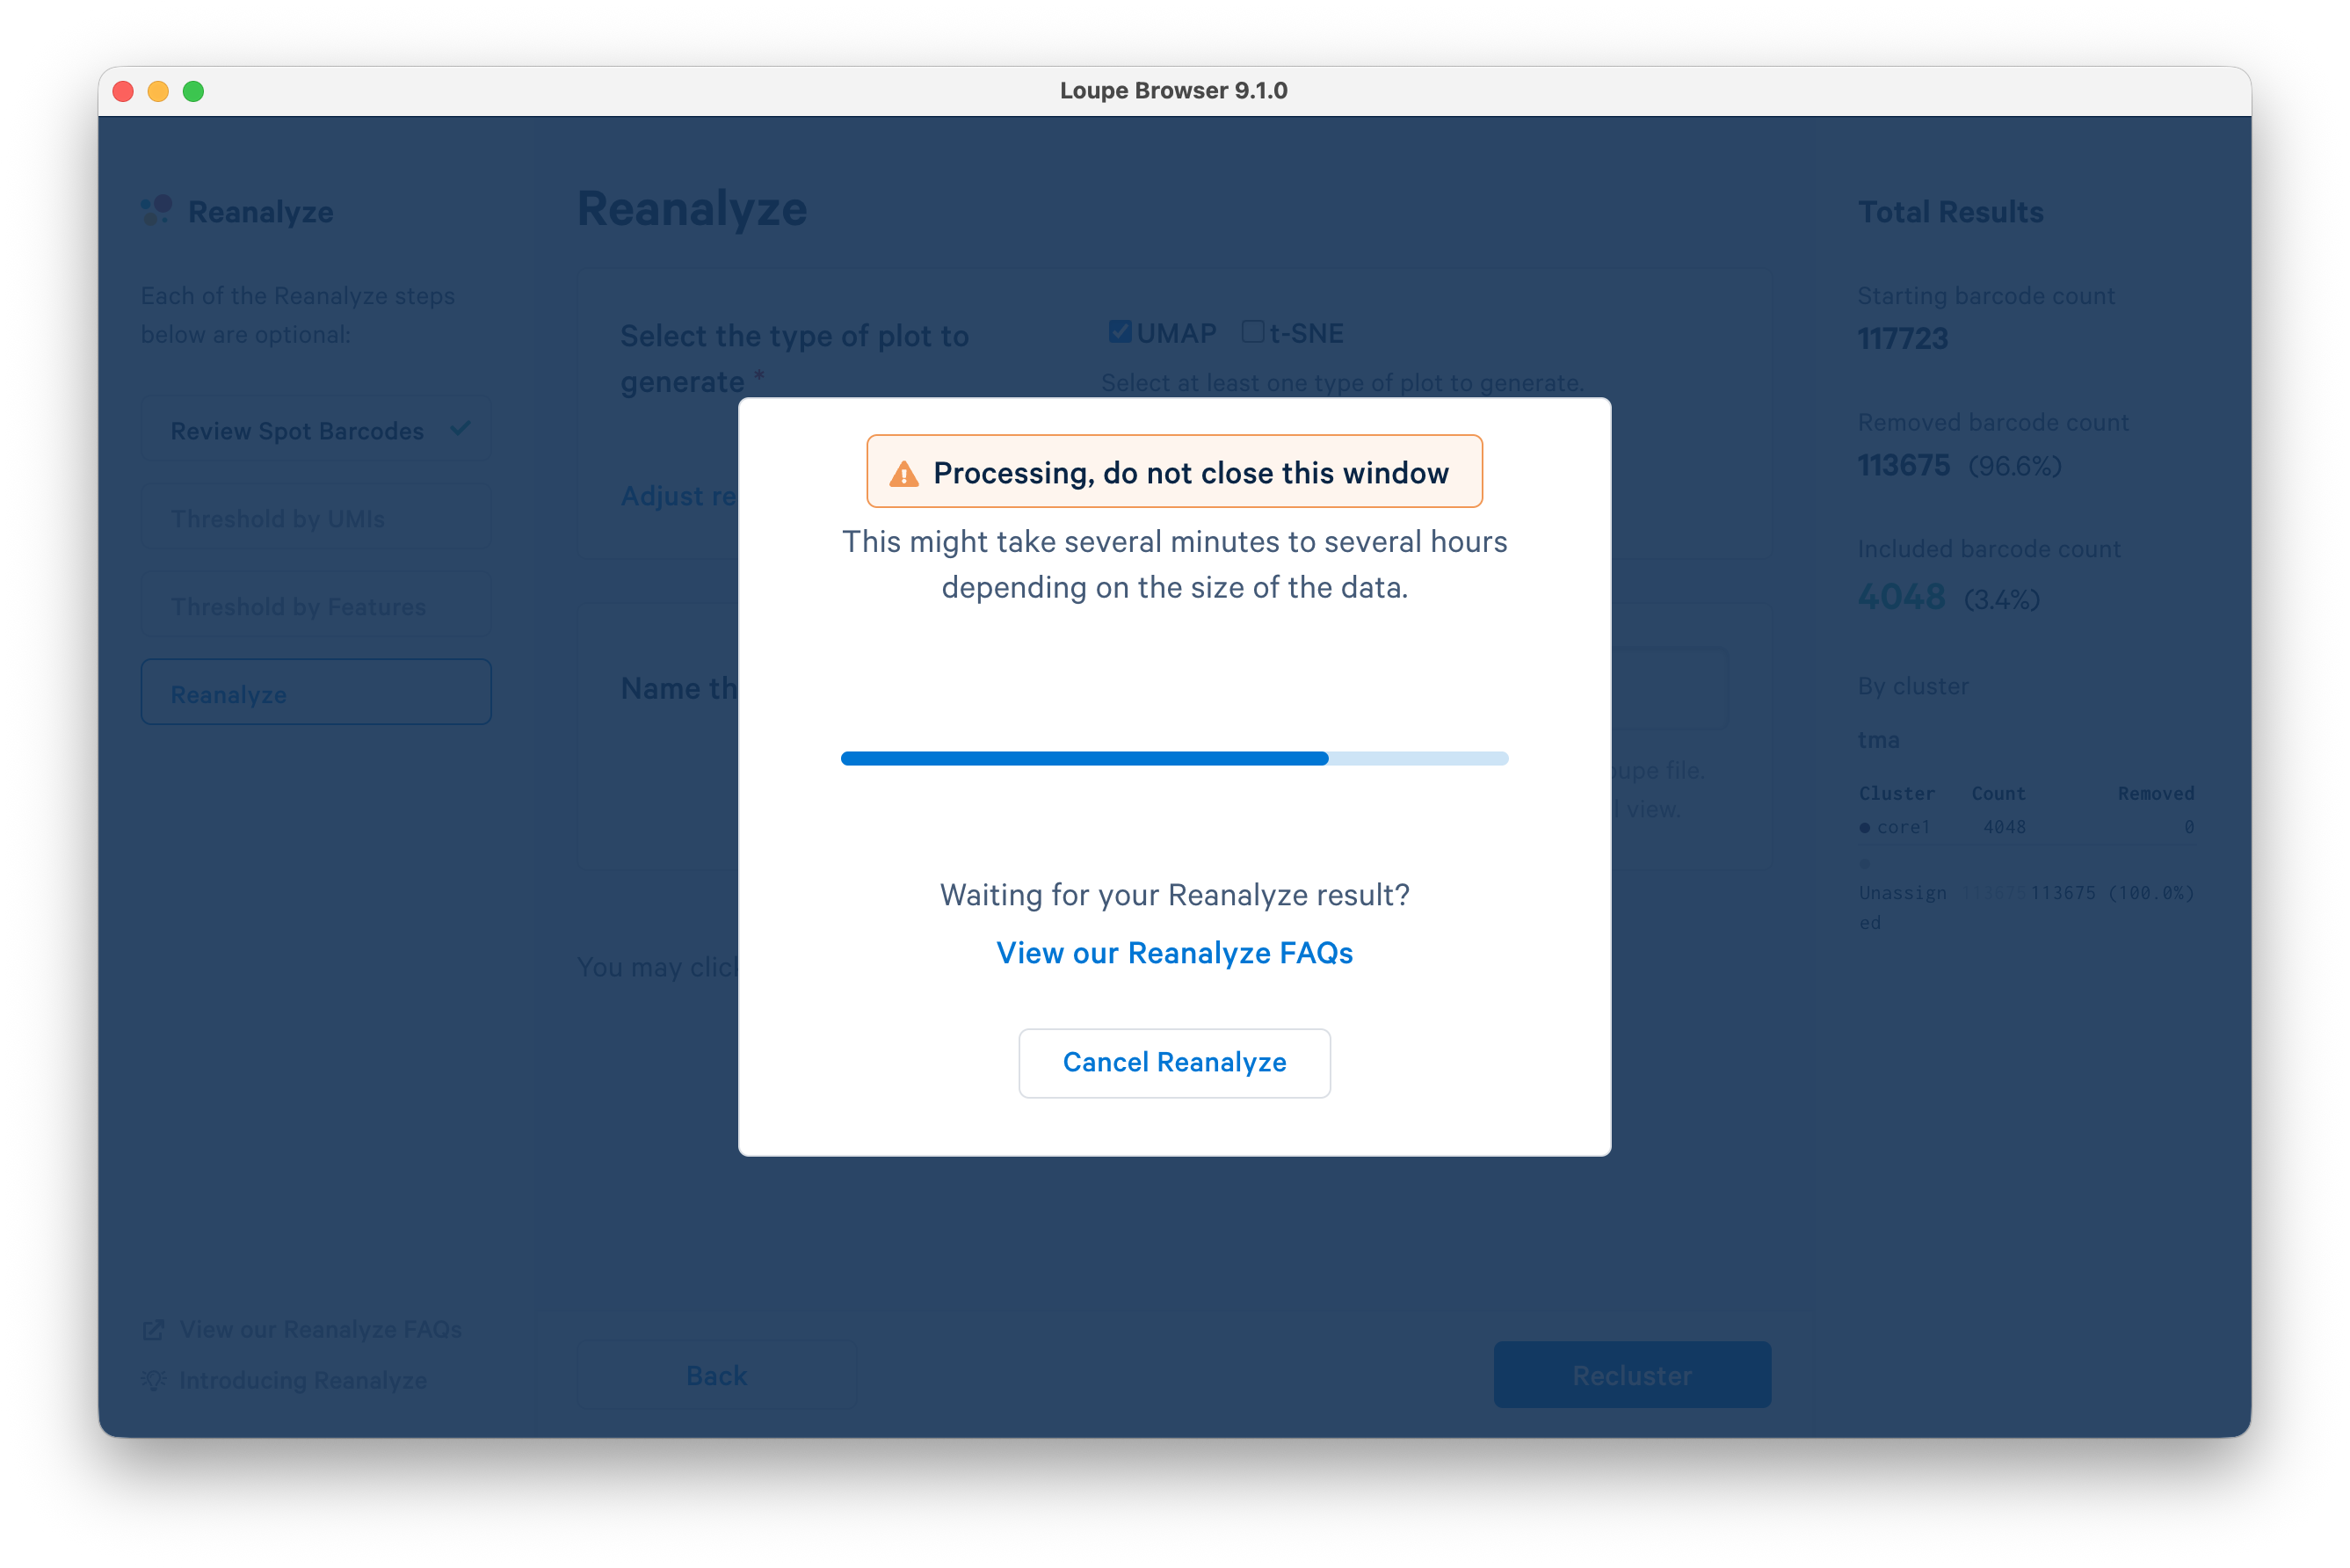
Do not close the window while the analysis is processing.
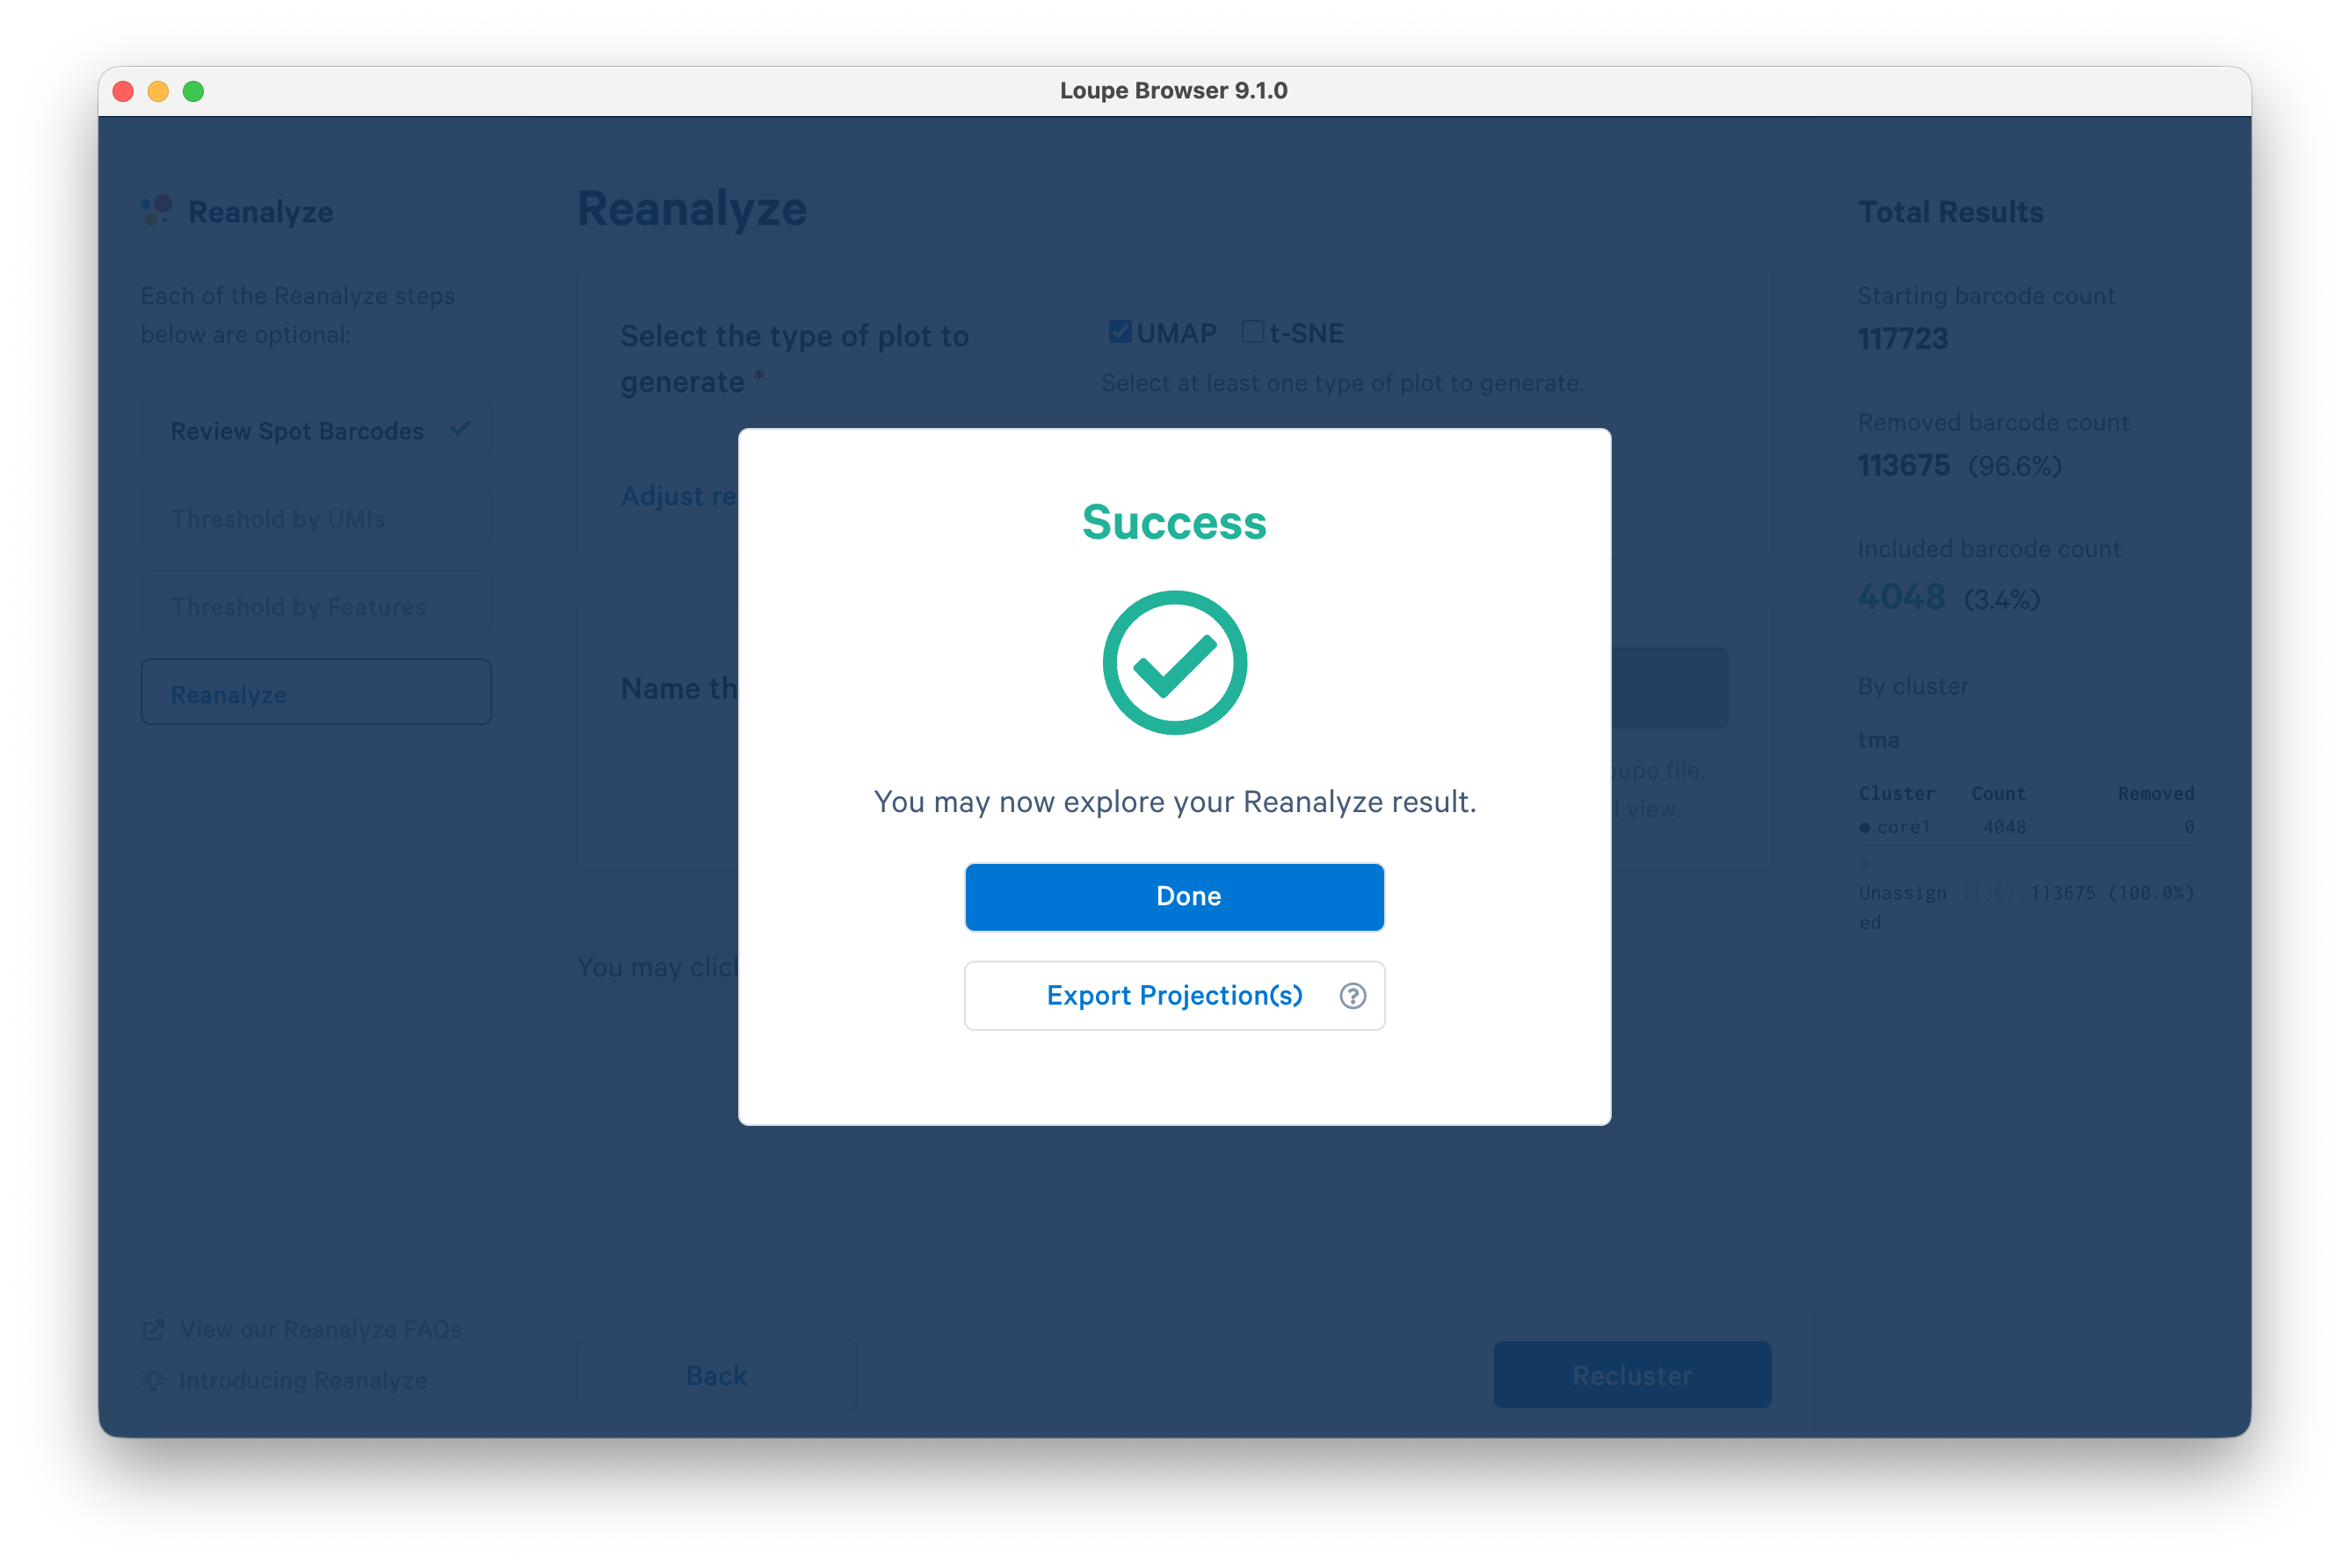
When processing completes, click Done.
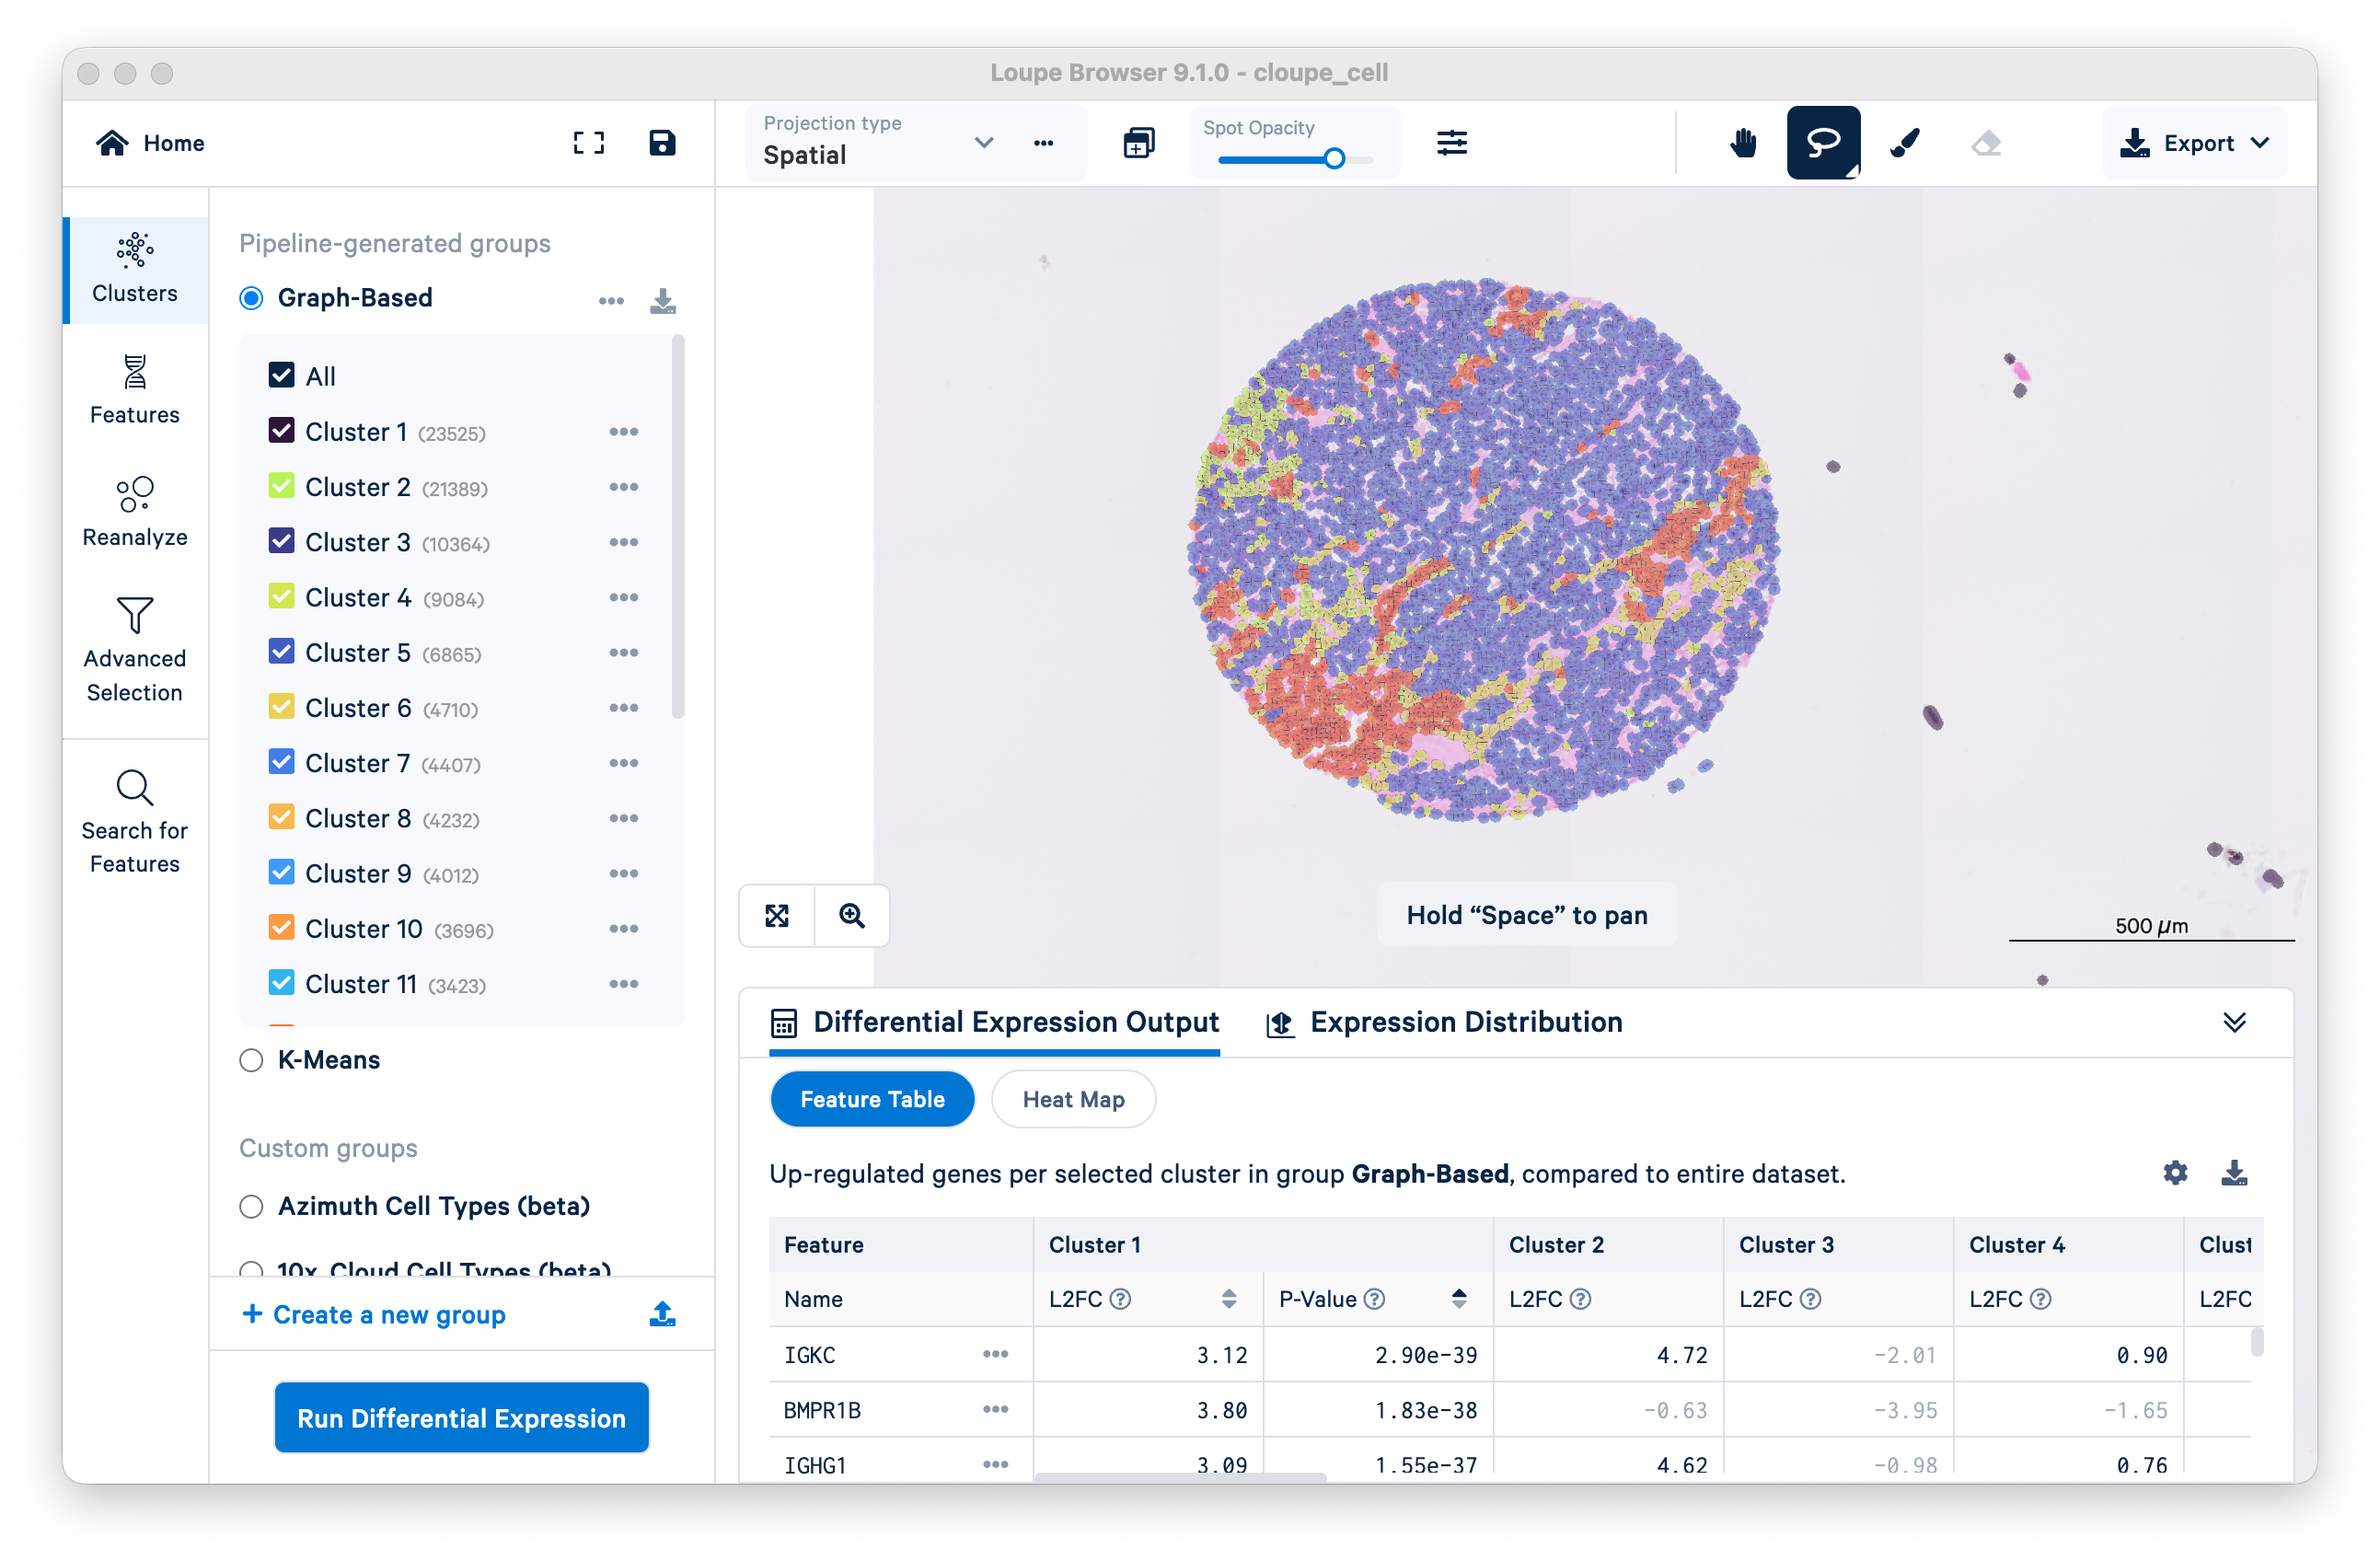
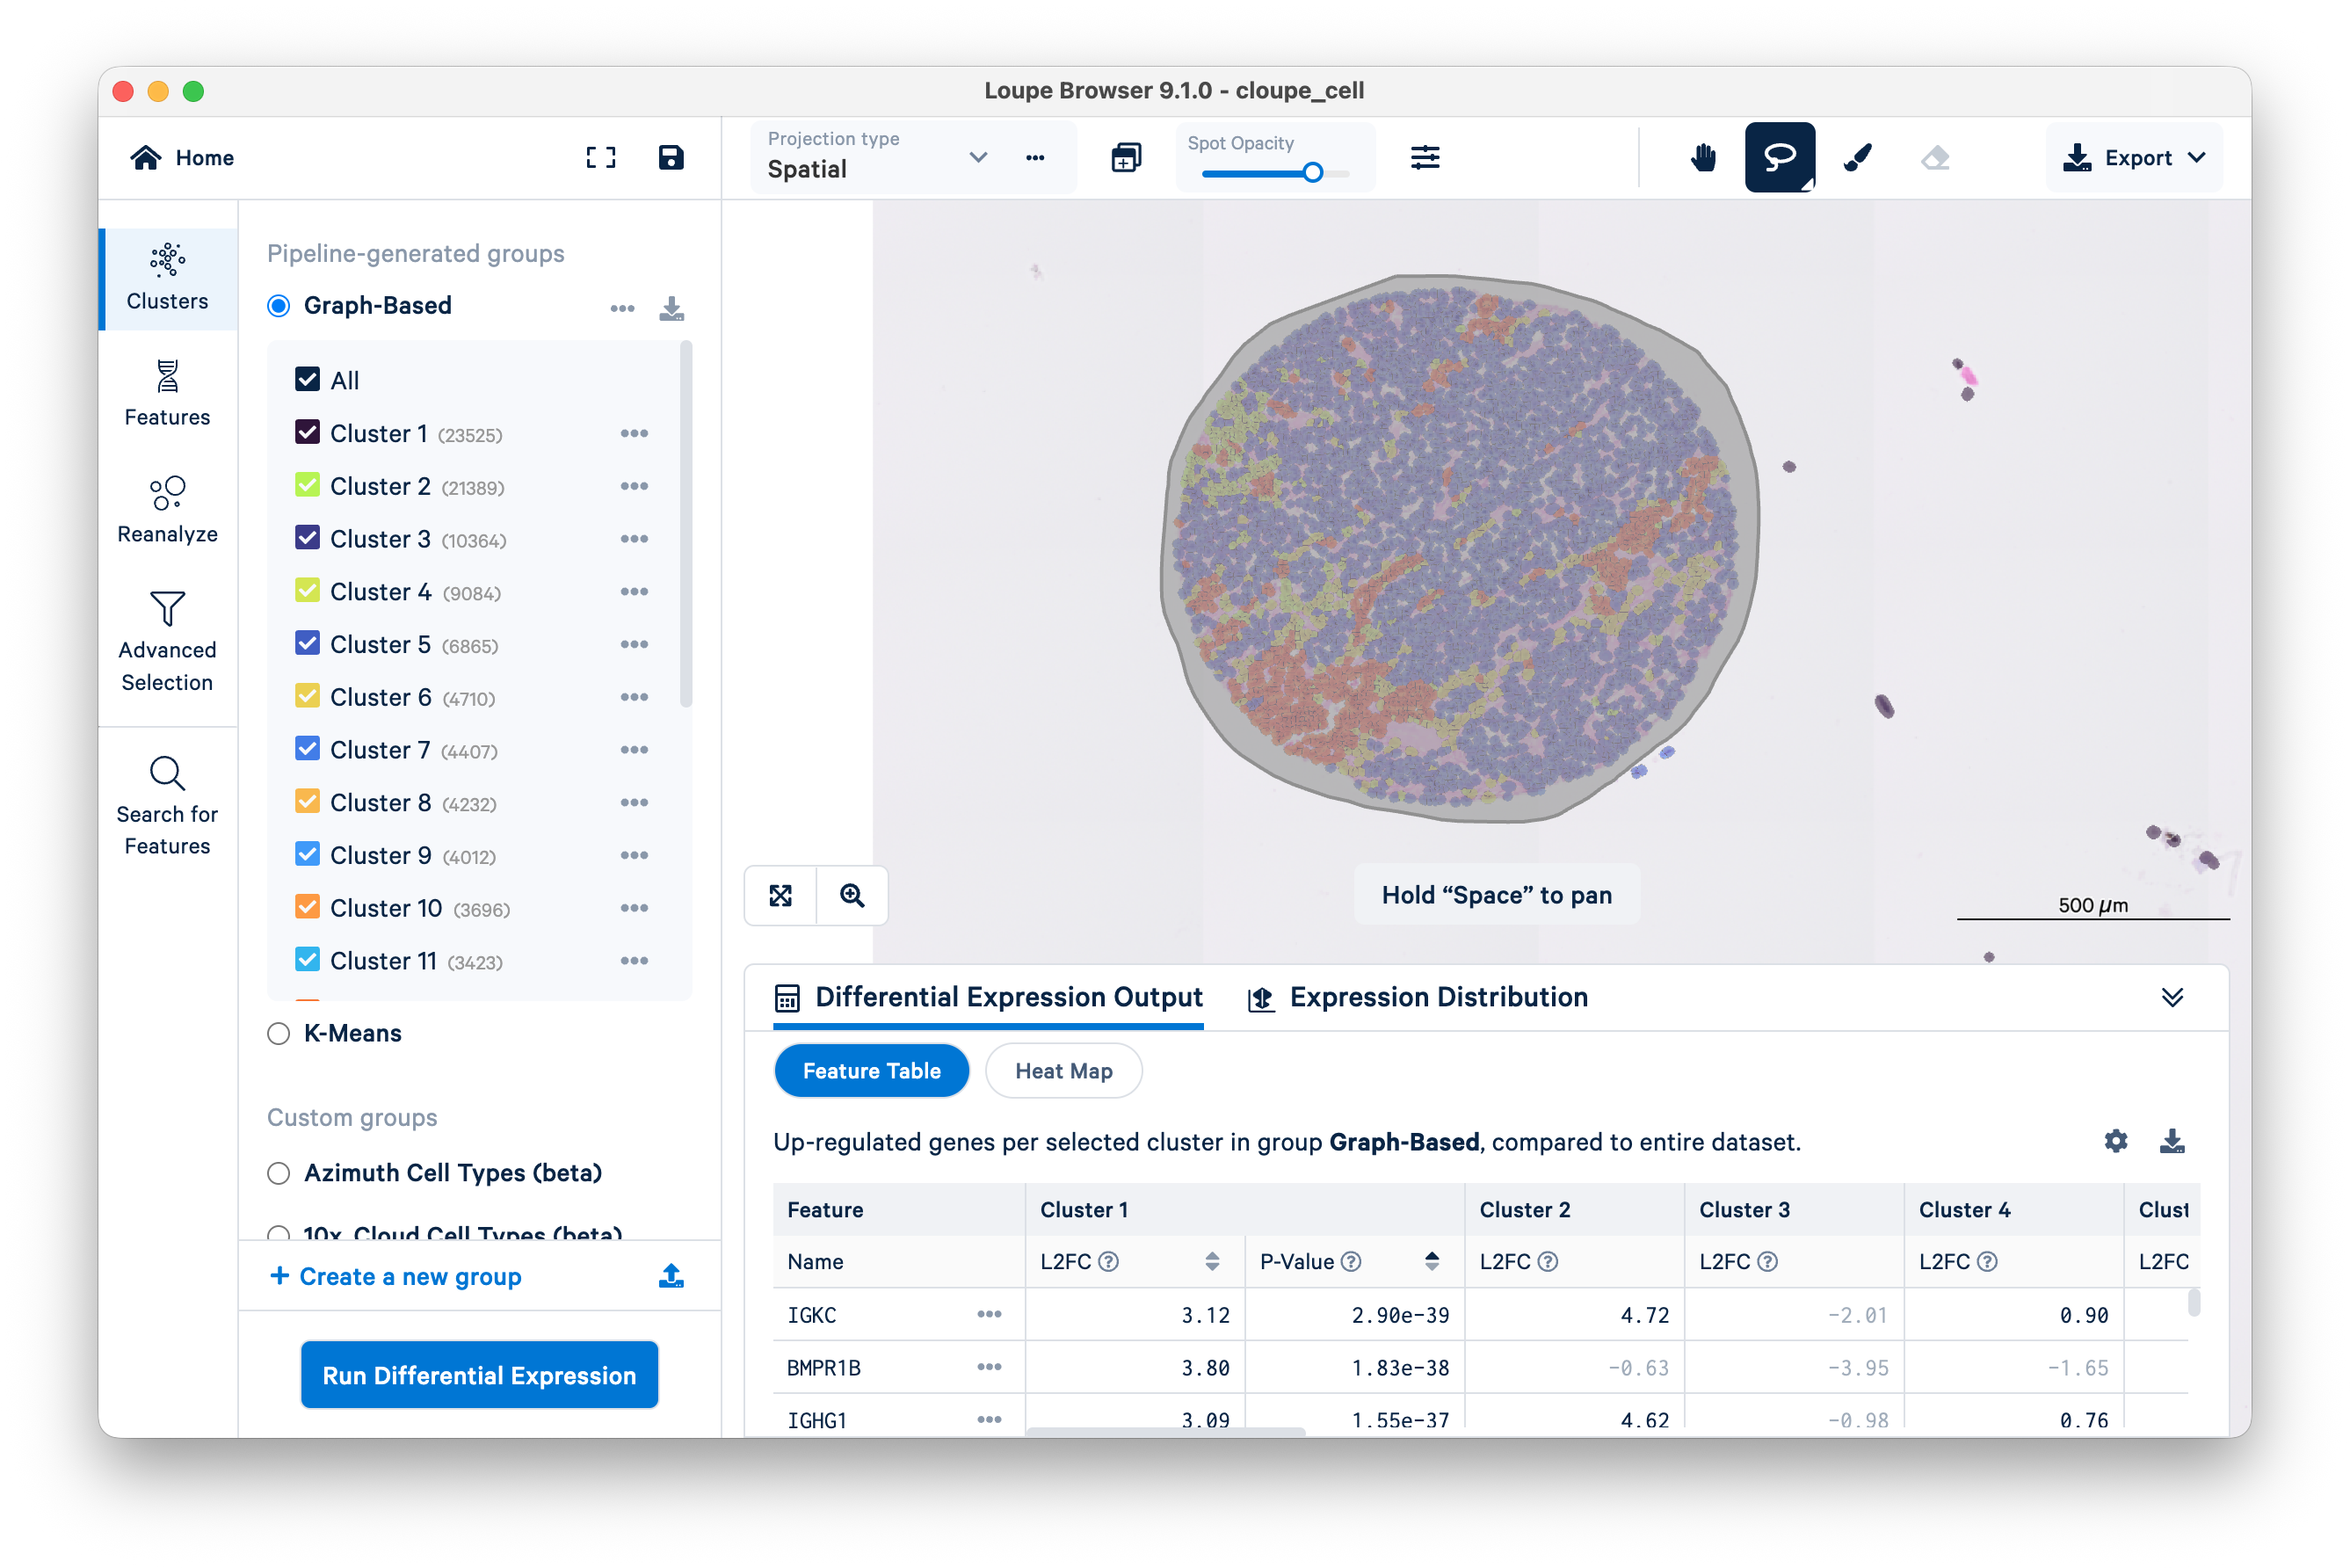
A UMAP plot is shown for the reanalyzed core. To see the spatial view, select Spatial from the drop-down menu for "tma-core1".
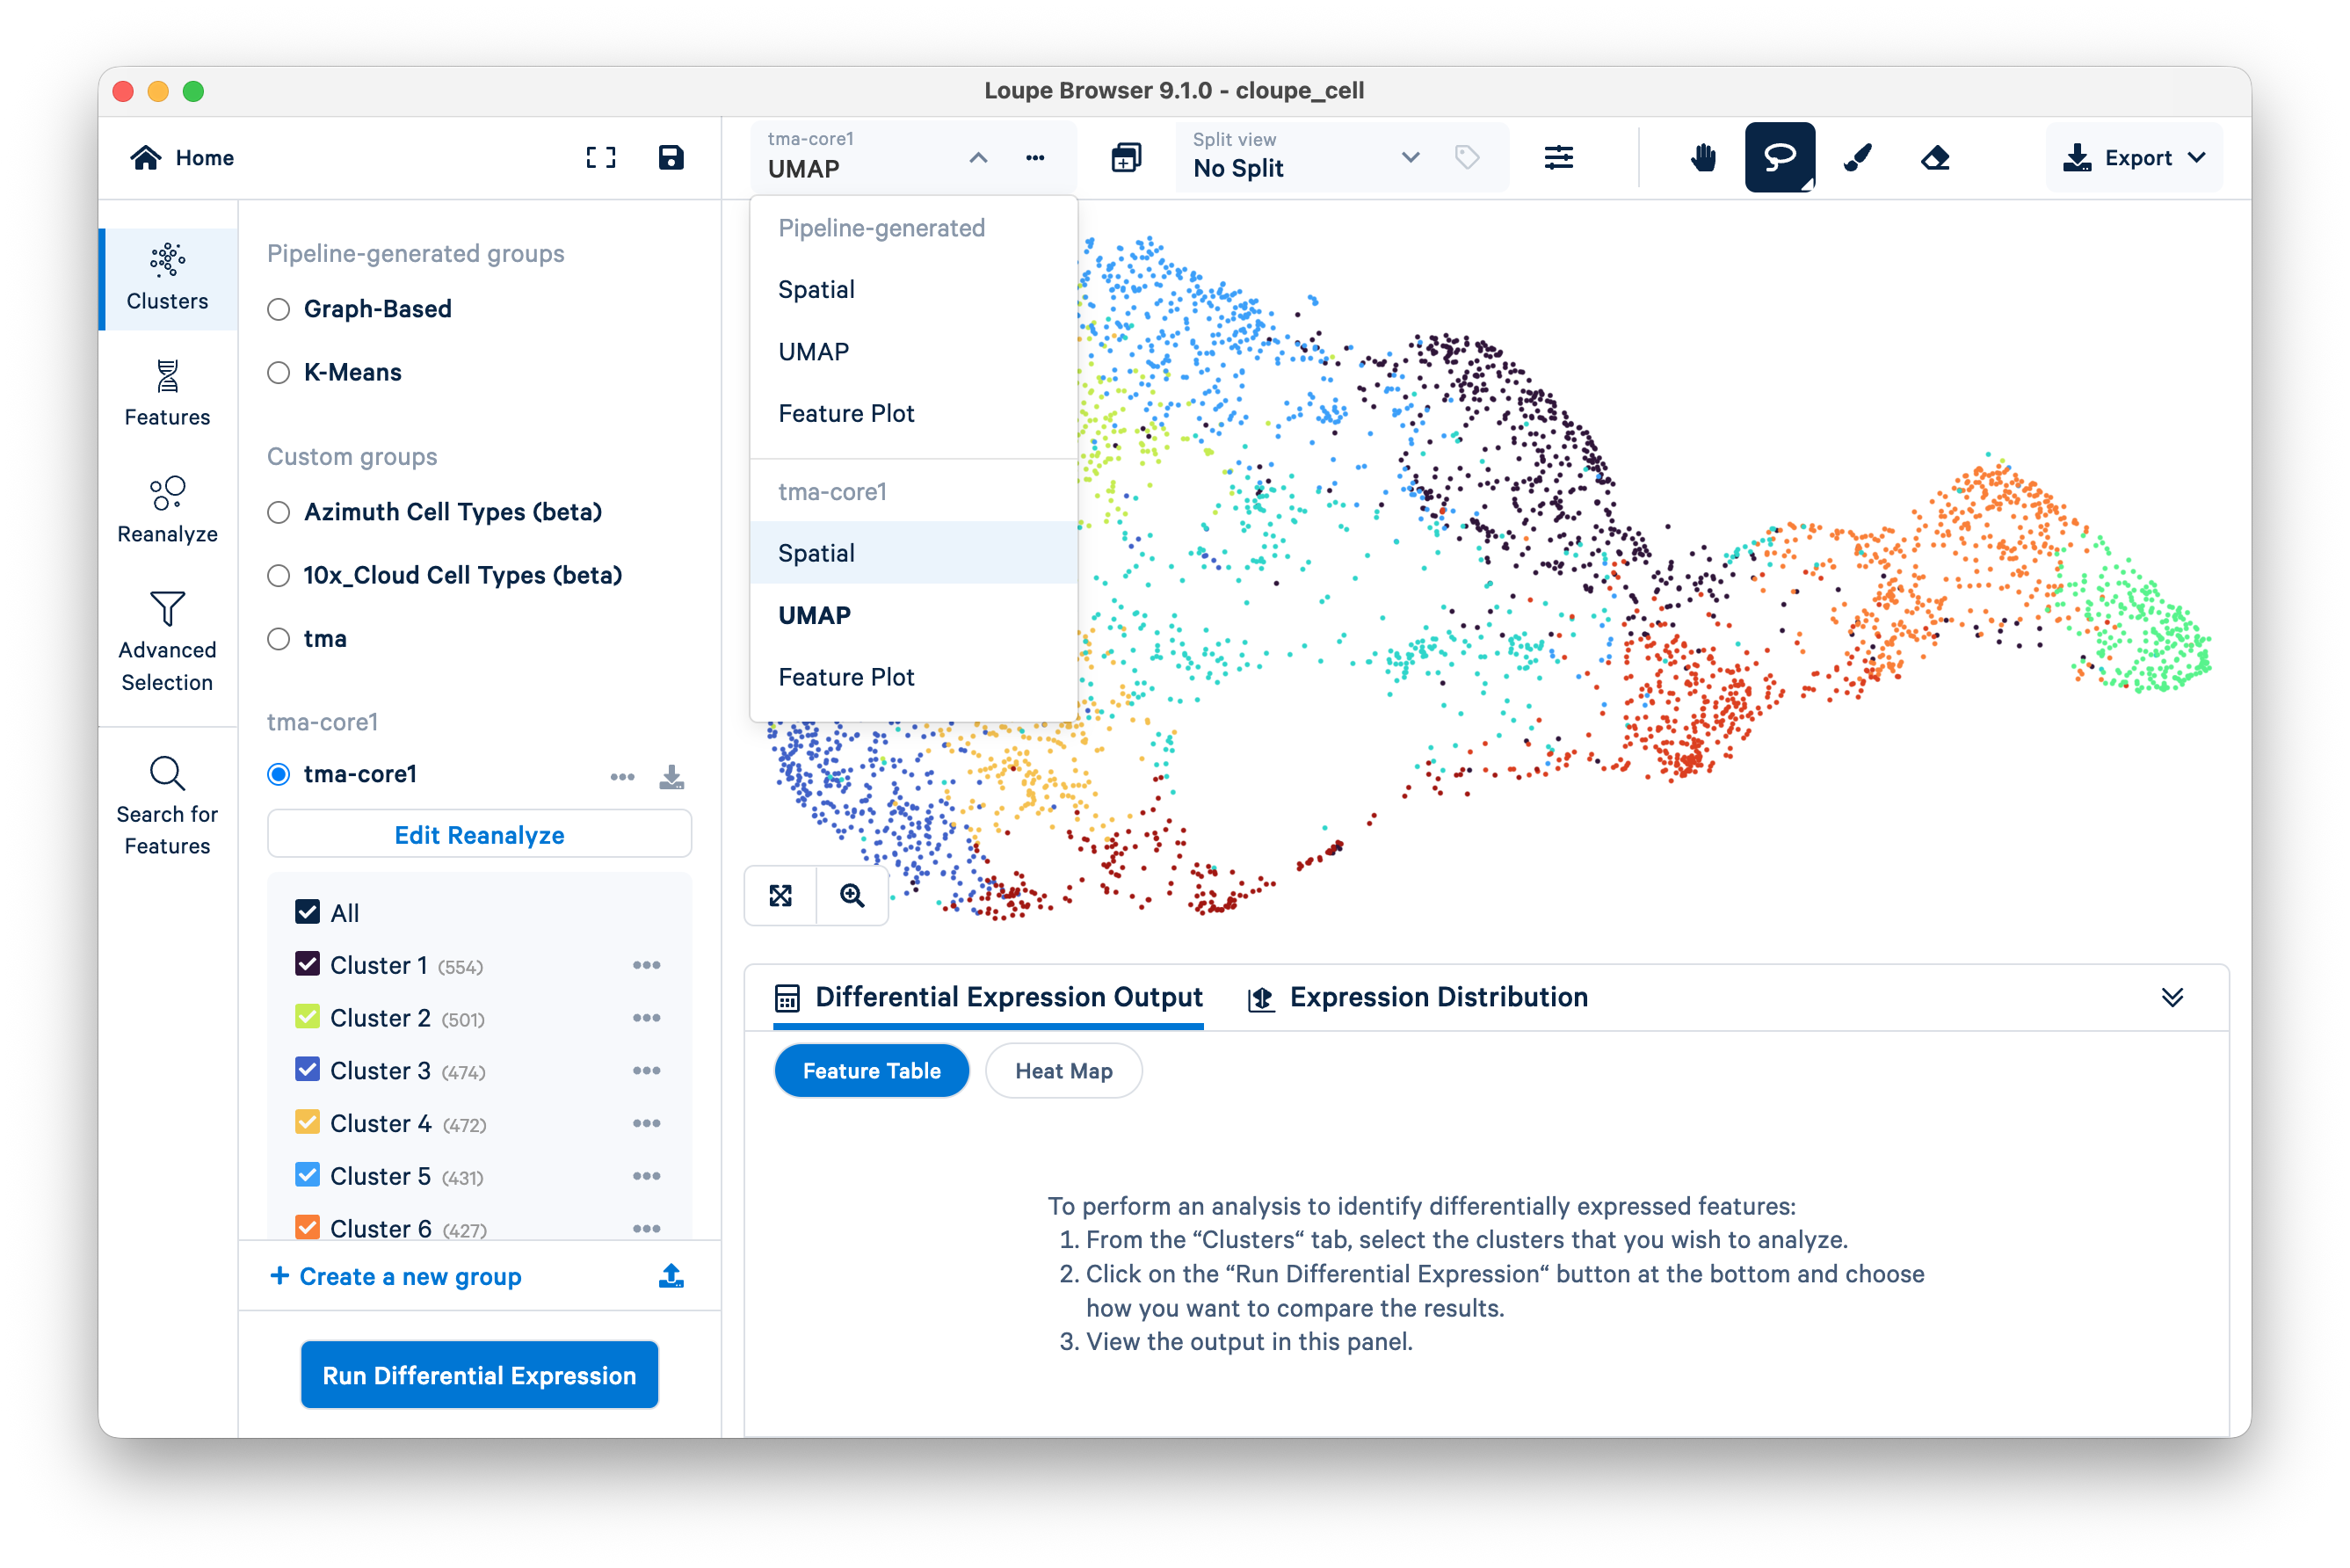
You can now visualize the reclustered data for the single tissue core overlaid on the H&E image. In the screenshot below, color saturation for the H&E image has been reduced to 0% and spot opacity has been increased to 100% to emphasize that the displayed clusters are specific to the core selected earlier.
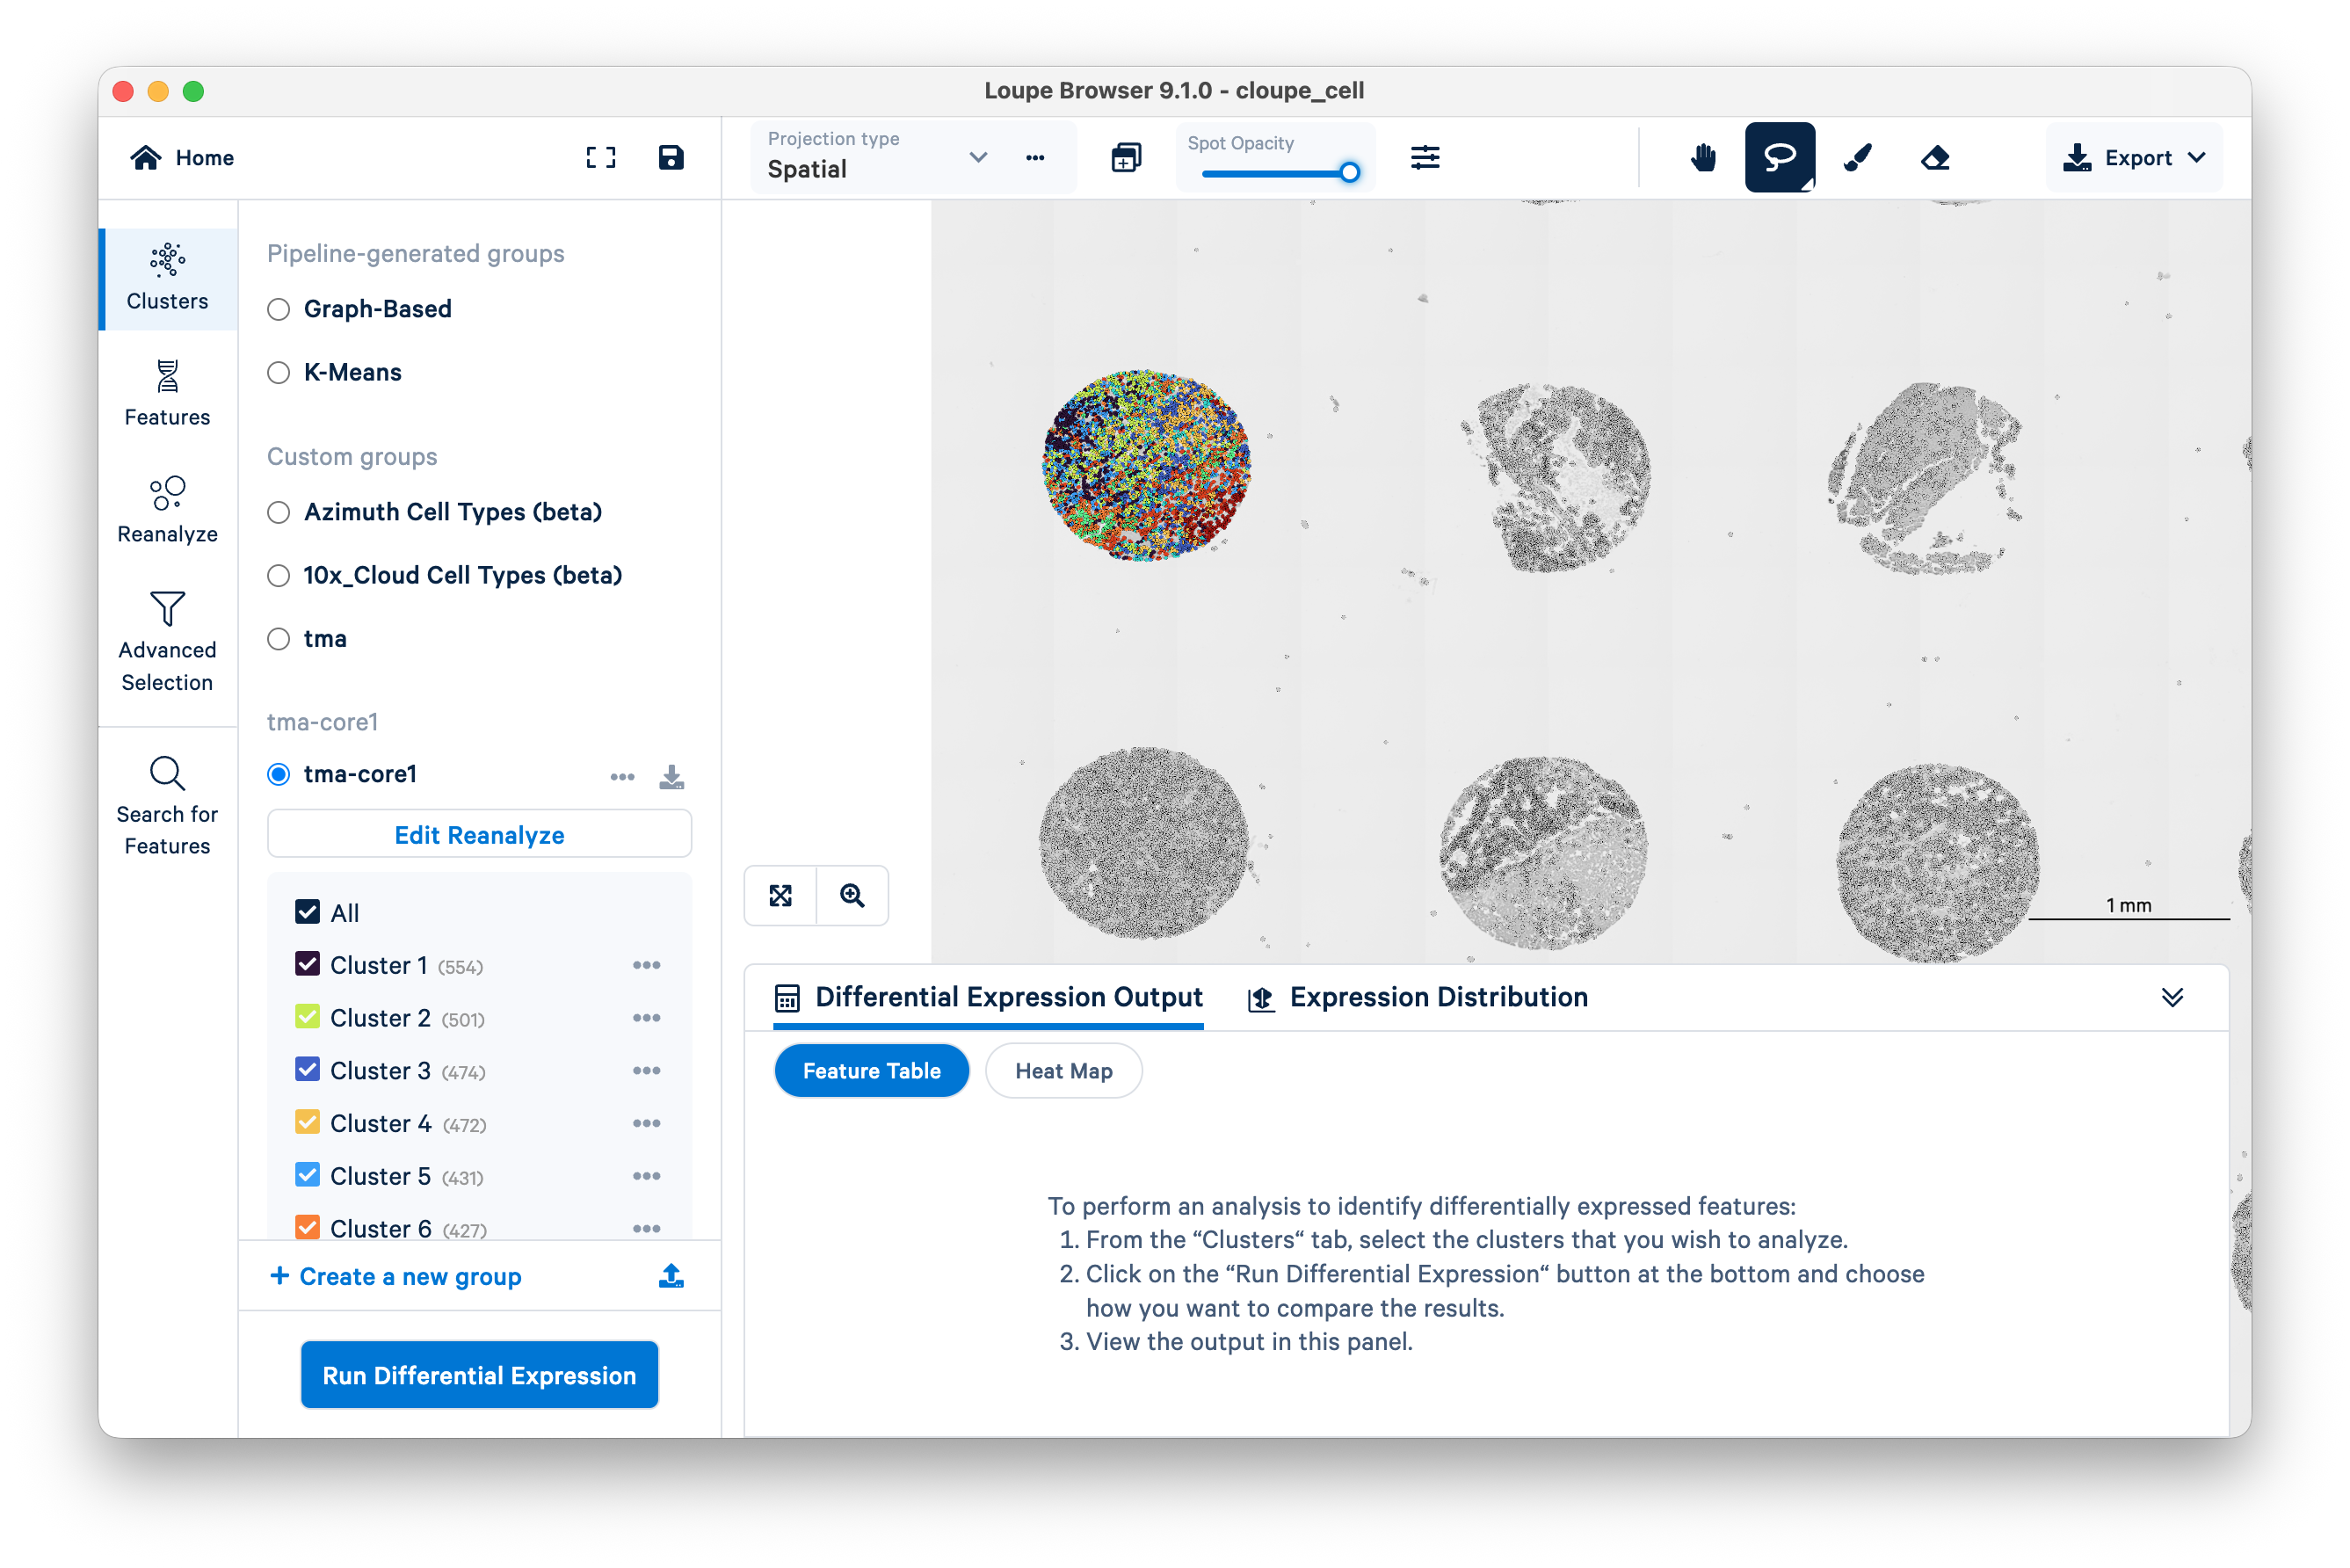
You may now proceed to further analyze the selected tissue core in Loupe Browser.
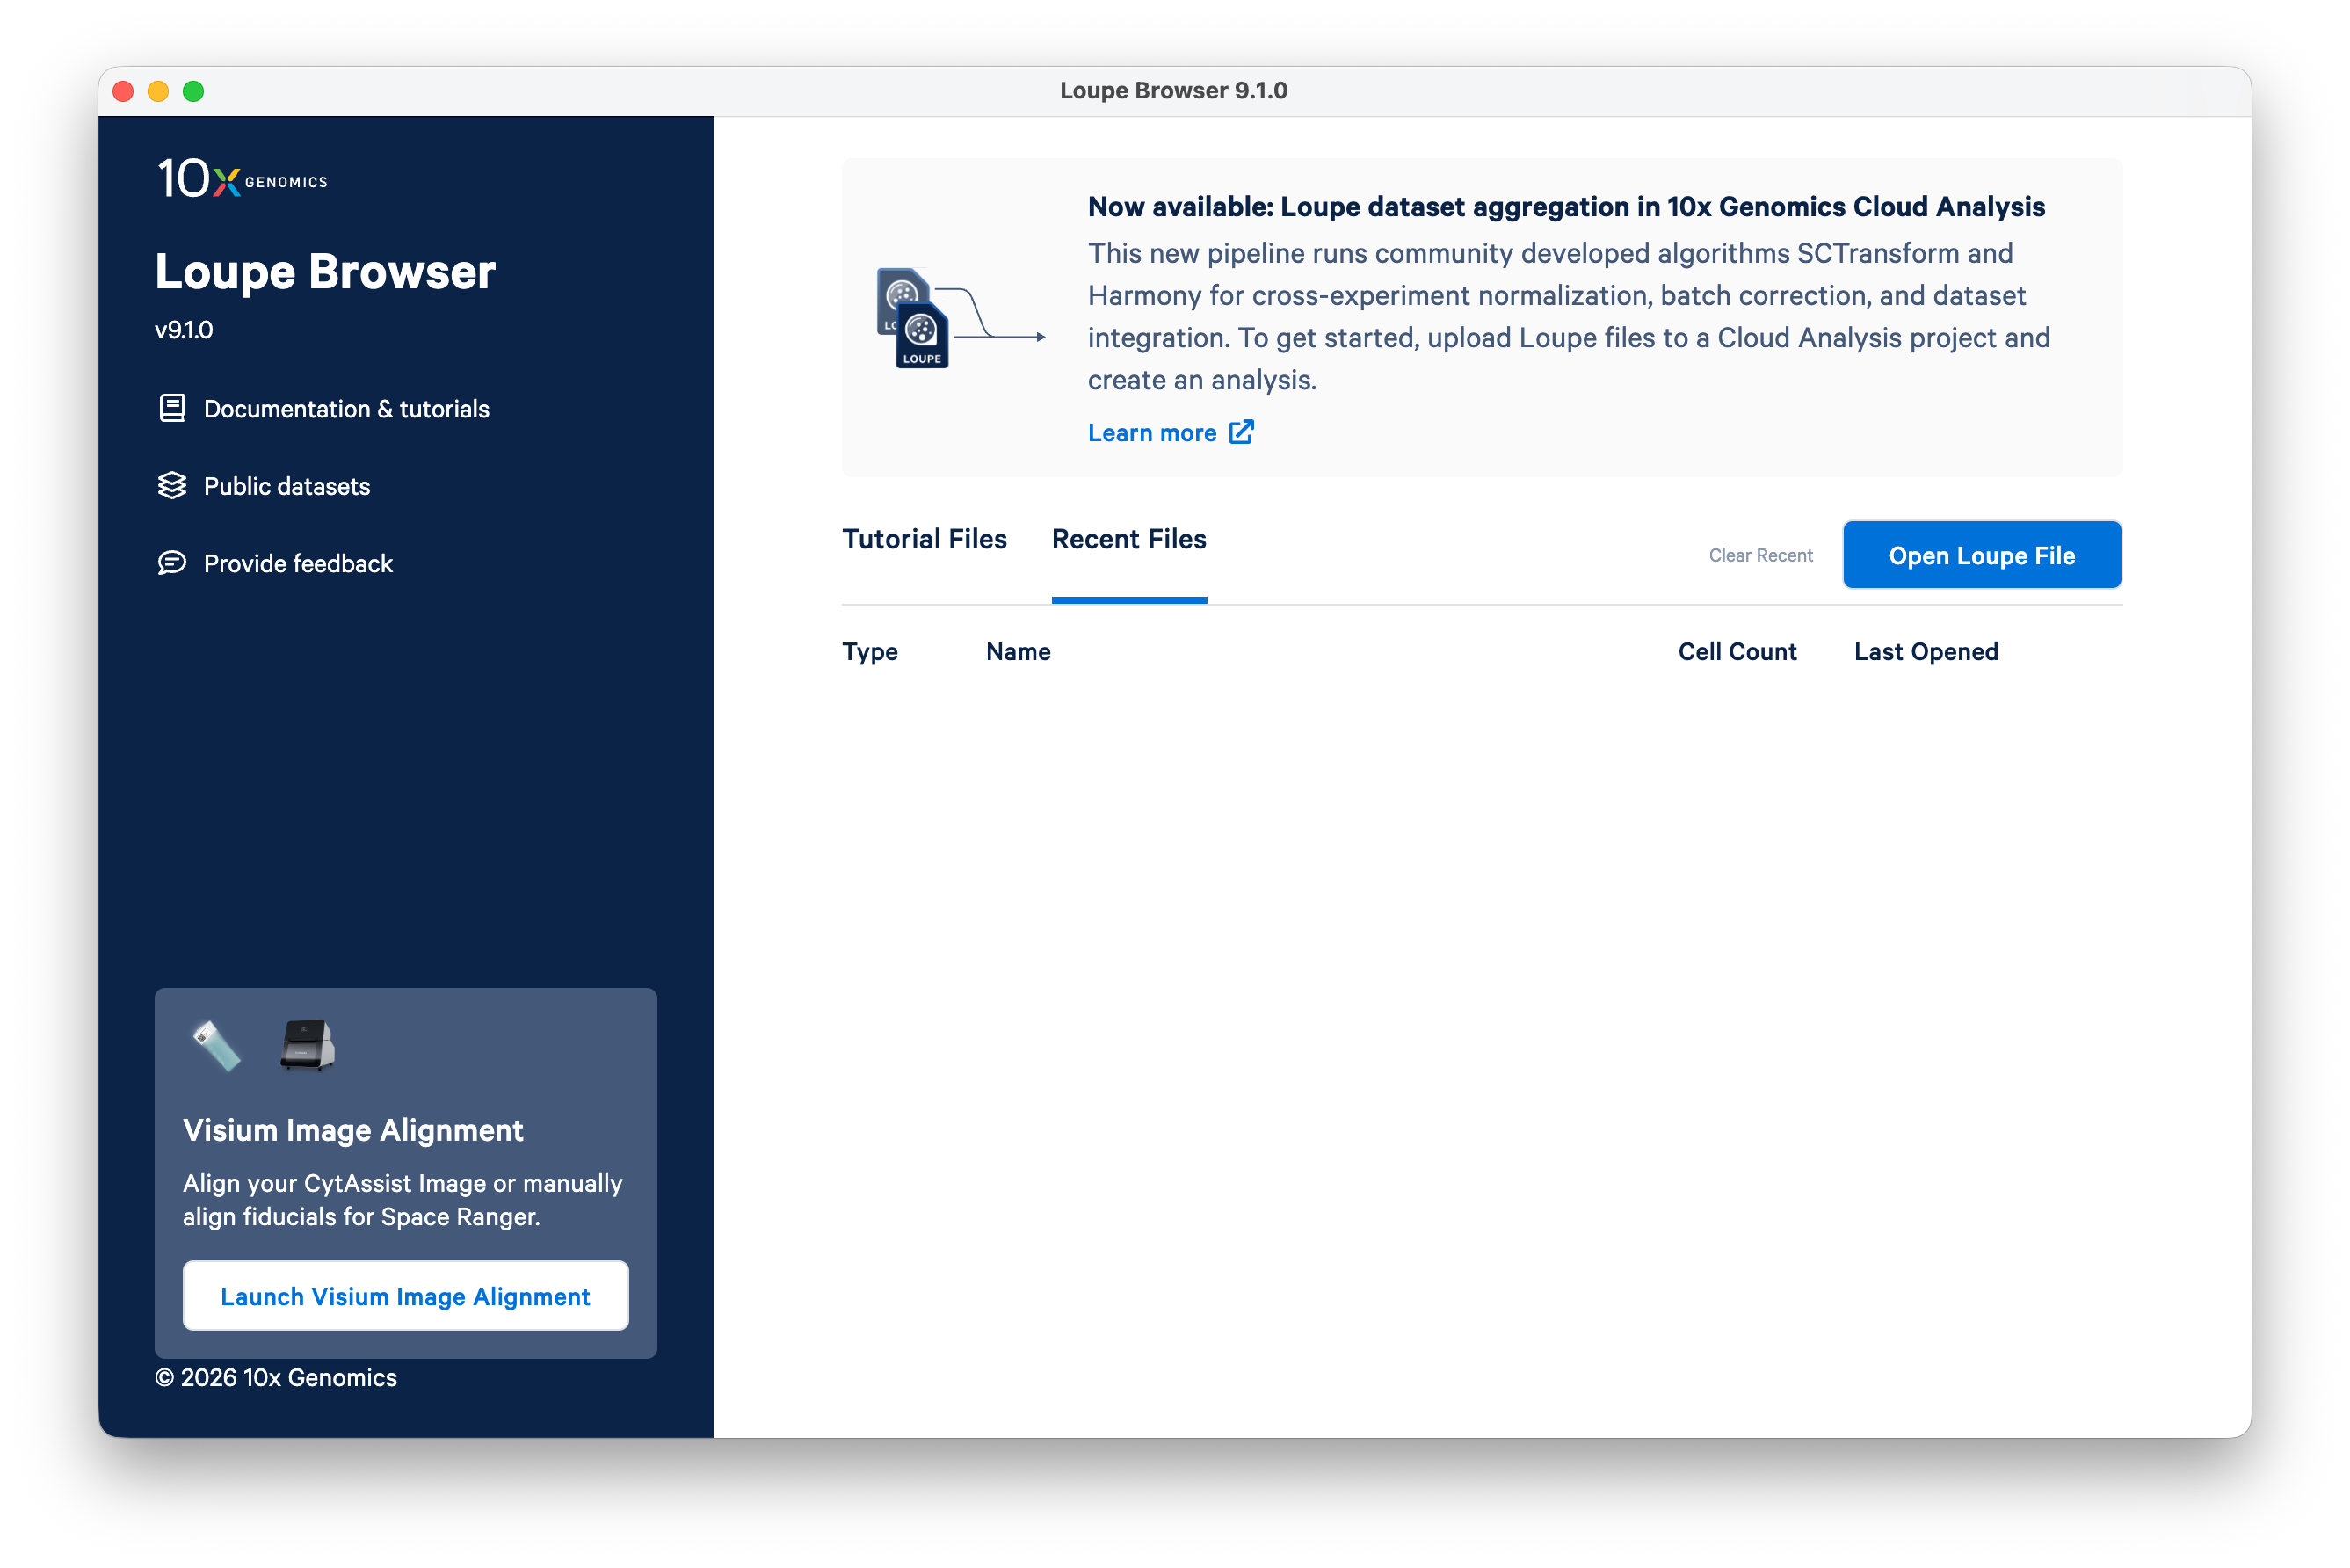
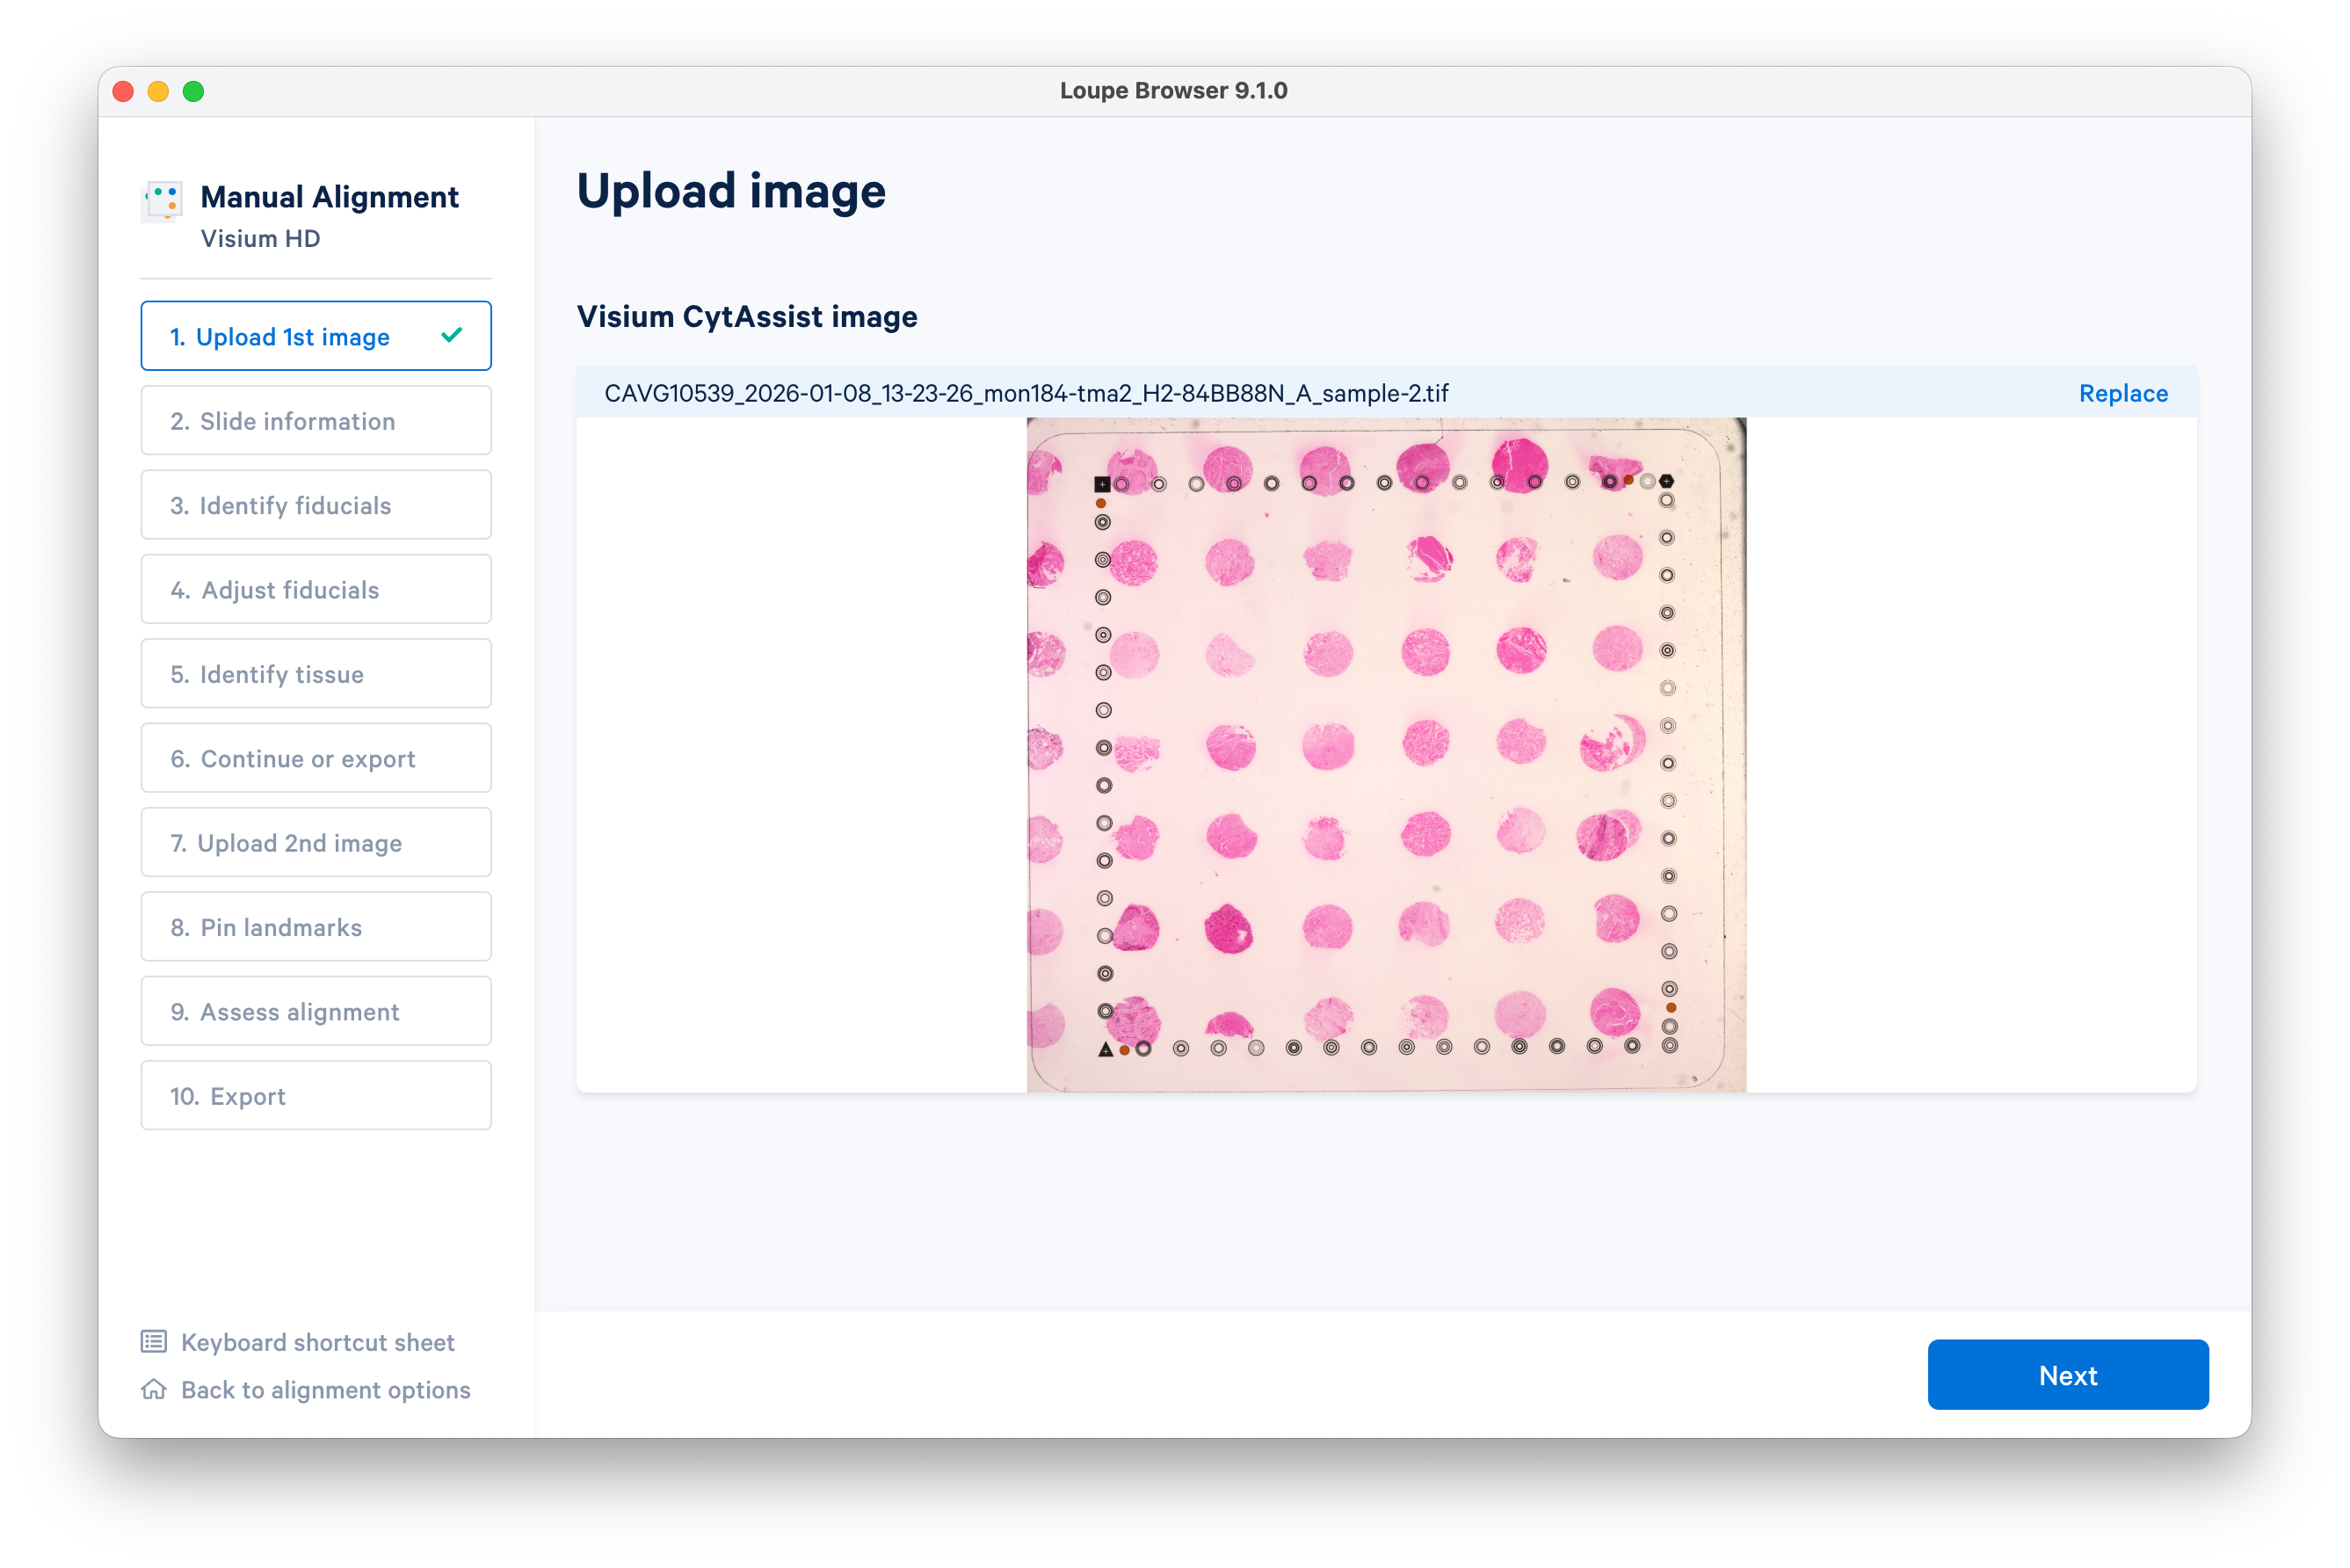
Begin by opening Loupe Browser v9.1 or later. Click Launch Visium Image Alignment on the bottom left.
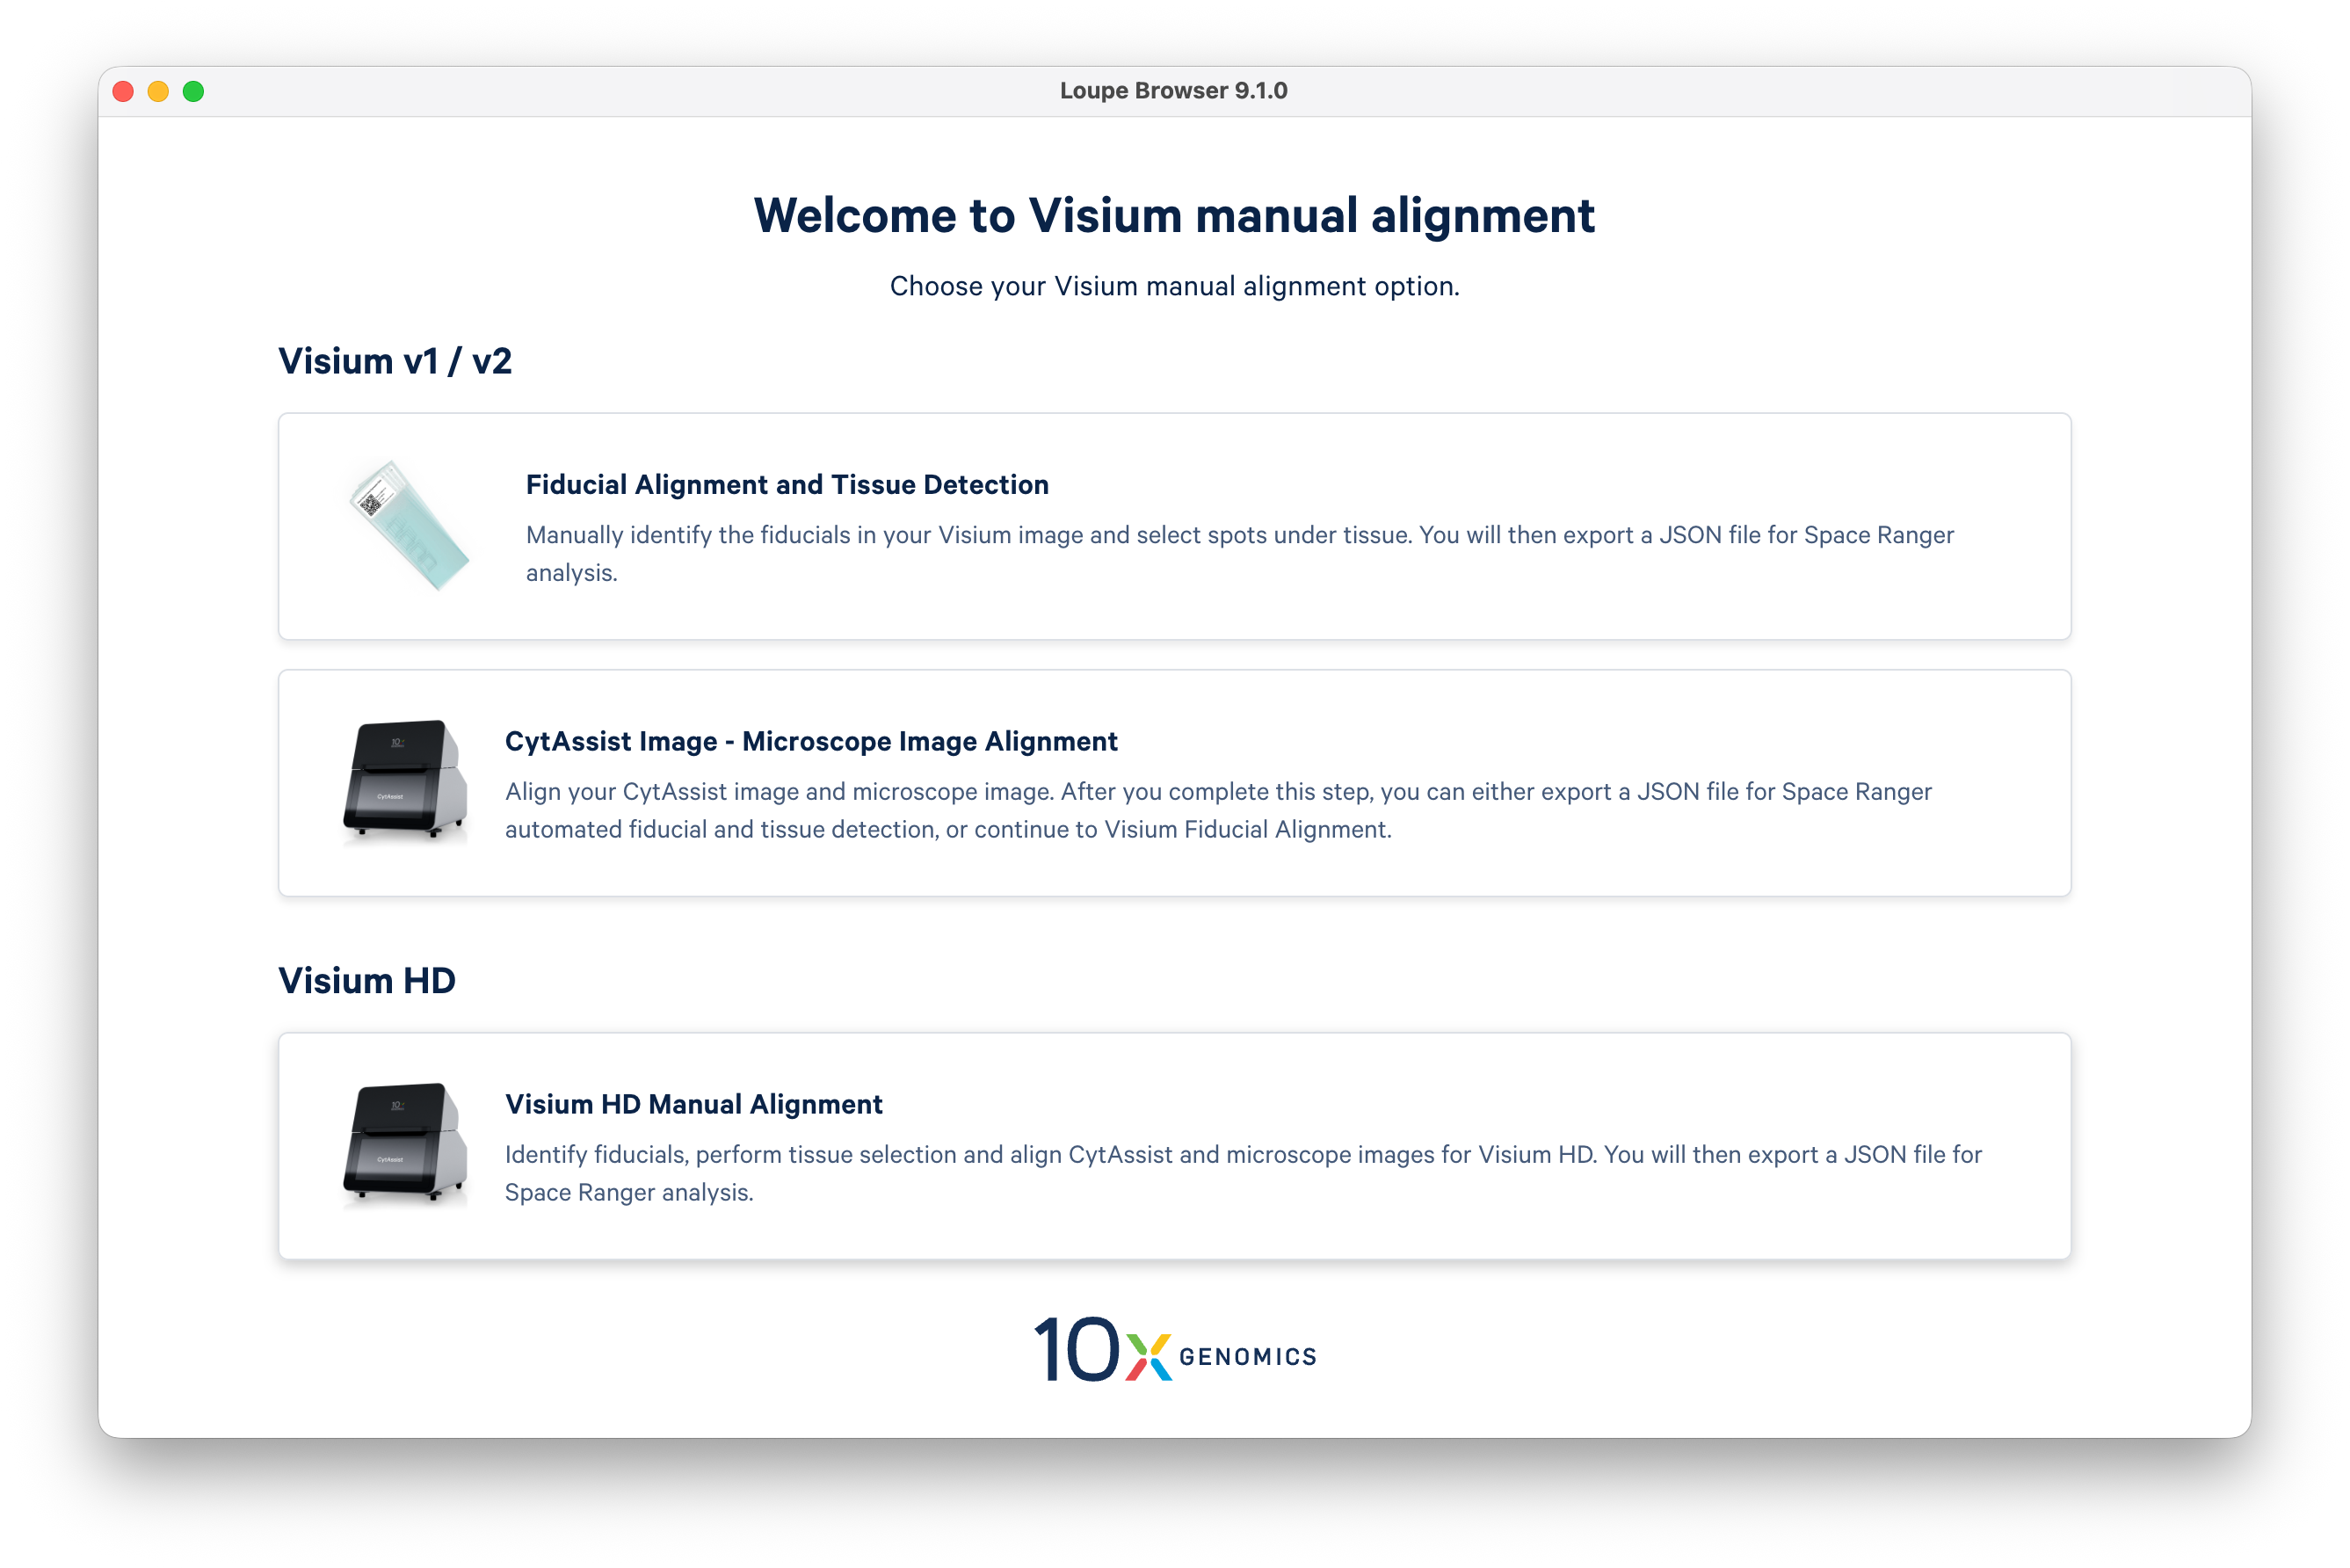
Select the Visium HD Manual Alignment option.
Upload the CytAssist image.
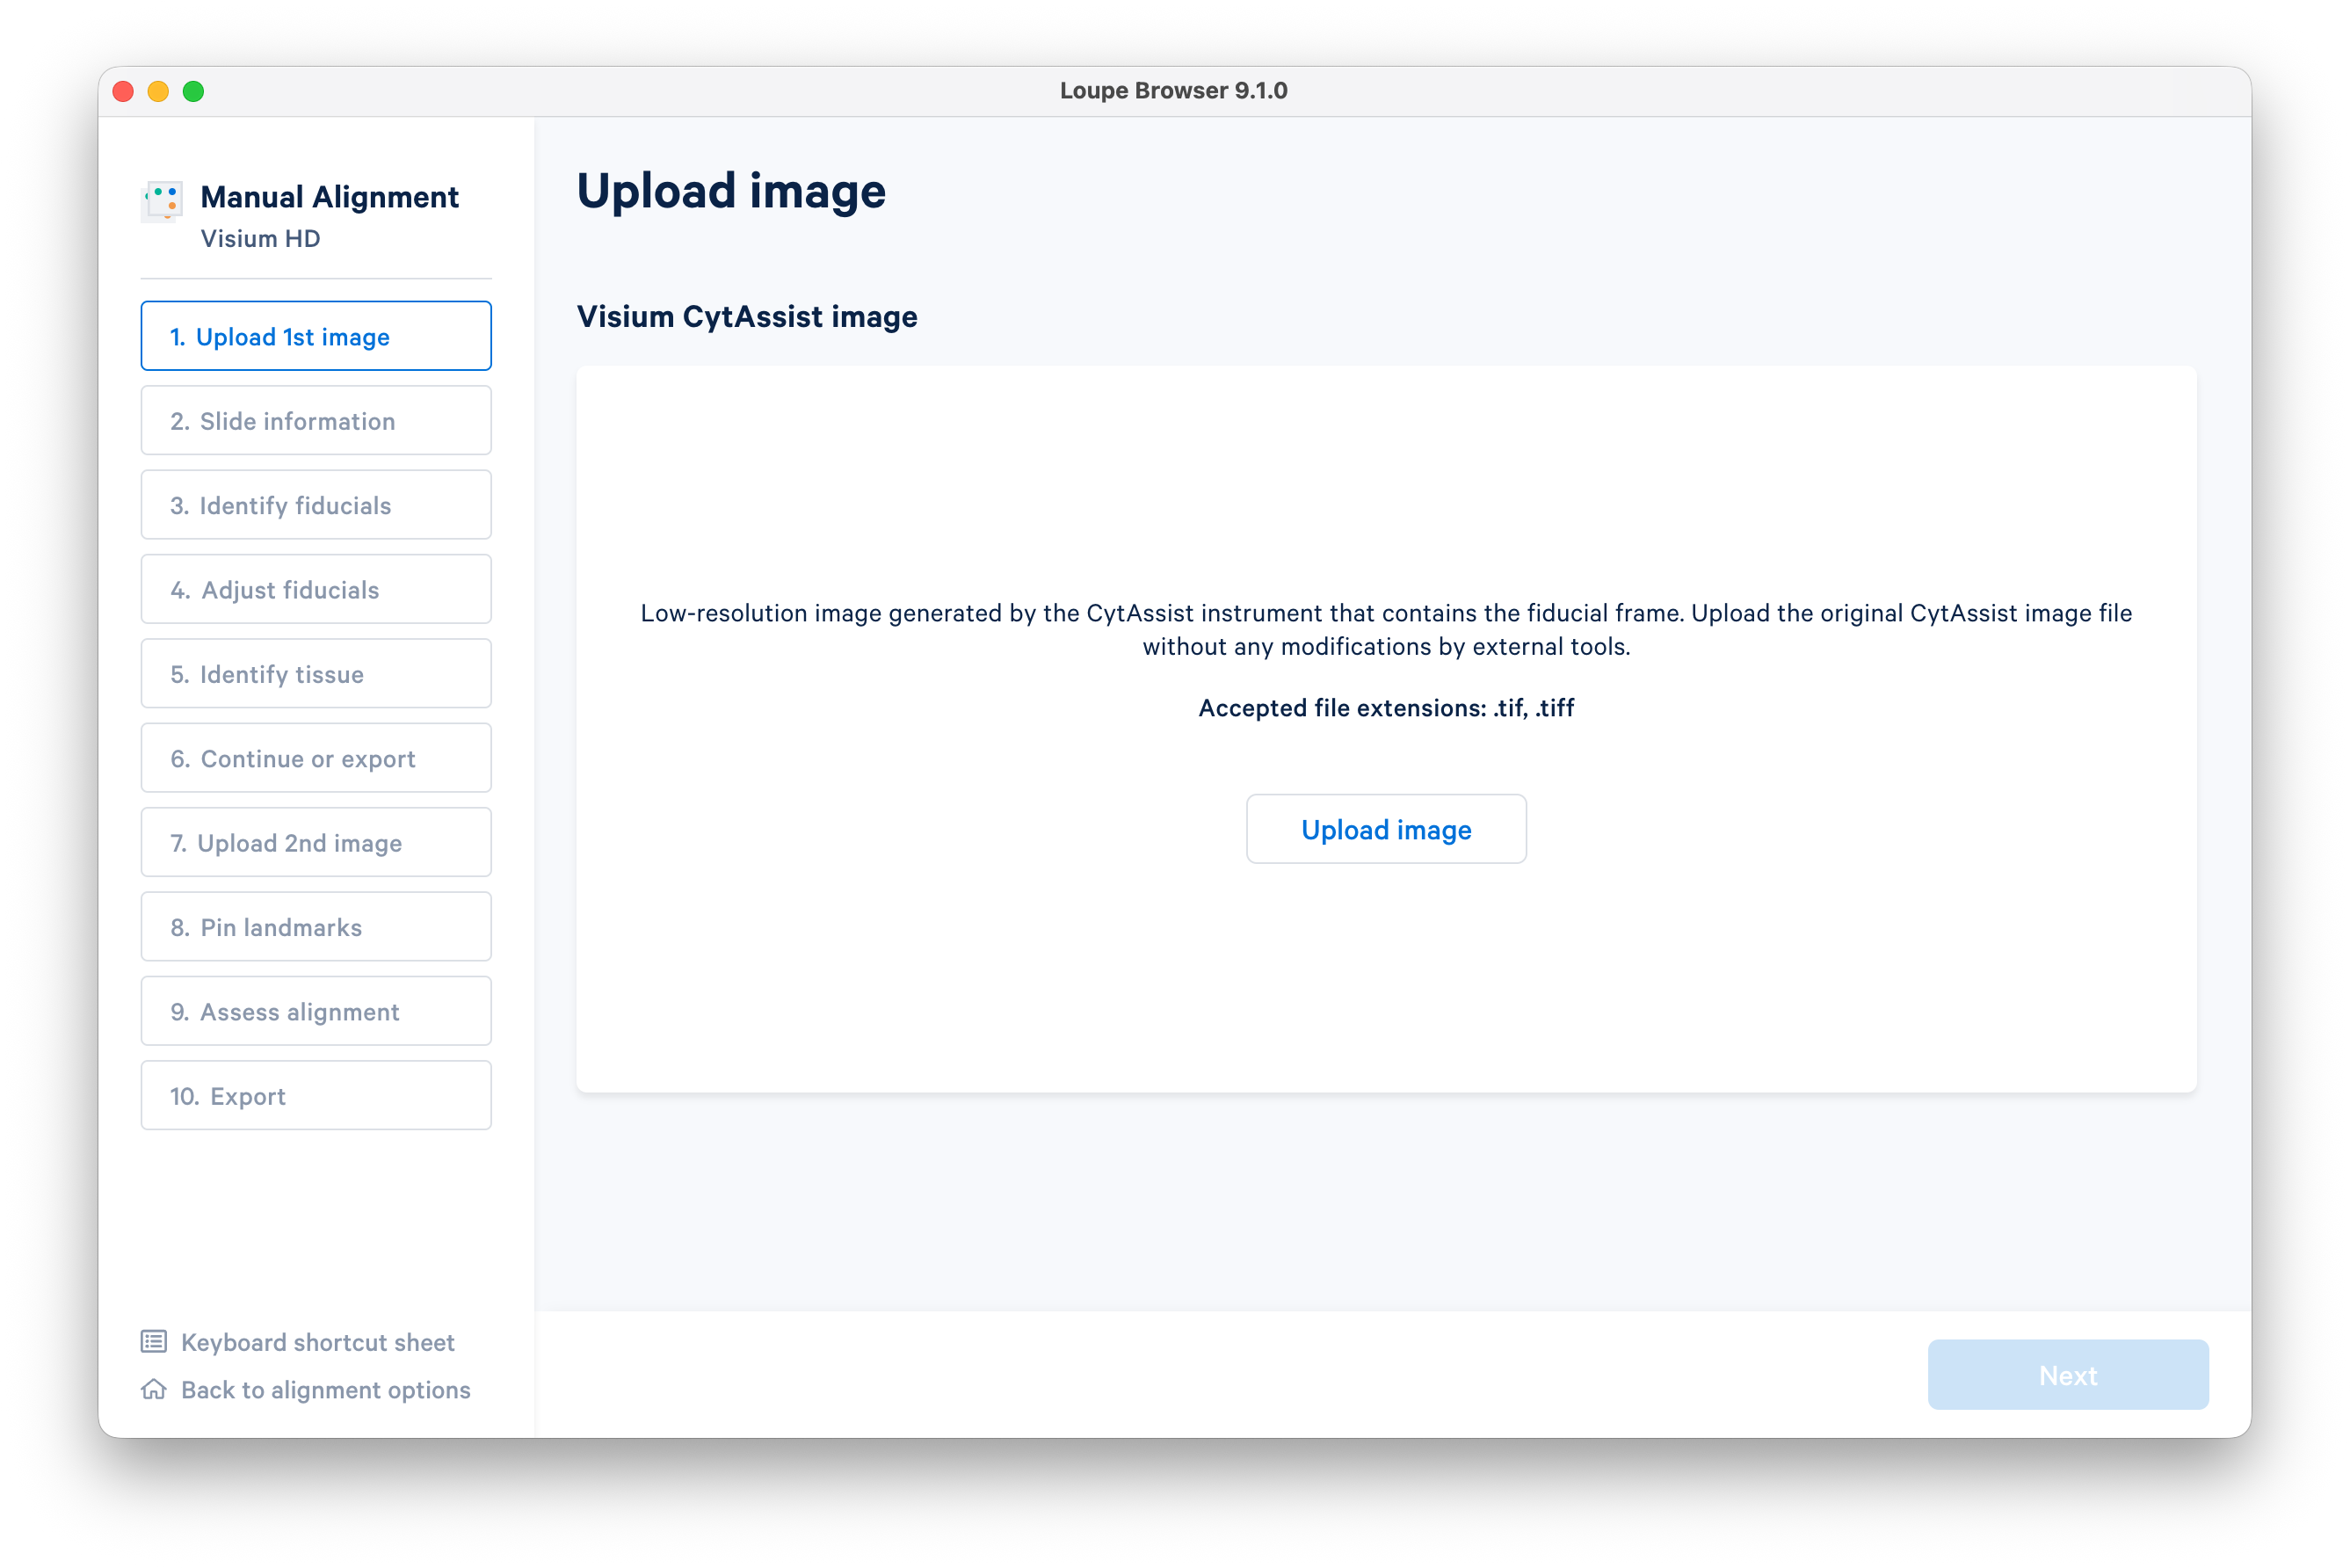
After the image loads, click Next.
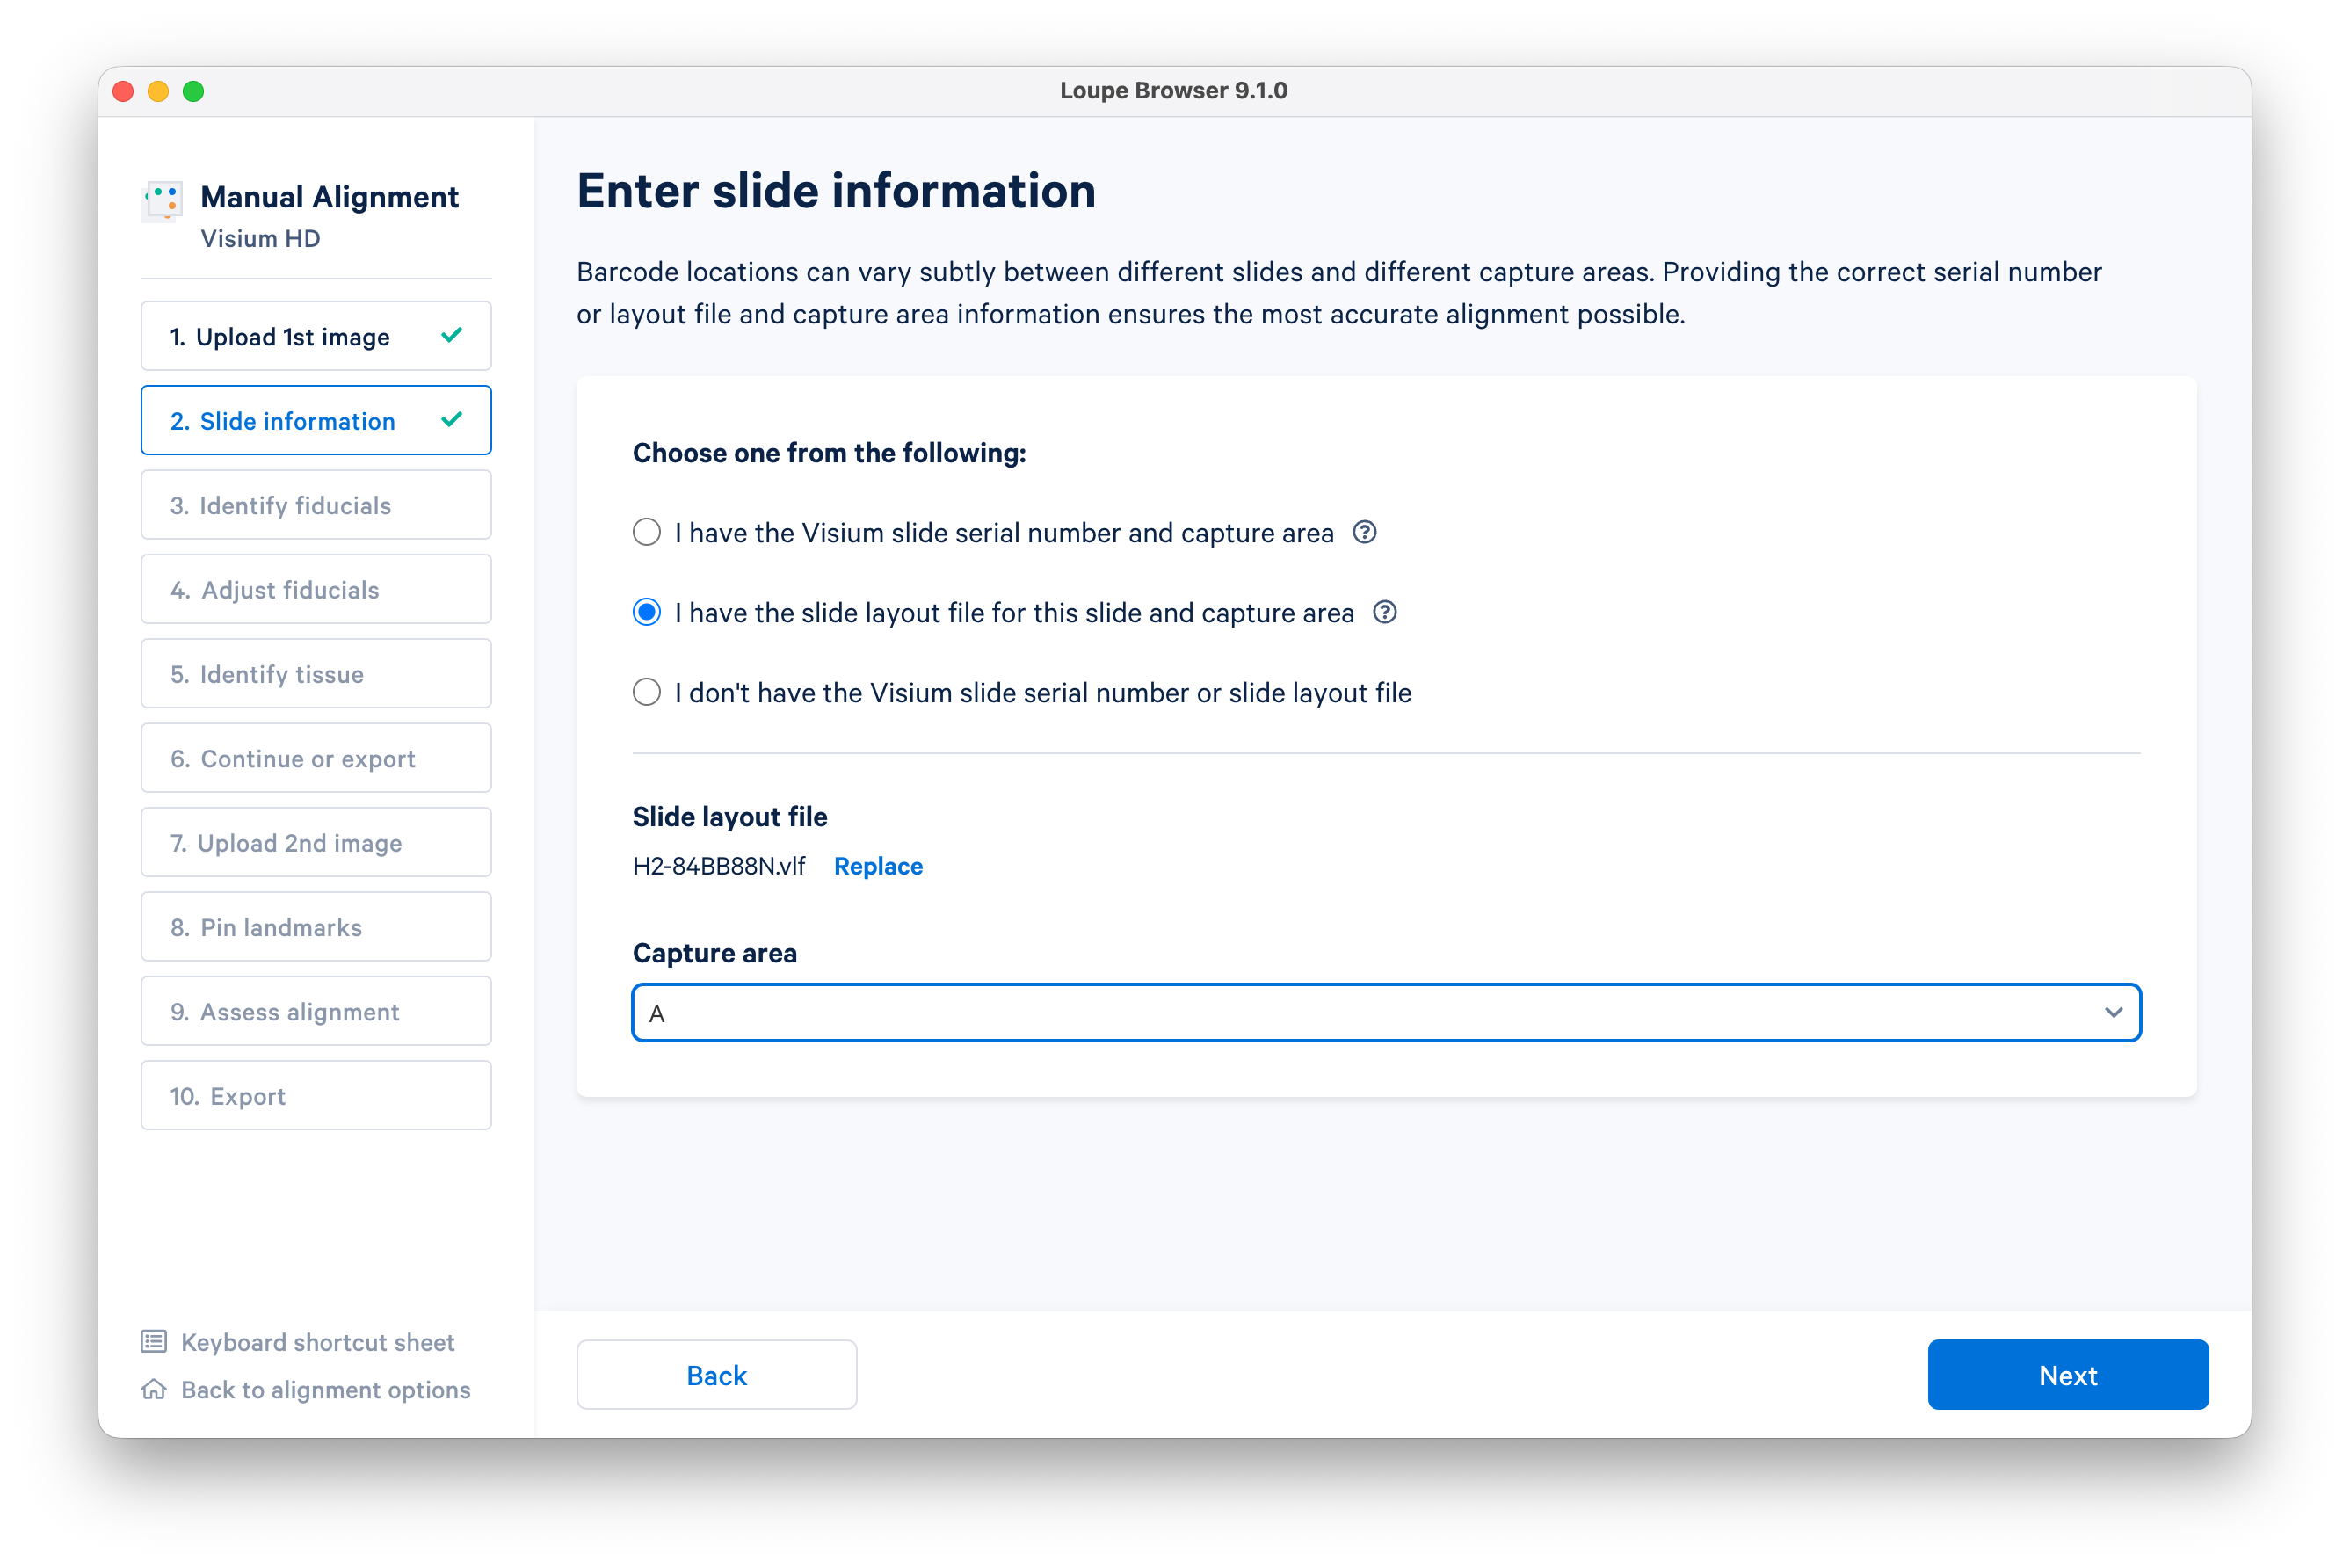
Enter the slide information. Use the slide layout file (.vlf) provided earlier in this tutorial (typically, you can just enter the slide serial number). Enter the Capture Area ("A"), then click Next.
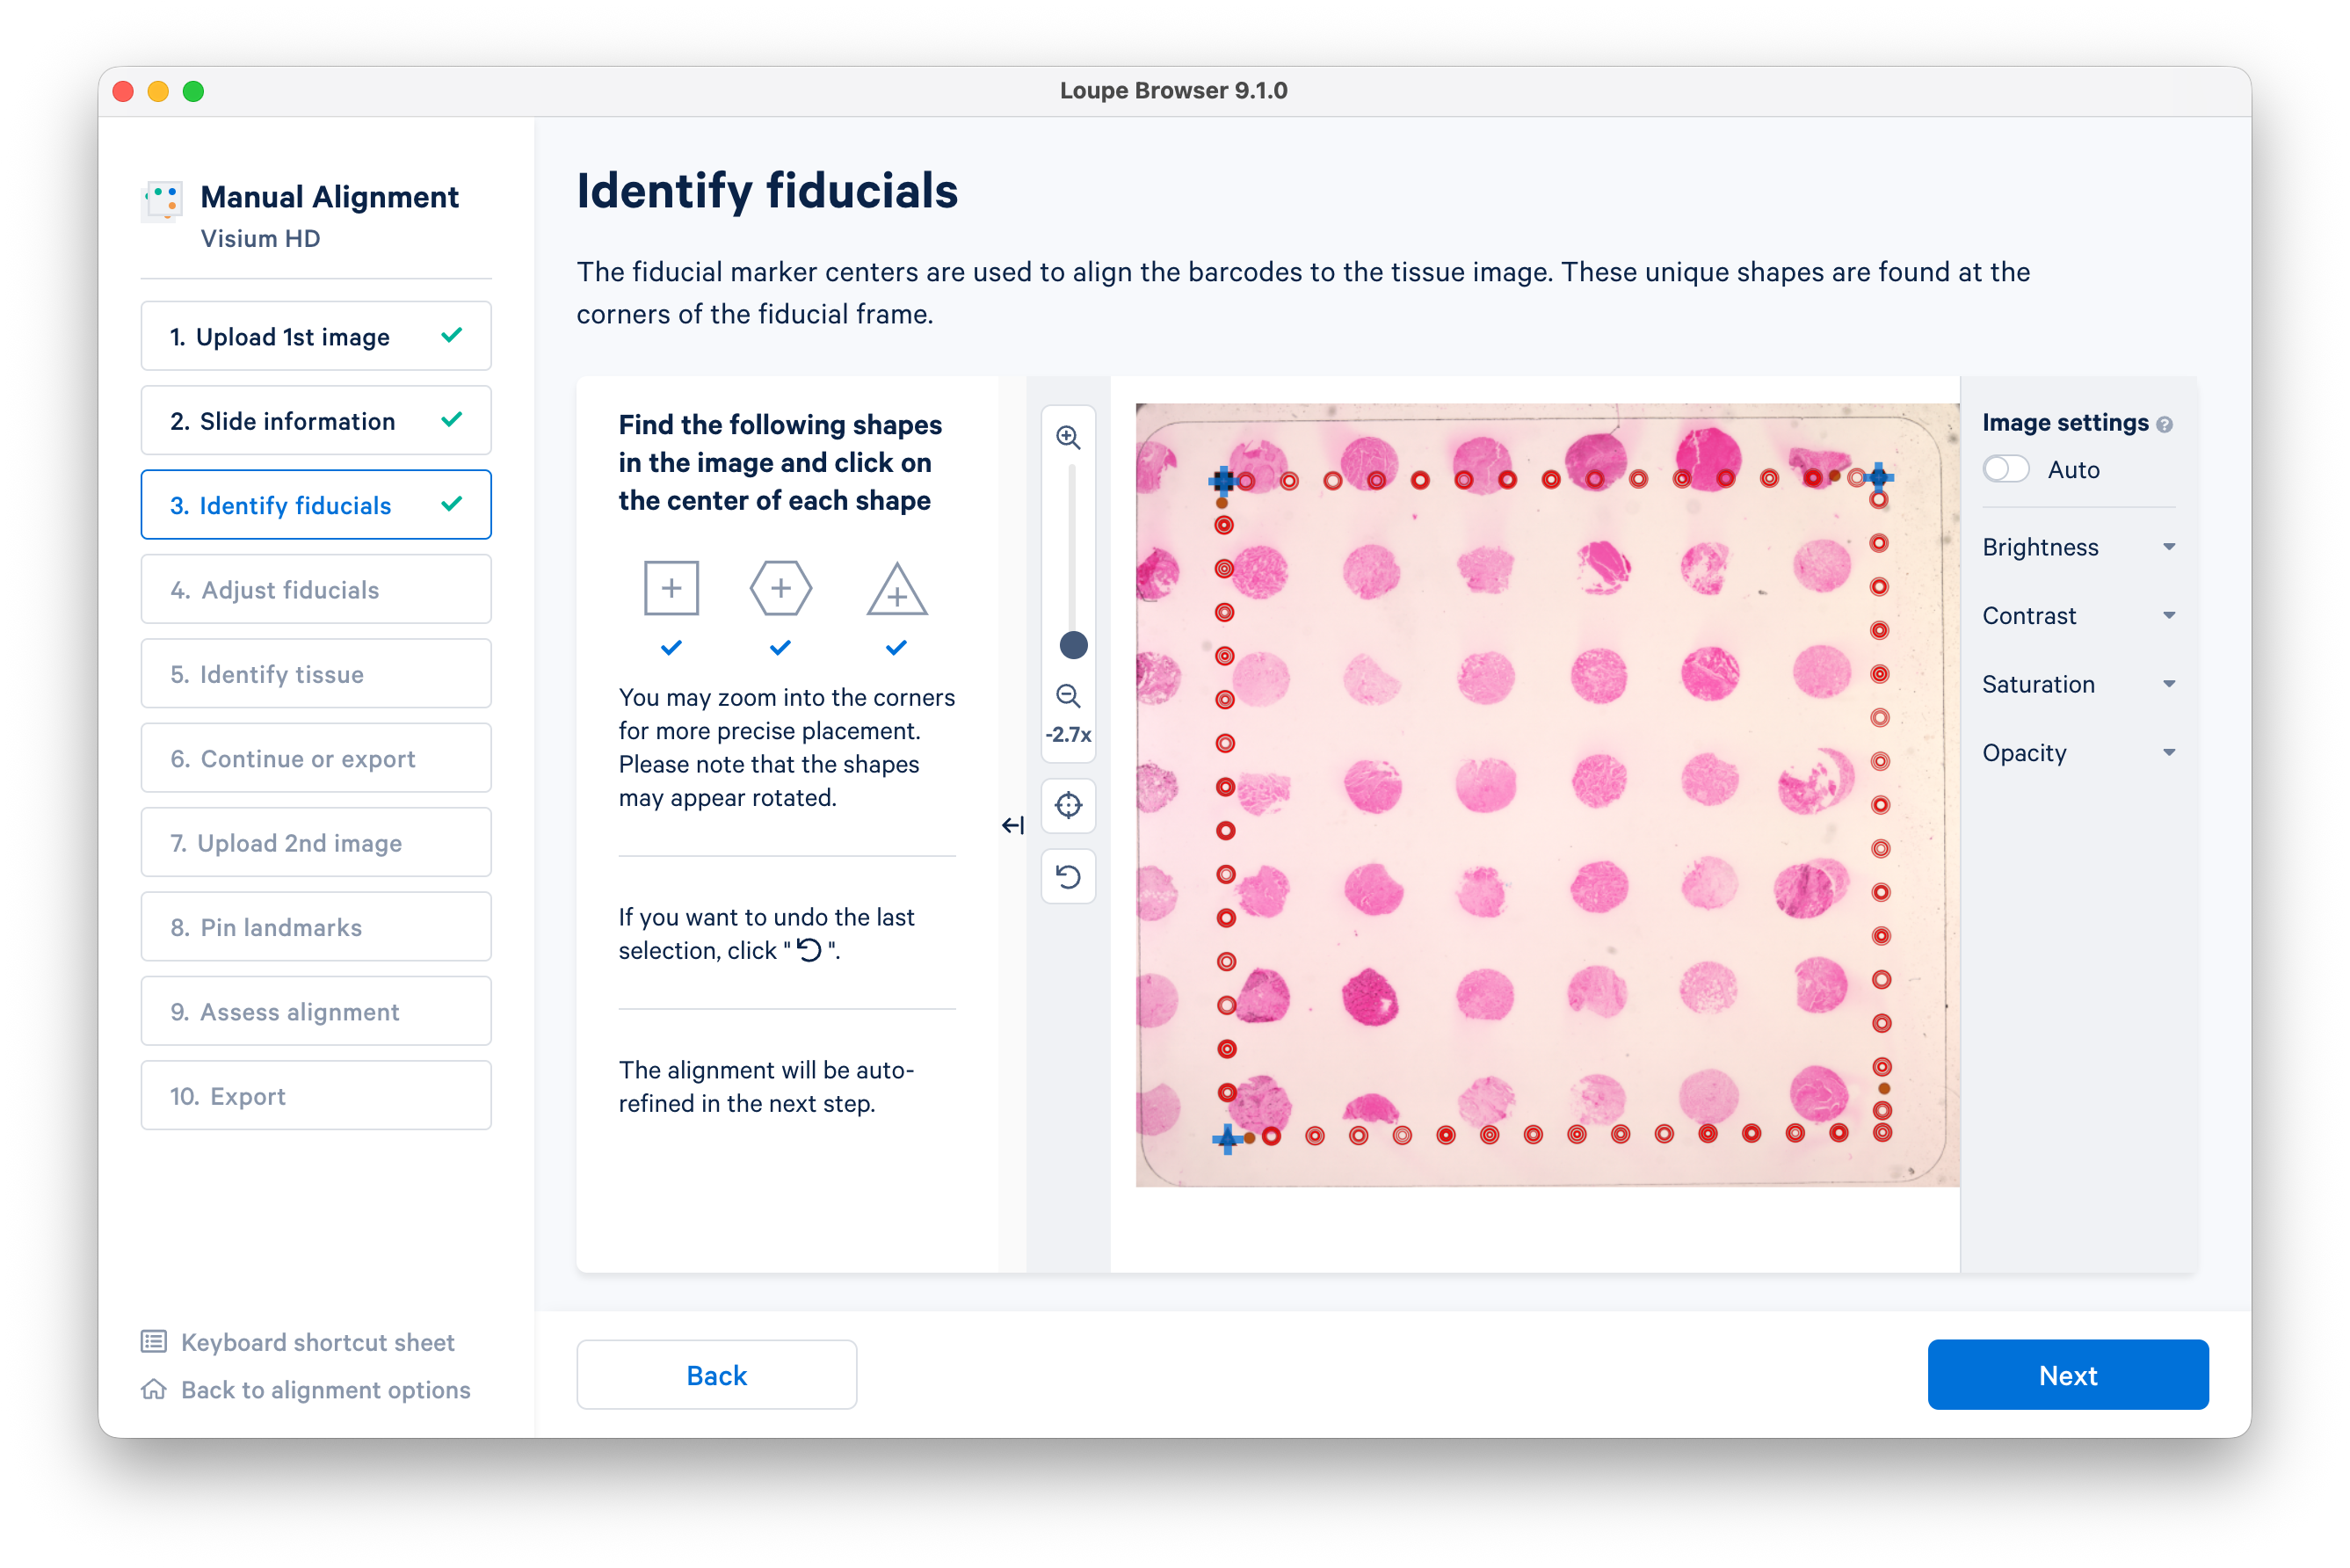
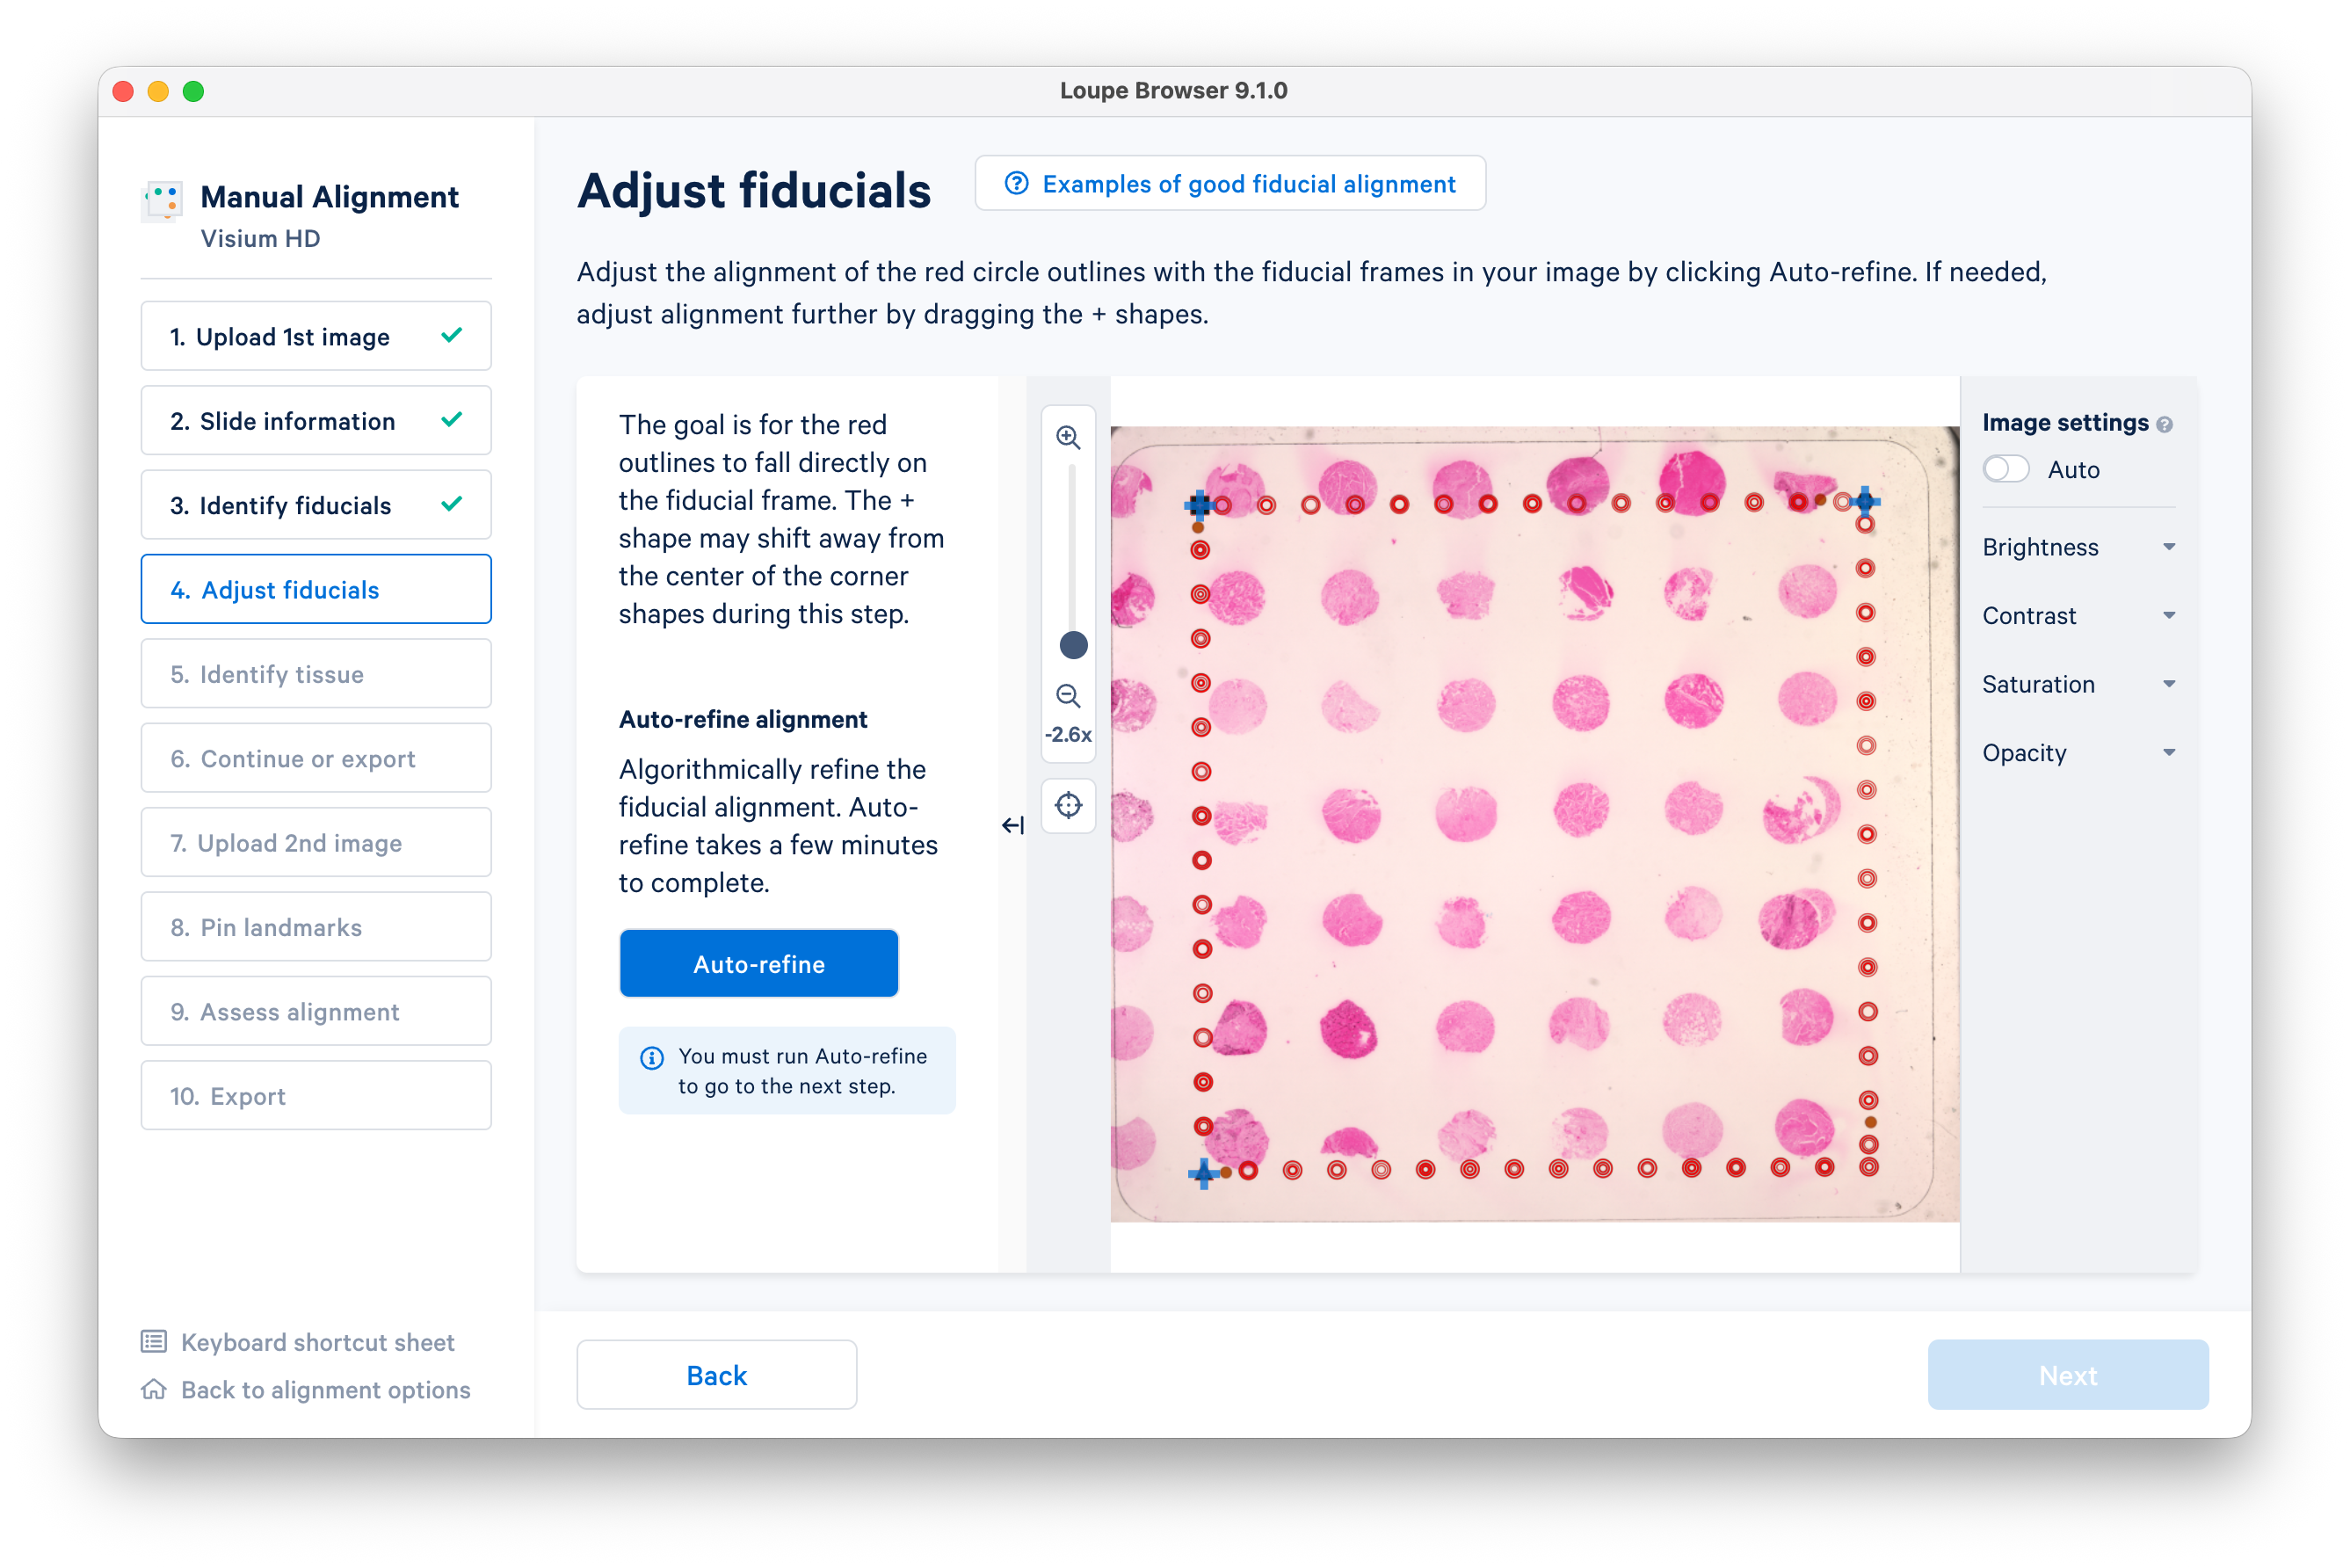
The next step is to identify fiducials. Follow the on-screen instructions to find and mark the square, hexagon, and triangle shapes.
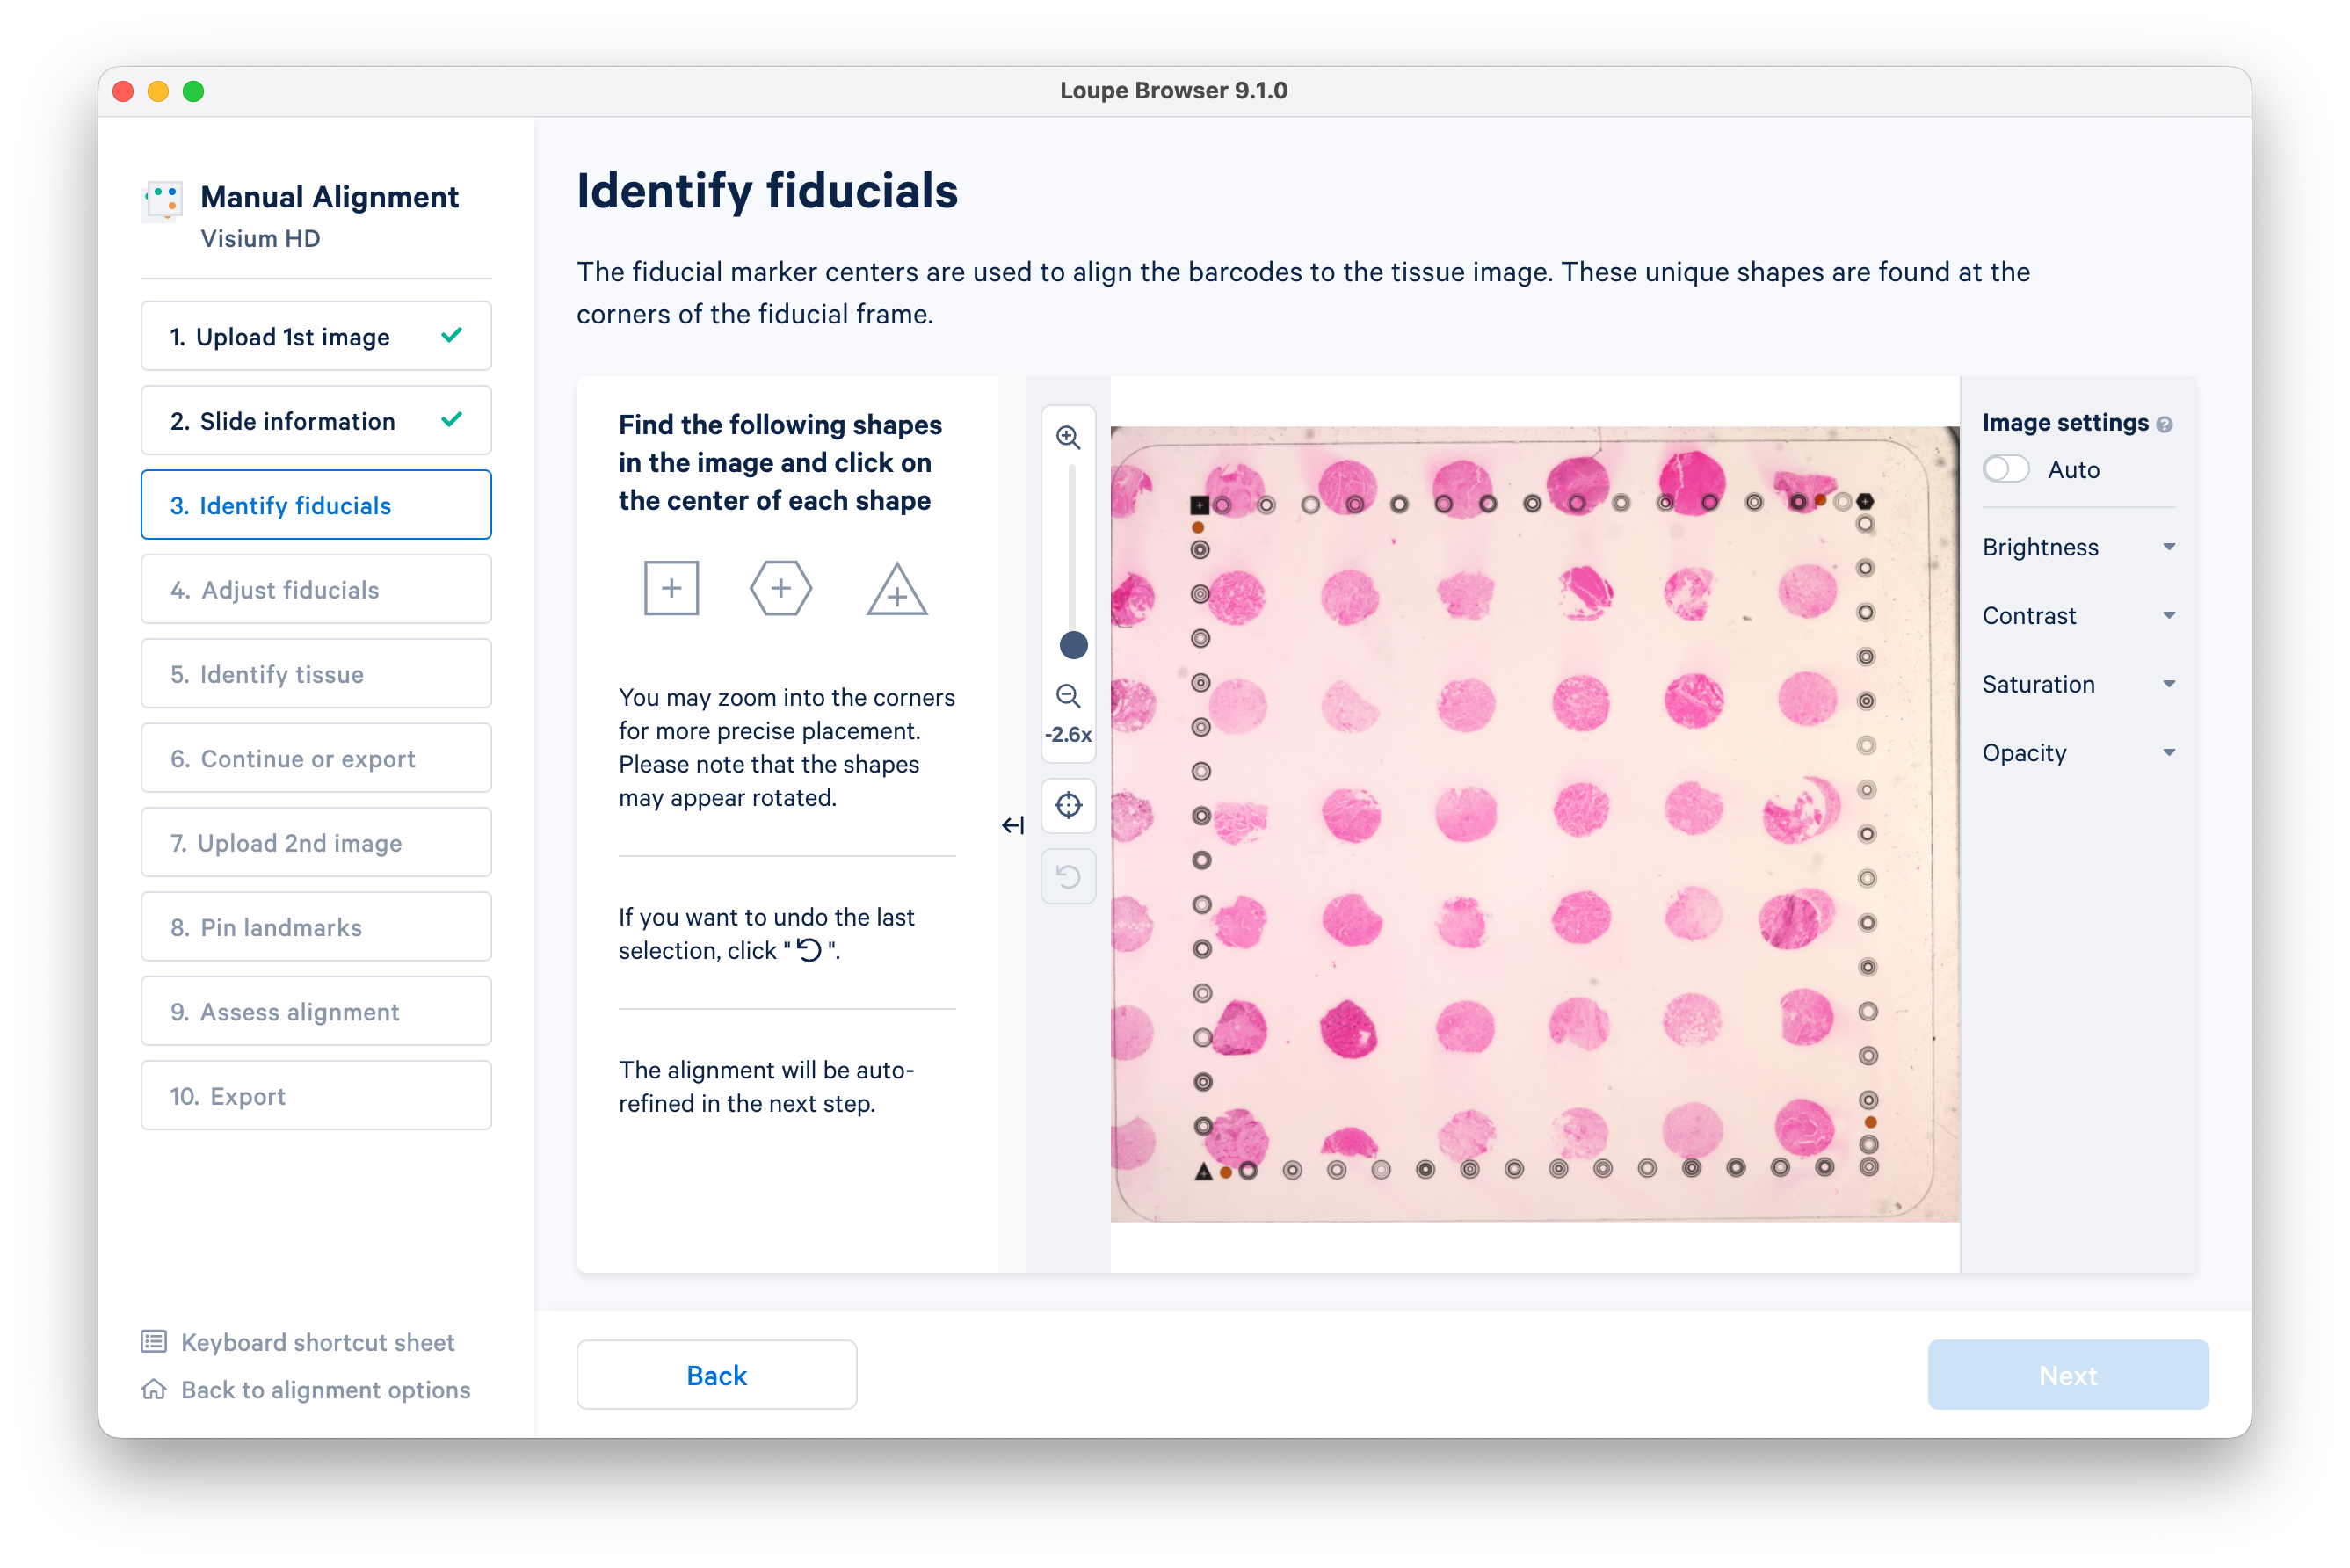
When you have identified the fiducials, click Next.
Click Auto-refine to adjust the fiducials, then click Next.
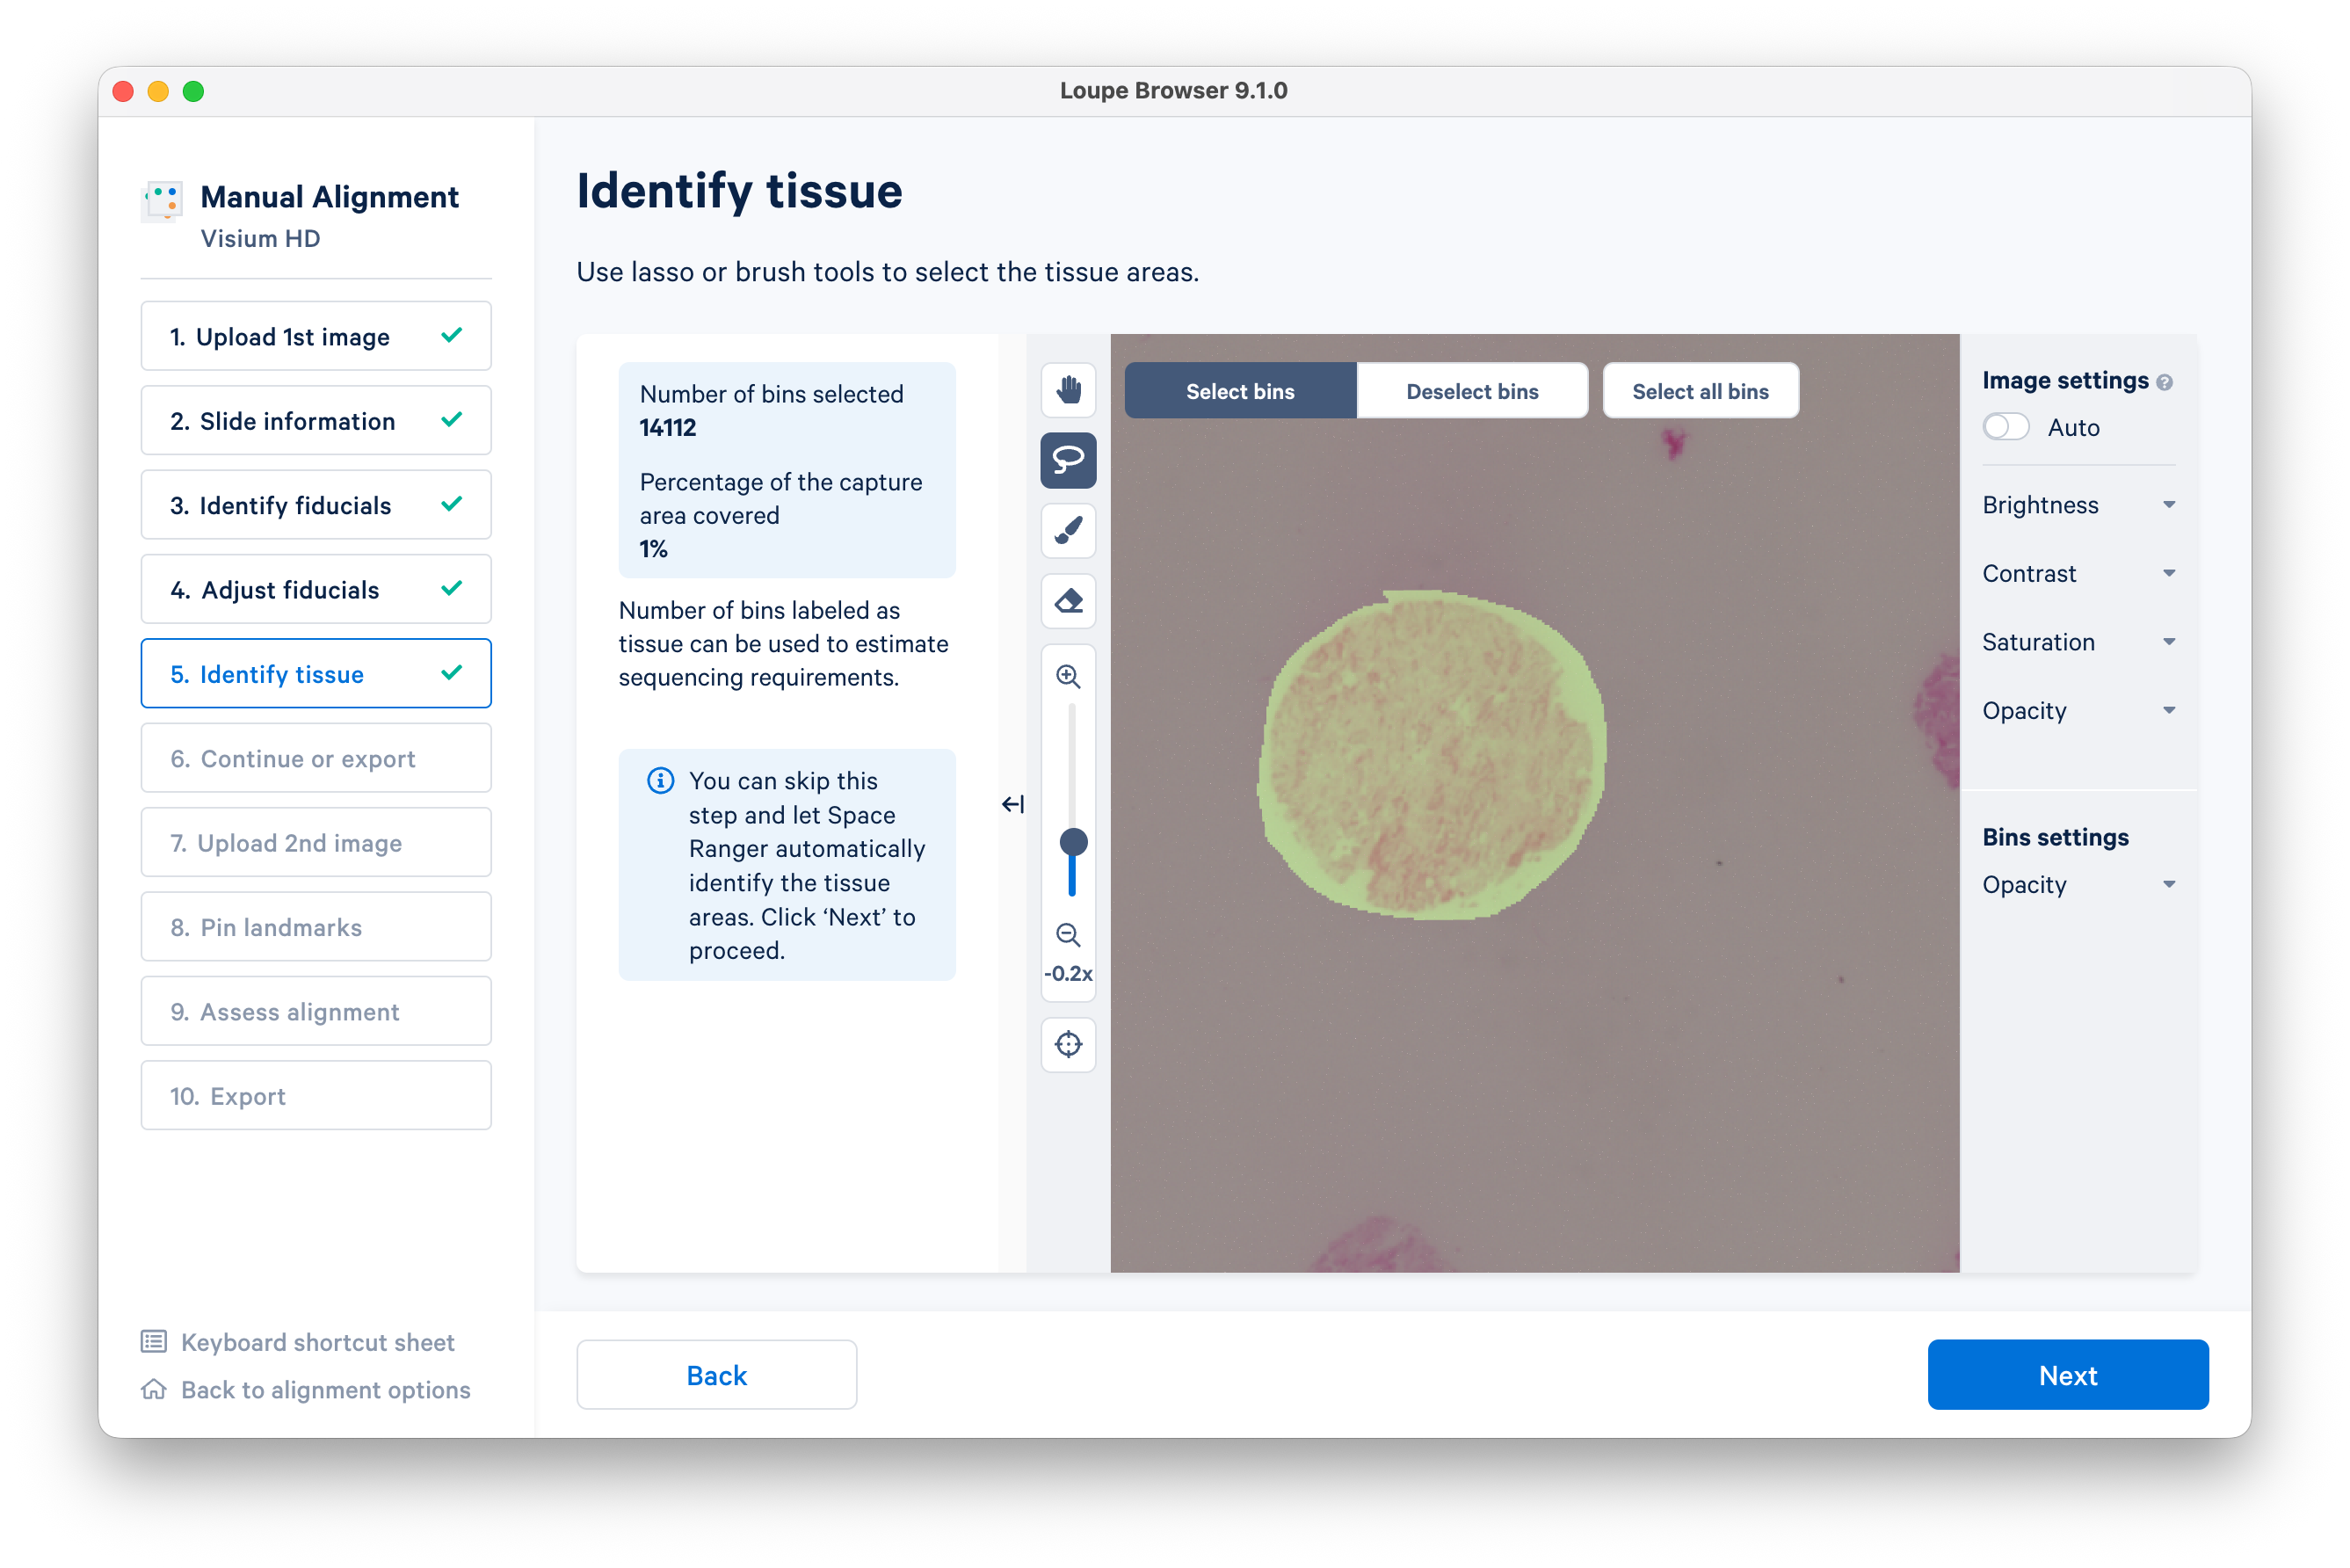
Use the lasso or brush tool to select a single tissue core.
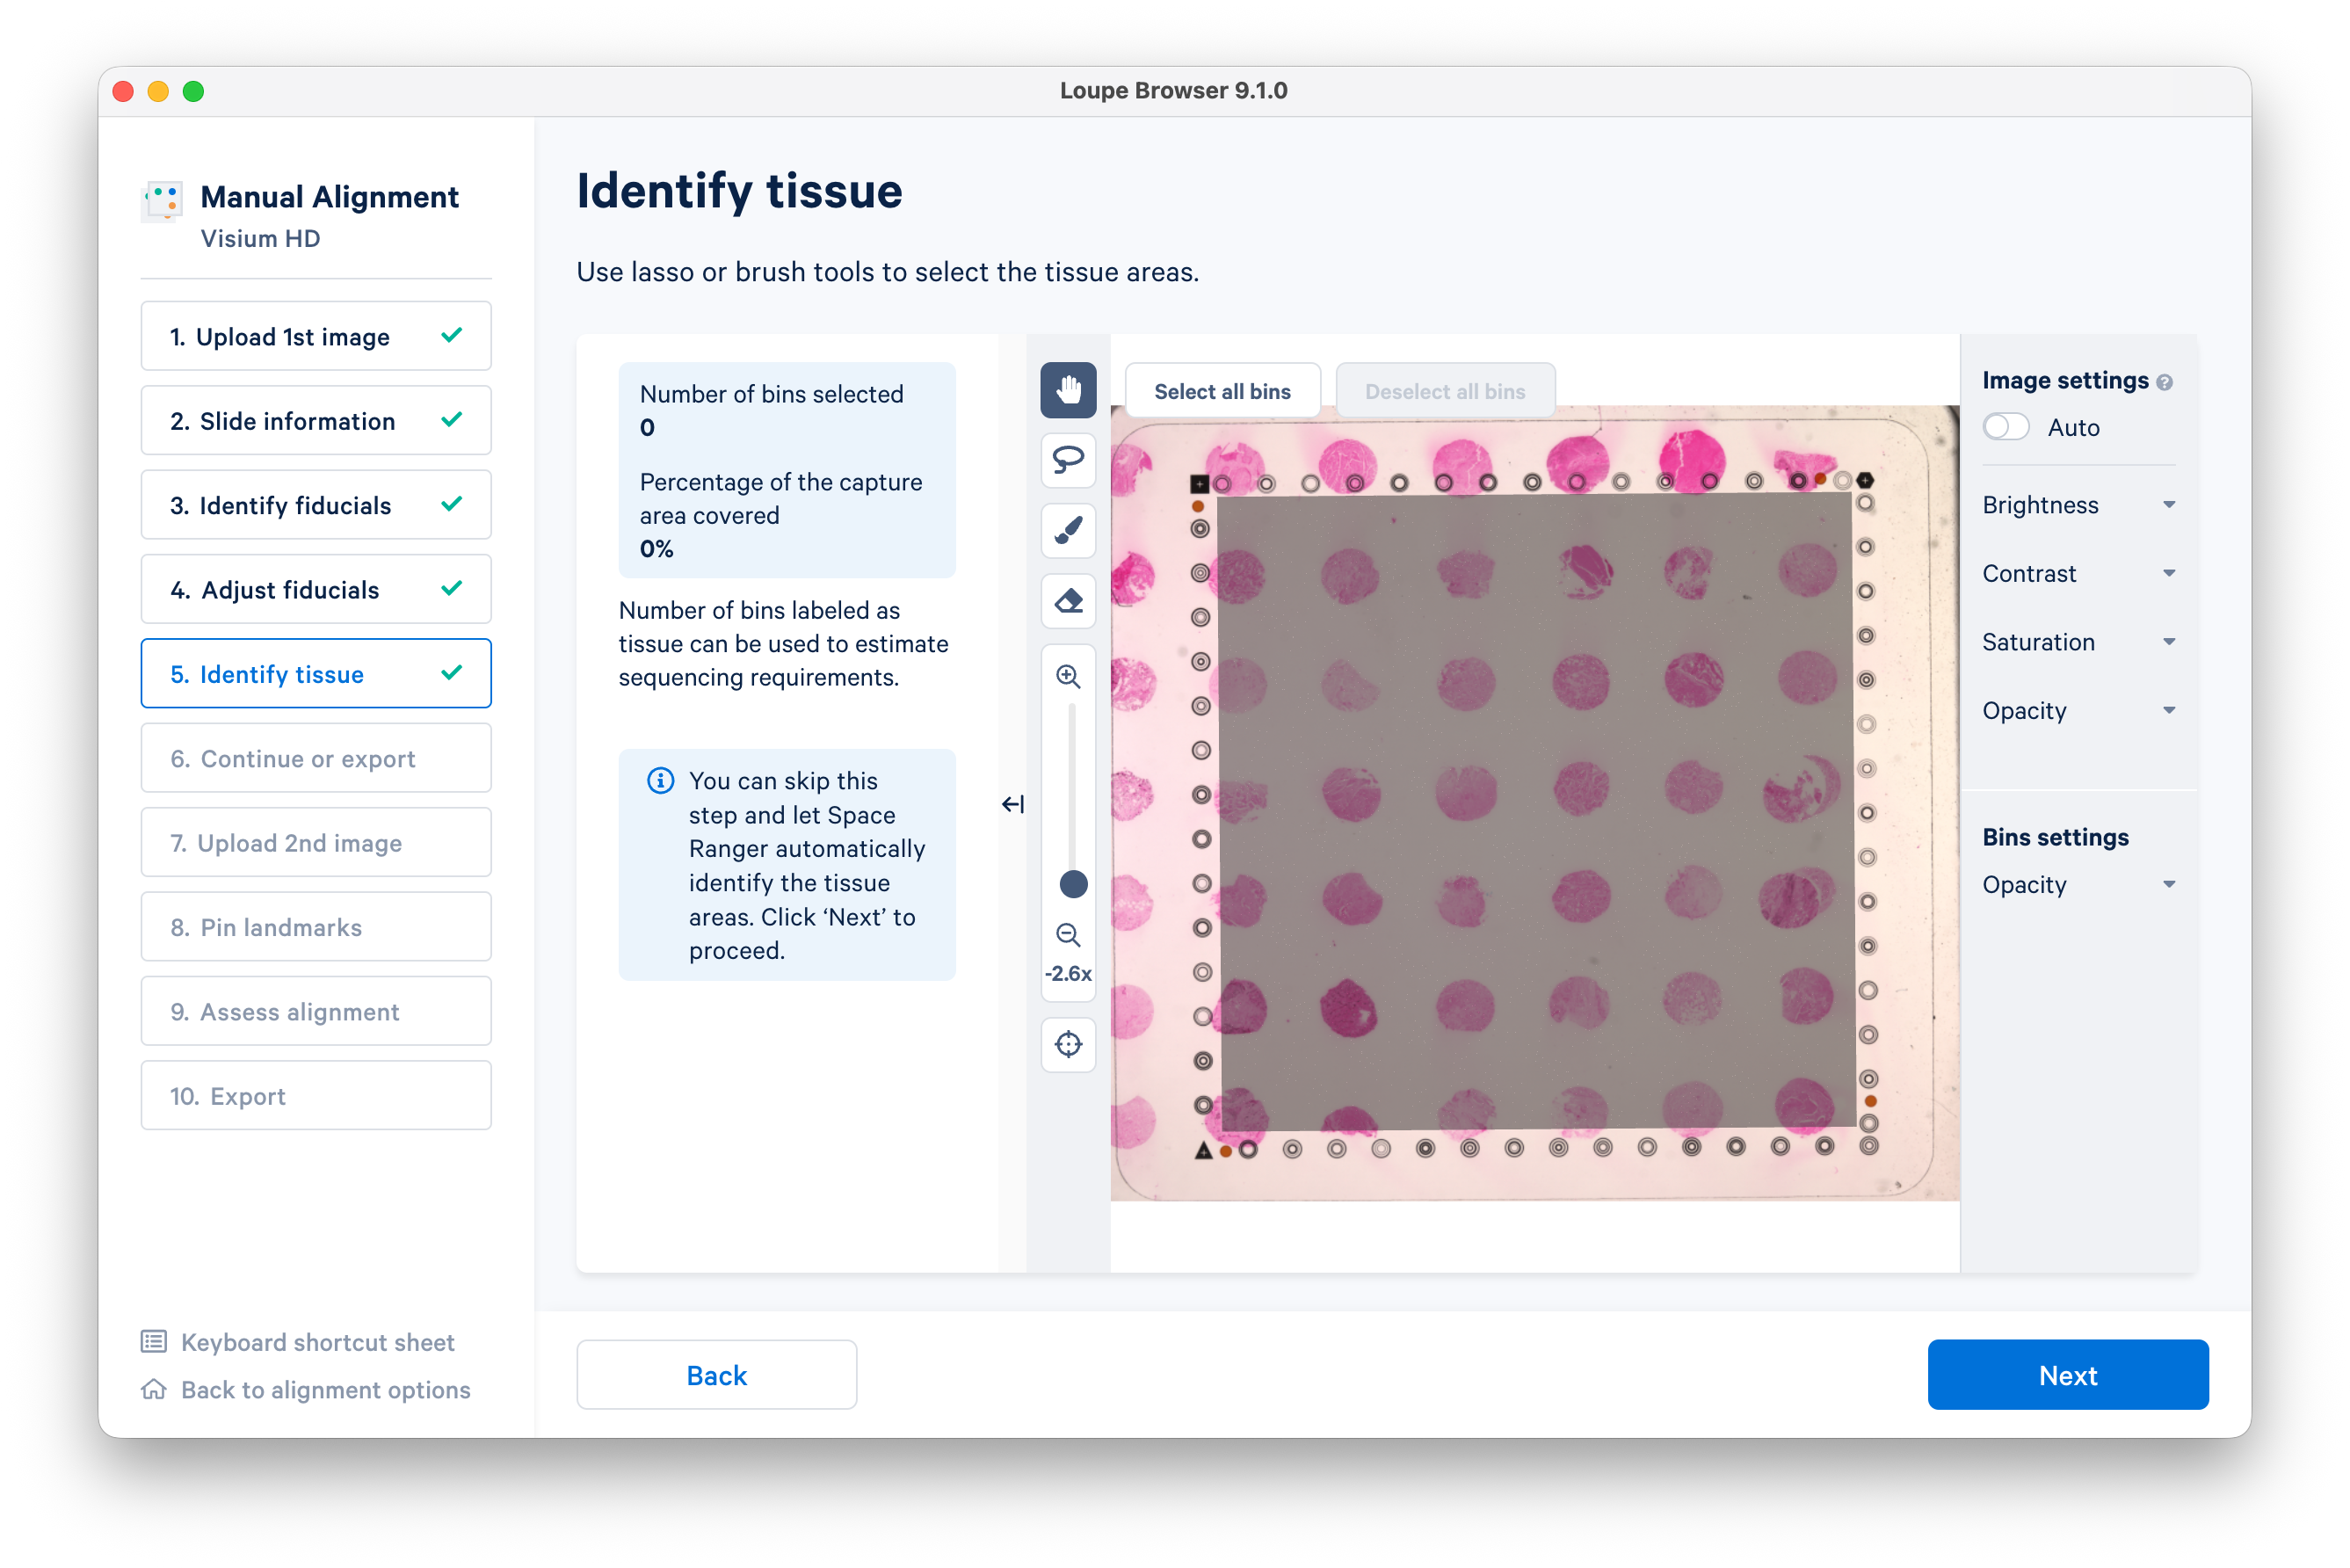
Zooming in will enable you to do this more precisely. When you are satisfied, click Next.
Click Export alignment JSON file. You will use this file to run Space Ranger on the selected tissue core.
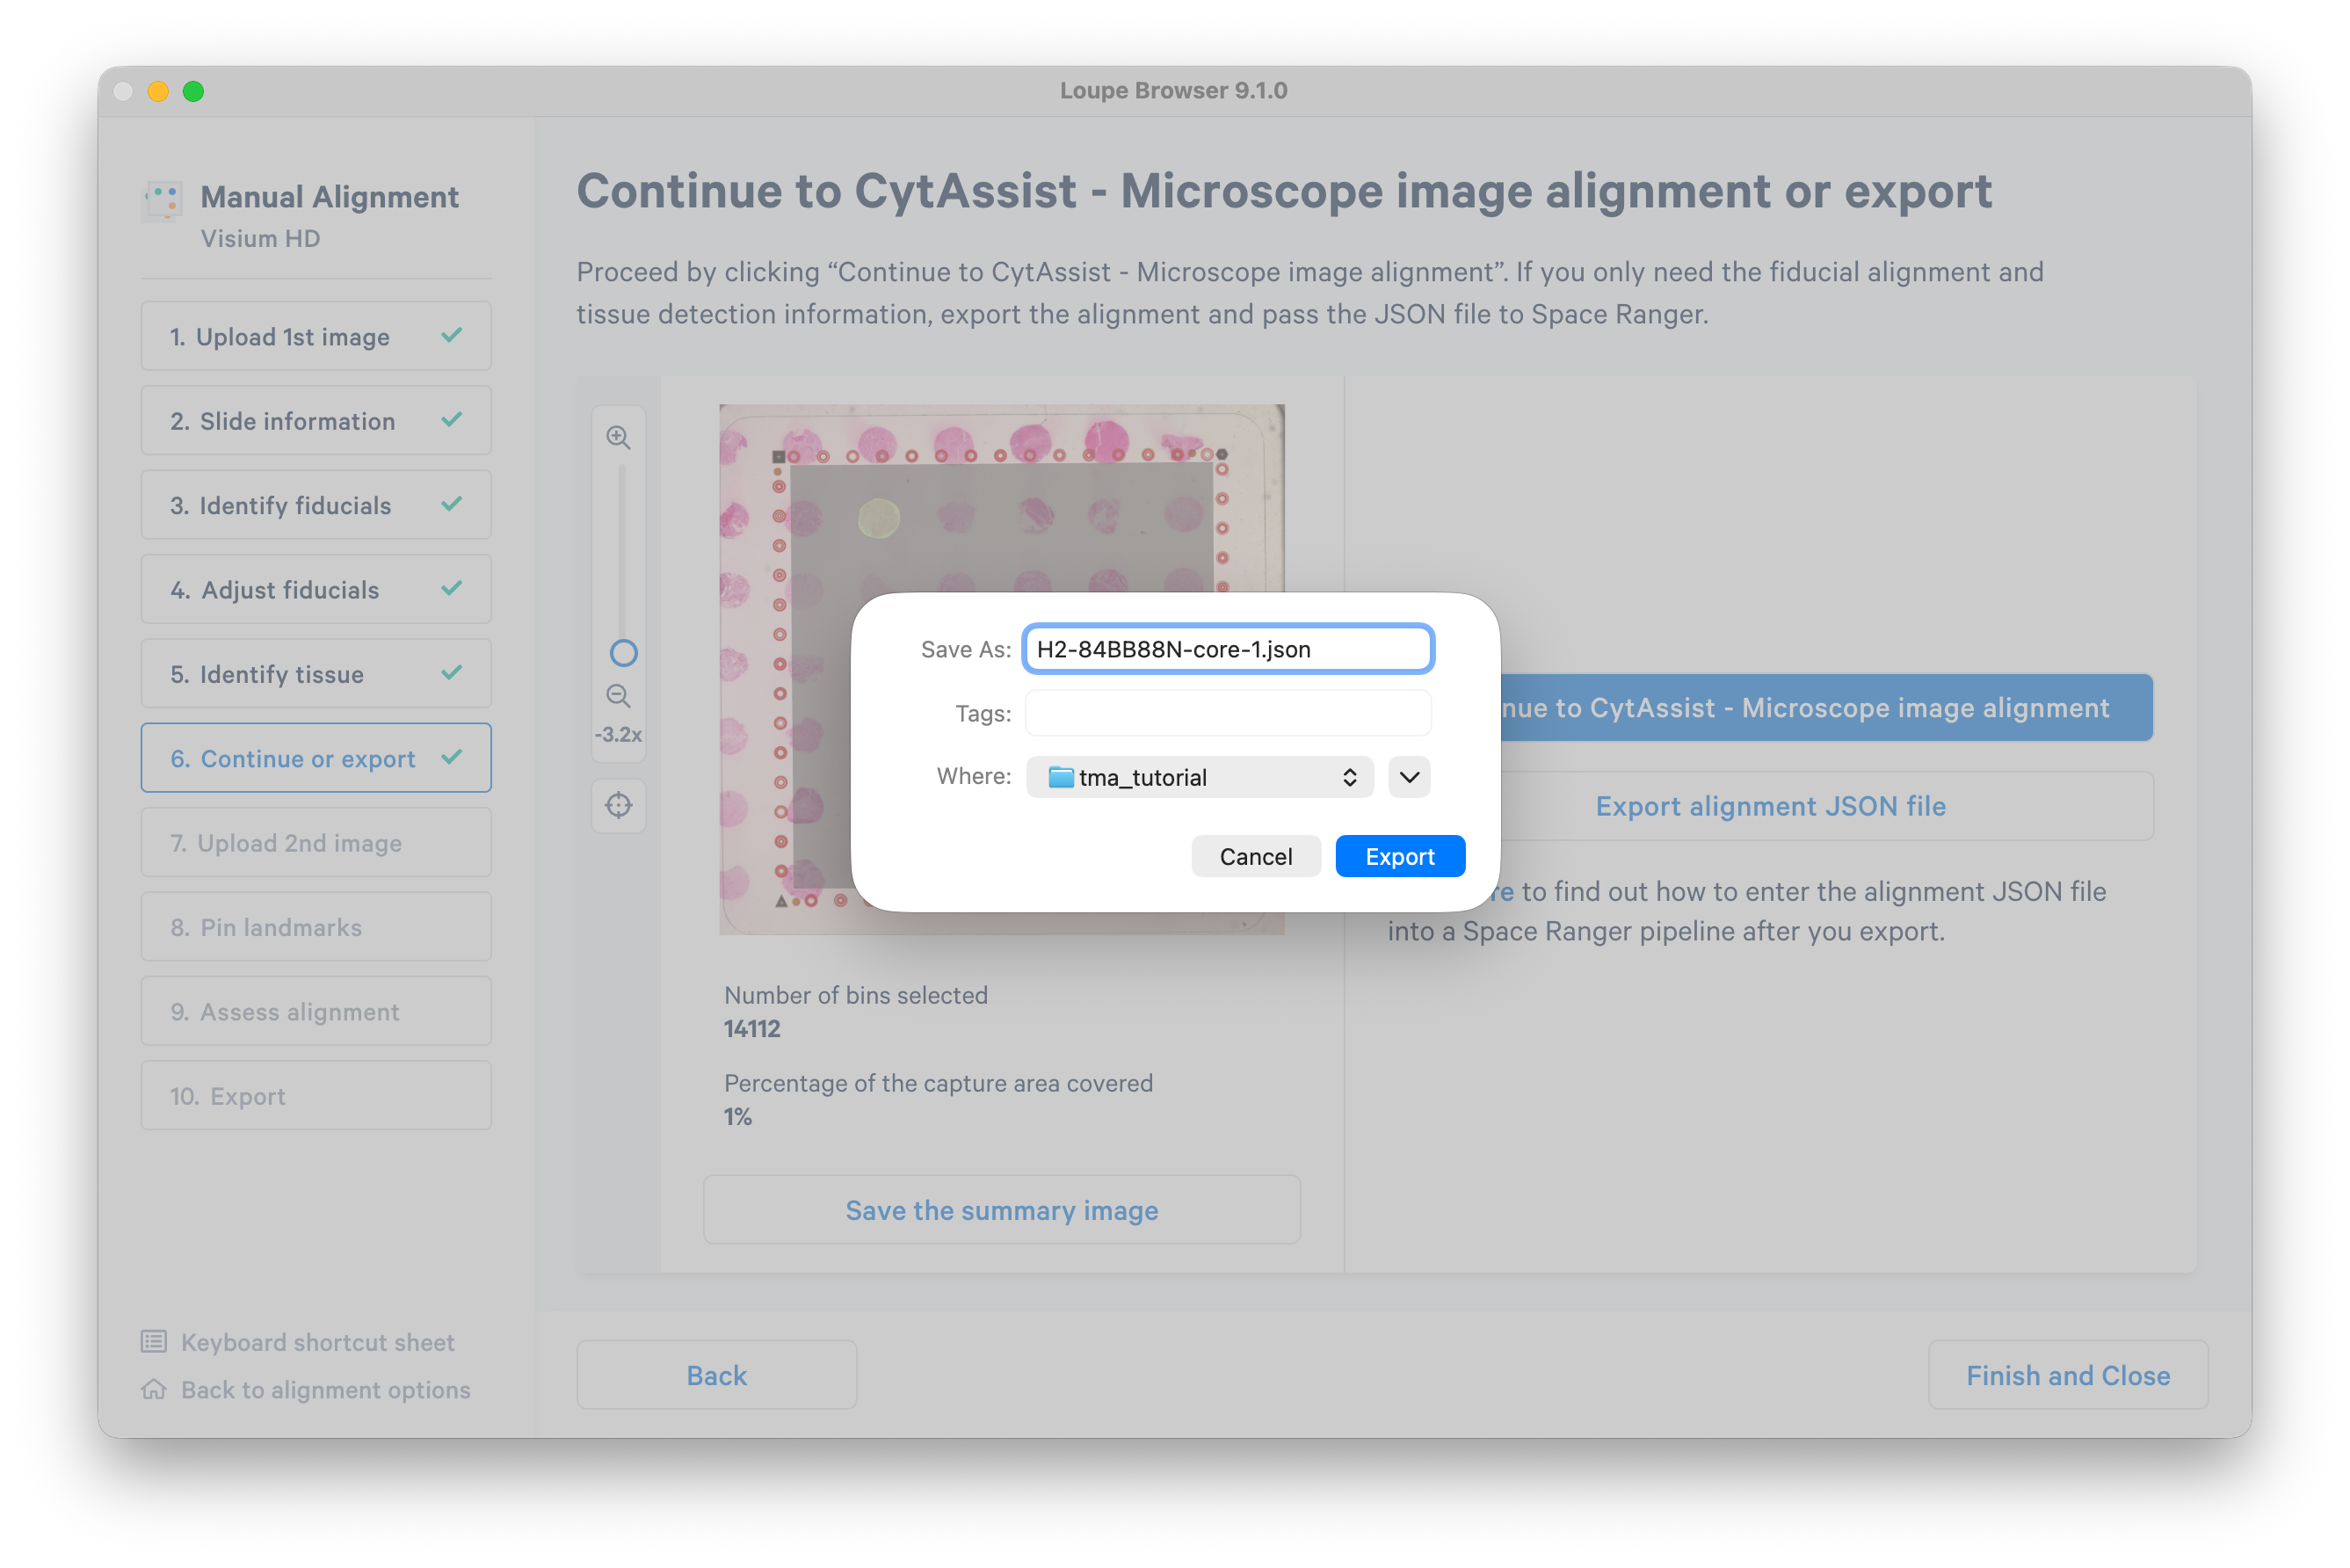
It is not necessary to complete the remaining steps in the manual alignment workflow, but instead you may go back to select and export as many tissue cores as you wish. In this tutorial, you may proceed with one selected core.
Finally, transfer the JSON file to your Linux working directory where you are running Space Ranger. To run Space Ranger, use a command like this:
spaceranger count --id=Visium_HD_11mm_Human_Breast_Cancer_TMA_core1 \
--fastqs=/path/to/sr-4-1-tma/tma-fastqs \
--probe-set=/path/to/sr-4-1-tma/Visium_Human_Transcriptome_Probe_Set_v2.1.0_GRCh38-2024-A.csv \
--slidefile=/path/to/sr-4-1-tma/H2-84BB88N.vlf \
--slide=H2-84BB88N \
--area=A \
--image=/path/to/sr-4-1-tma/Visium_HD_11mm_Human_Breast_Cancer_TMA_tissue_image.btf \
--cytaimage=/path/to/sr-4-1-tma/Visium_HD_11mm_Human_Breast_Cancer_TMA_image.tif \
--loupe-alignment=H2-84BB88N-core-1.json \
--create-bam=false \
--localmem=64 \
--localcores=8
The spaceranger count pipeline will run and provide output files for only the selected tissue core.