Adult Mouse Brain Coronal Section (Fresh Frozen)
Spatial Gene Expression dataset analyzed using Space Ranger 2.0.0

Learn about Visium Analysis
This dataset is part of the Alternative transcript isoform detection with single cell and spatial resolution Application Note. The Visium library input files, Space Ranger output files, and Oxford Nanopore library FASTQ files are provided in relevant tabs.
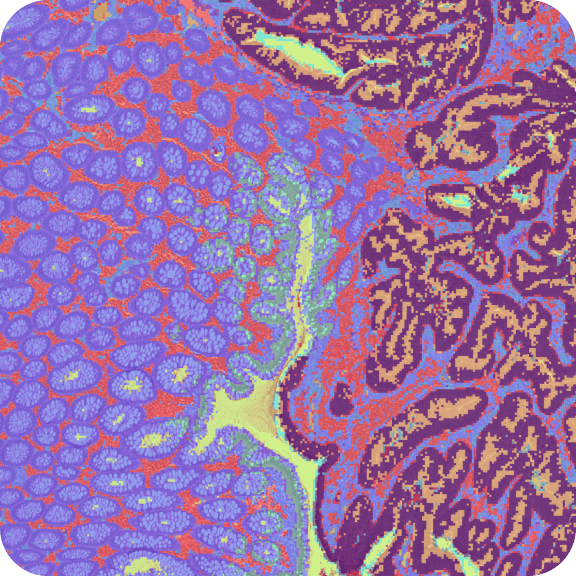
10x Genomics obtained fresh frozen mouse brain tissue from BioIVT Asterand. The tissue was embedded and cryosectioned as described in Visium Spatial Protocols - Tissue Preparation Guide Demonstrated Protocol (CG000240). Tissue sections of 10 µm thickness from a slice of the coronal plane were placed on Visium Gene Expression slides, then stained and imaged following the Methanol Fixation, H&E Staining & Imaging Demonstrated Protocol (CG000160).
The slide was cover-slipped and the H&E image acquired using a Nikon Ti2-E microscope with the following settings:
- Color camera
- 10X objective
- Numerical Aperture: 0.45
- Exposure: 2 ms
- Gain: 4.5X
Visium Spatial Gene Expression Library
Libraries were prepared following the Visium Spatial Gene Expression Reagent Kits User Guide (CG000239 Rev F).
- Sequencing instrument: Illumina NovaSeq
- Sequencing depth: 57,355 reads per spot
- Sequencing configuration: Paired-end (28 X 90)
- Sequencing coverage: Read 1: 28bp Read 1 (16bp Visium spatial barcode, 12bp UMI), Read 2: 120bp (transcript), 10bp i7 sample barcode and 10bp i5 sample barcode
- Dual-index set: SI-TT-E4
- Slide: V10L08-332
- Area: C1
Oxford Nanopore Technologies Library
Oxford Nanopore cDNA libraries were prepared starting from full-length, 10x barcoded cDNA using the PCR-cDNA Sequencing Kit per the manufacturer’s protocol, "Single-cell transcriptomics with cDNA prepared using 10X Genomics".
Each long-read sequencing library was loaded onto an individual PromethION Flow Cell. Libraries were sequenced for 72 hours and base calling was performed using MinKNOW’s Super Accurate Base Calling mode (MinKNOW software version 22.03.04).
Key cell metrics were:
- Spots detected under tissue: 2,791
- Median UMI counts per spot: 13,540
- Median genes per spot: 4,420
This dataset is licensed under the Creative Commons Attribution 4.0 International (CC BY 4.0) license. 10x citation guidelines available here.