Cell type annotation refers to the process of categorizing and assigning cell types to individual cells based on their gene expression profiles. These annotations are needed for understanding the cellular composition and diversity within a sample.
For more details about the algorithm, required input files, and how to run the pipeline, see the Cell Type Annotation page.
Cell type annotation outputs are written to a cell_types directory, organized into a subfolder per annotation model: Azimuth for the Pan-Human Azimuth model and 10x_Cloud for the cloud-based models. The exact set of files depends on the pipeline, inputs, and model used. The cell_annotation_results.json.gz file is produced only by the 10x Cloud models, so it appears in 10x_Cloud but not Azimuth.
As of Cell Ranger v10.1, annotation results are summarized in web_summary.html: cellranger count and cellranger multi embed the annotation summary as a tab in the main web_summary.html, and the standalone cellranger annotate pipeline writes its own web_summary.html.
cellranger count writes annotation outputs to the outs/cell_types/ directory:
outs/
├── cell_types
│ ├── 10x_Cloud
│ │ ├── cell_annotation_differential_expression.csv
│ │ ├── cell_annotation_results.json.gz
│ │ └── cell_types.csv
│ └── Azimuth
│ ├── cell_annotation_differential_expression.csv
│ └── cell_types.csv
├── web_summary.html
cellranger annotate writes the same per-model cell_types/ contents, plus an annotated Loupe Browser file at the top level of outs/ when a .cloupe file is provided via the --cloupe parameter:
outs/
├── cell_annotation_sample_cloupe.cloupe
├── cell_types
│ ├── 10x_Cloud
│ │ ├── cell_annotation_differential_expression.csv
│ │ ├── cell_annotation_results.json.gz
│ │ └── cell_types.csv
│ └── Azimuth
│ ├── cell_annotation_differential_expression.csv
│ └── cell_types.csv
├── web_summary.html
| File Name | Description |
|---|---|
cell_annotation_sample_cloupe.cloupe | The Loupe Browser file from the original analysis, annotated with high-level cell types. Only output by the cellranger annotate pipeline when a .cloupe file is provided via the --cloupe parameter; cellranger count does not generate this file. |
cell_annotation_results.json.gz | Detailed evidence of how each cell has been assigned a cell type by the algorithm, broken down by dataset IDs in the reference database and nearest-neighbors in each. 10x Cloud models only (10x_Cloud subfolder). |
cell_types.csv | Cell type annotations for each barcode. Columns vary by model; see Cell types CSV. |
cell_annotation_differential_expression.csv | Table listing genes differentially expressed in each detected cell type, along with log2 fold-change and associated p-value. |
When running cellranger multi, the annotation summary is embedded as a tab in the multi web summary HTML, with no separate annotation web summary generated. Annotation outputs appear in two places: aggregated results across all samples in the top-level outs/cell_types/ directory (prefixed with all_), and per-sample results in each outs/per_sample_outs/<sample>/cell_types/ directory.
The aggregated outputs across all samples are saved in outs/cell_types/:
outs/
├── cell_types
│ ├── 10x_Cloud
│ │ ├── all_cell_annotation_results.json.gz
│ │ └── all_cell_types.csv
│ └── Azimuth
│ └── all_cell_types.csv
| File Name | Description |
|---|---|
all_cell_annotation_results.json.gz | Detailed evidence of how each cell has been assigned a cell type by the algorithm, broken down by dataset IDs in the reference database and nearest-neighbors in each, for all samples. 10x Cloud models only (10x_Cloud subfolder). |
all_cell_types.csv | Cell type annotations for each barcode, for all samples. Columns vary by model; see Cell types CSV. |
The aggregated outs/cell_types/ outputs do not include a differential expression CSV. The per-sample outputs in outs/per_sample_outs/<sample>/cell_types/ follow the same per-model layout as cellranger count, including cell_annotation_differential_expression.csv:
outs/
├── per_sample_outs
│ └── <sample>
│ └── cell_types
│ ├── 10x_Cloud
│ │ ├── cell_annotation_differential_expression.csv
│ │ ├── cell_annotation_results.json.gz
│ │ └── cell_types.csv
│ └── Azimuth
│ ├── cell_annotation_differential_expression.csv
│ └── cell_types.csv
The contents of these files are detailed below.
File Name: web_summary.html
Description: A web summary that presents key statistics and visualizations related to the annotation of your sample, allowing you to explore the distribution and characteristics of cell types in your dataset. As of Cell Ranger v10.1, the standalone cellranger annotate pipeline writes its own web_summary.html dedicated to annotation results. When annotation is run within cellranger count or cellranger multi, the same visualizations are embedded as a tab in the main web_summary.html.
Key summary visualizations and tables generated from running the annotation pipeline on a publicly available 10x Genomics dataset are described below.
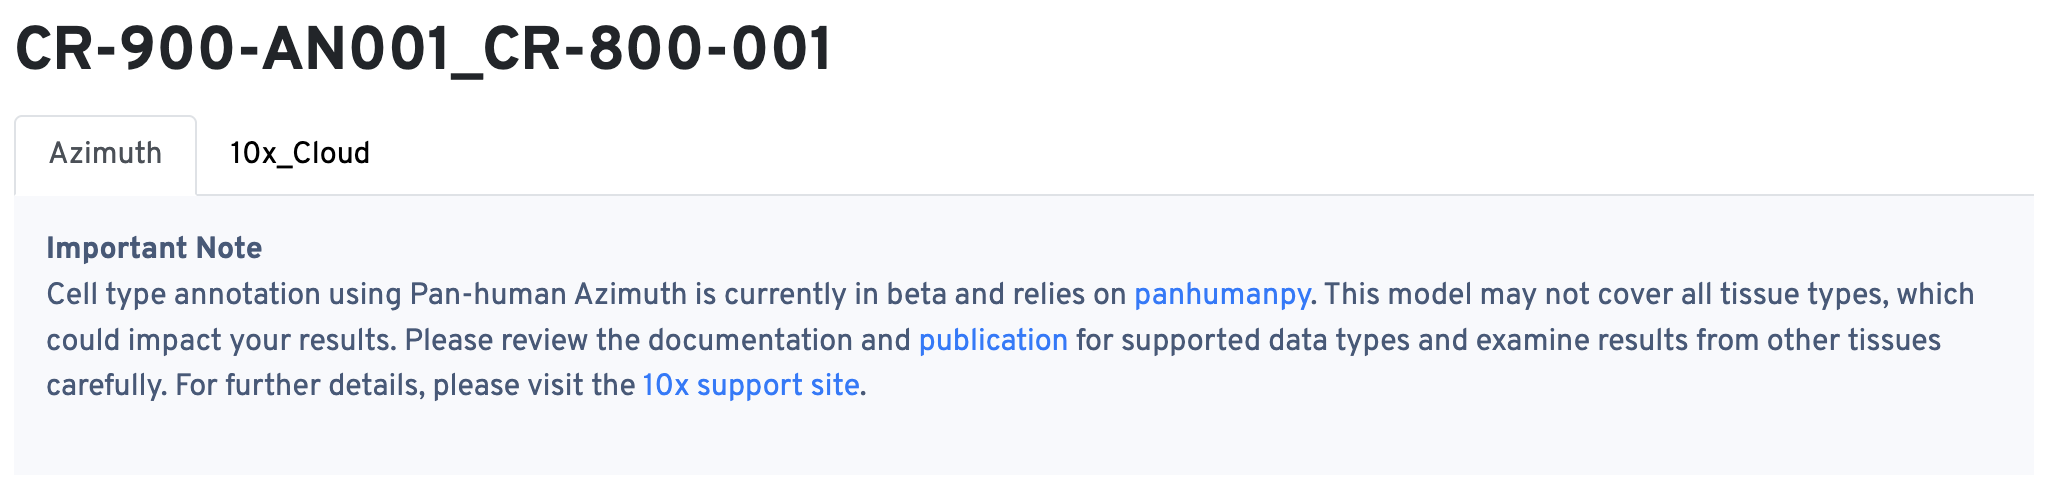
Pan-Human Azimuth vs. cloud-based models
For human datasets, a tab at the top of the web_summary.html lets you toggle between the Pan-Human Azimuth and cloud-based models.
Cell type composition barchart
This chart provides a high-level summary of the cell types present in your sample. By clicking on each bar, you can explore more detailed annotations, revealing the contribution of specific subtypes to the broader cell types. This interactive visualization helps you quickly assess whether the expected cell types are present and suggests potential subtypes within the sample.
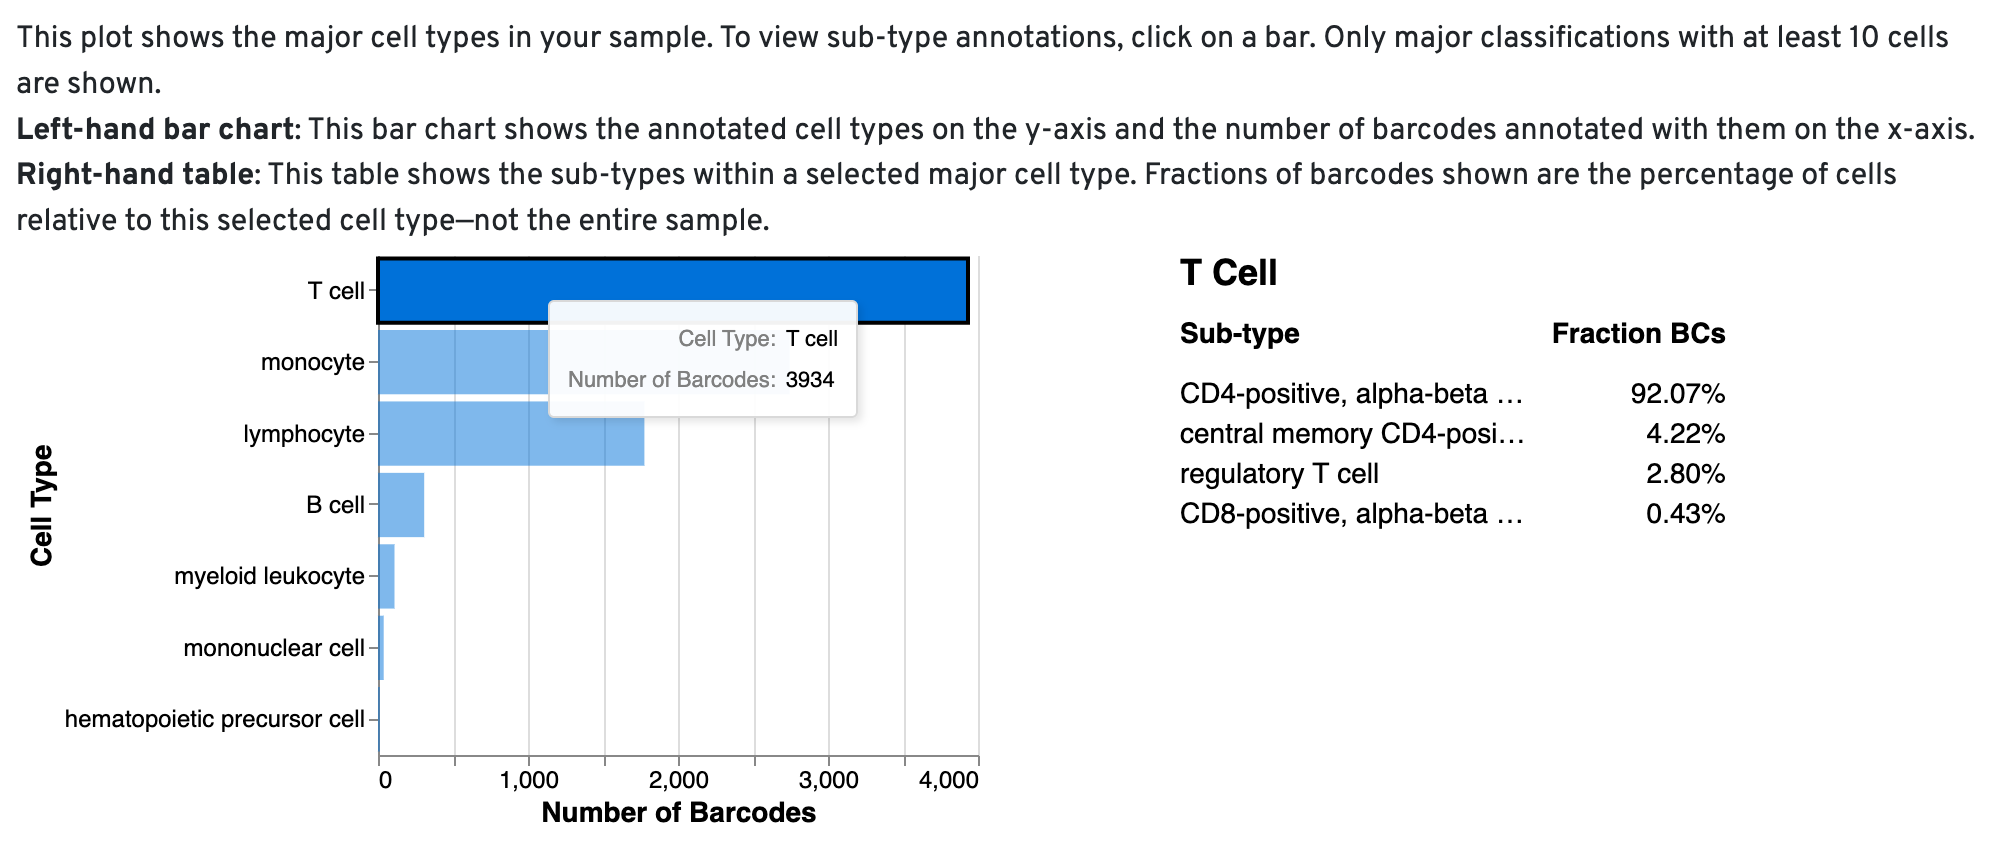
When the algorithm is unable to assign a specific cell type to a barcode, it labels the barcode as a "cell." You can review the cell_types CSV file to identify these barcodes marked as 'cells' and manually annotate them using tools like Loupe Browser or other community-developed resources.
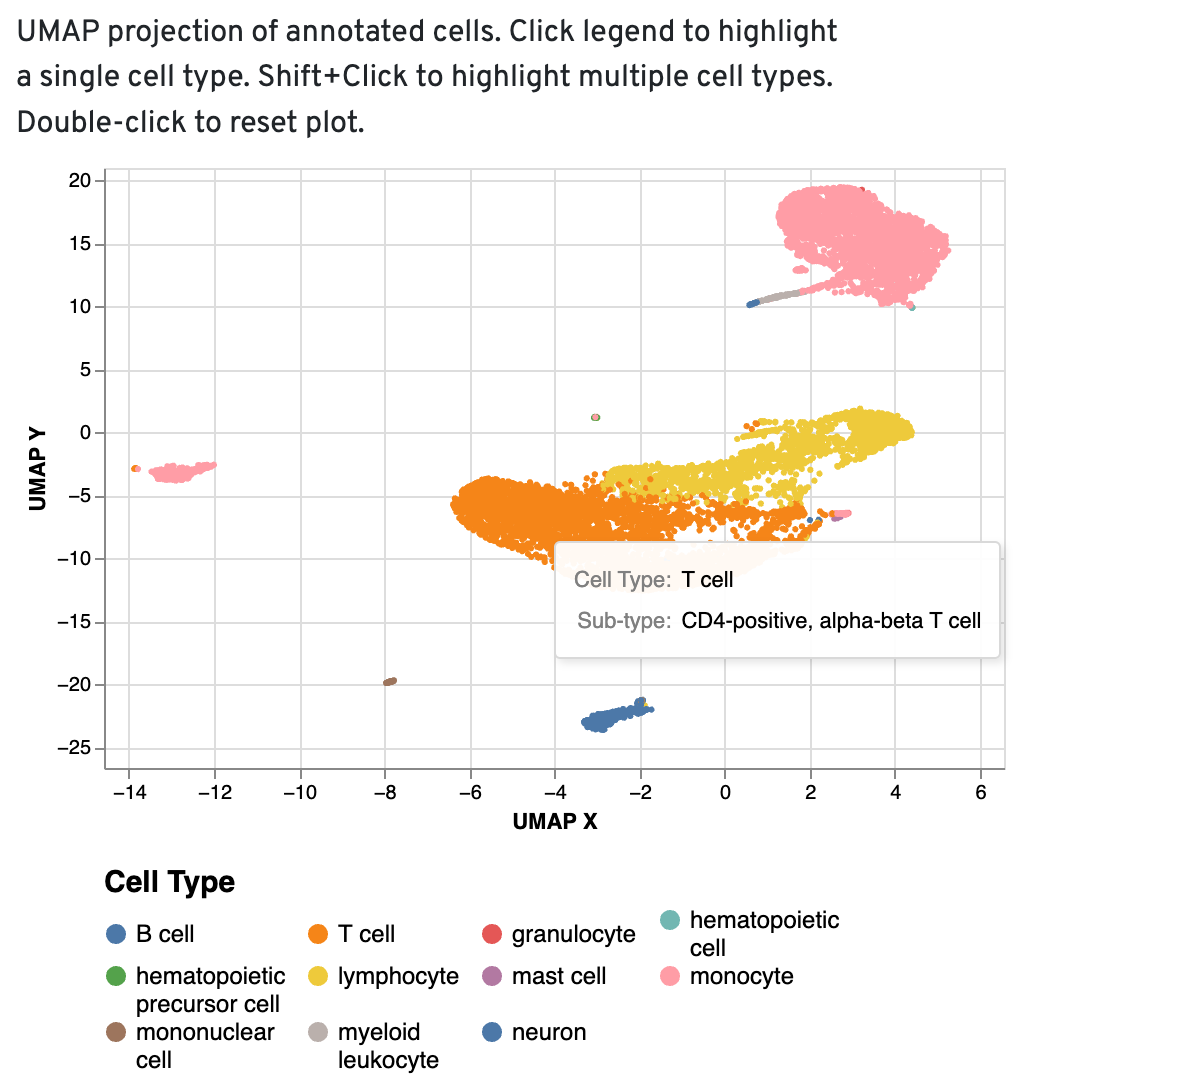
UMAP projections
The UMAP projection of cells is color-coded by the annotated high-level cell type. Distinct cell type populations with relevant cell type labels can be used as a starting point for further annotation in Loupe. If you notice high-level cell types appearing in low numbers or scattered across the UMAP—particularly unexpected cell types—these should be carefully reviewed and potentially re-annotated during further analysis.
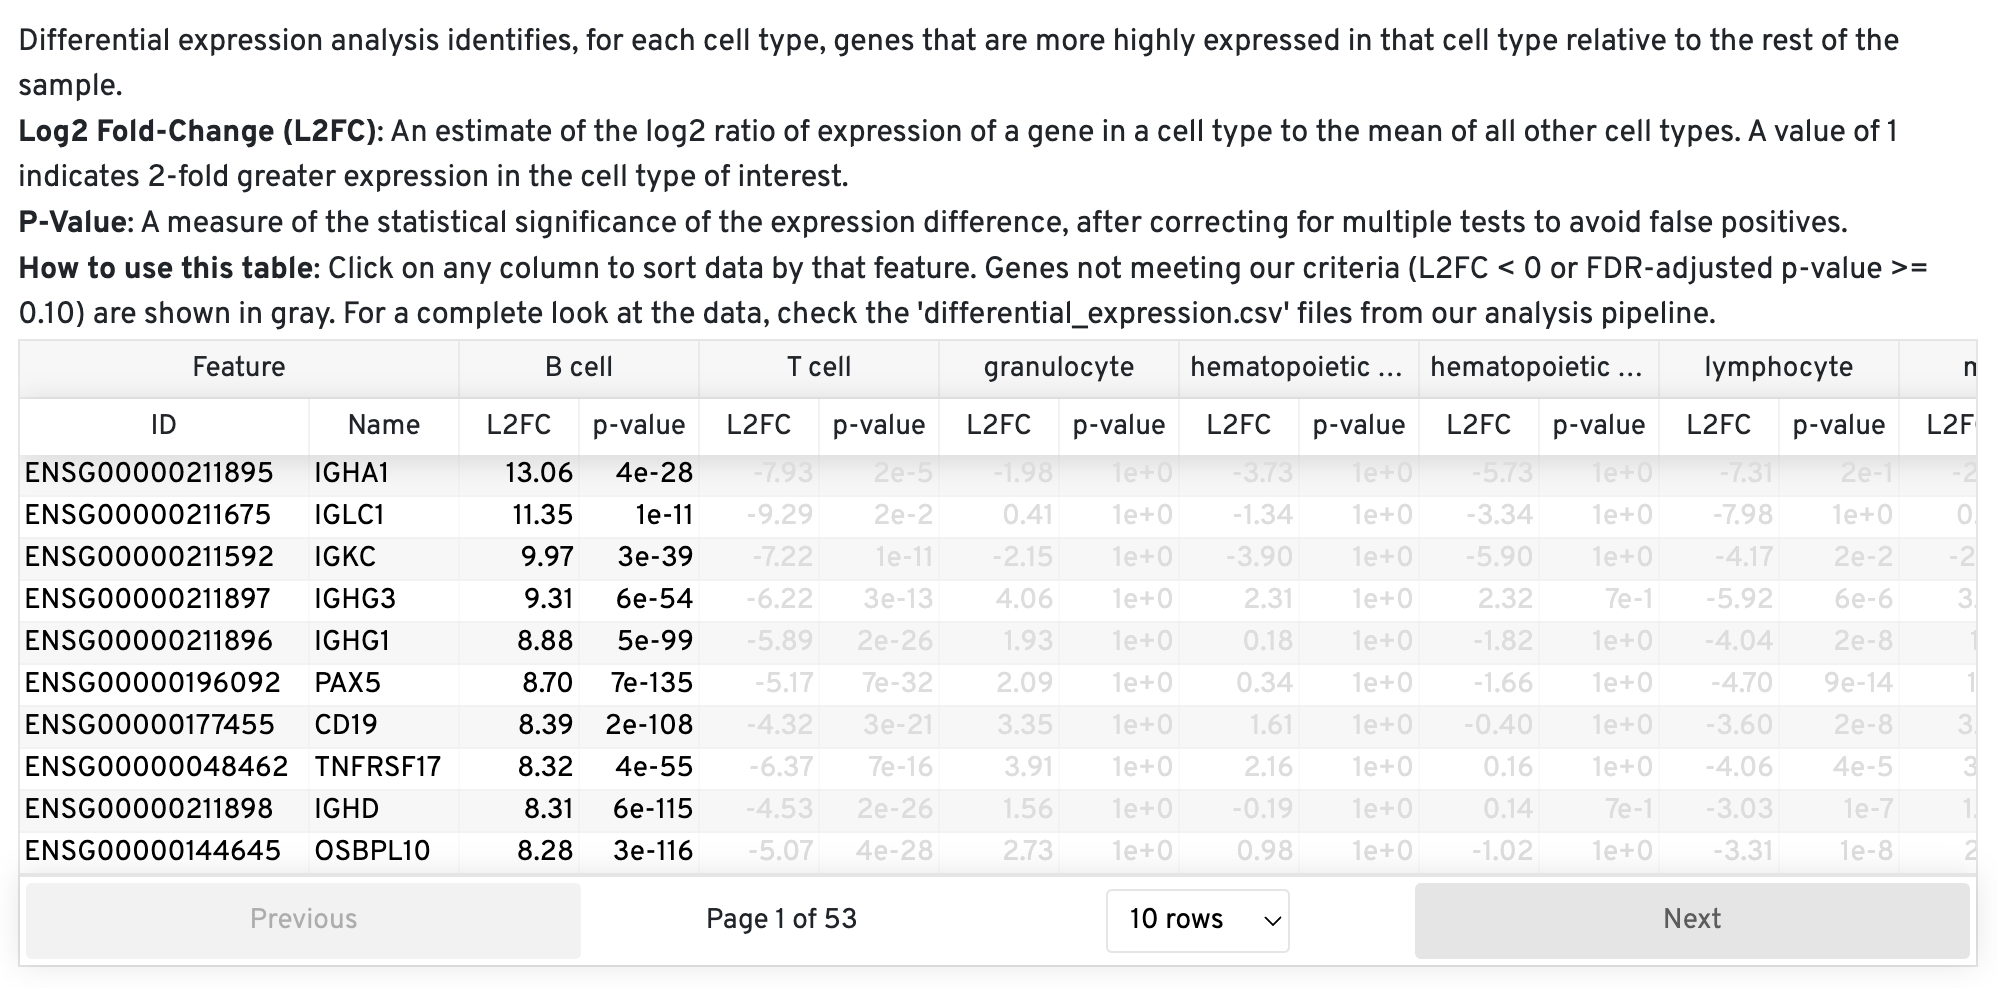
Top features by cell type
This view provides another method for quality control of the annotations. For correctly annotated cells, you should expect to see common marker genes. Mis-annotated cells may show features that are not commonly expressed in that cell type.
File Name: cell_annotation_sample_cloupe.cloupe
Description: A new .cloupe file is generated, which includes coarse cell types in the "Custom Groups" section. By default, this group is labeled "Cell Types," but the name can be customized during the annotation analysis setup.
File Name: cell_annotation_results.json.gz and/or all_cell_annotation_results.json.gz
Description: 10x Cloud models only. This file is a compressed JSON containing a list of dictionaries. Each element in the list represents the annotation results from a single barcode, derived from the cell annotation model.
For each barcode, the corresponding dictionary includes the top 500 matches obtained using an approximate-Nearest Neighbor (ANN) lookup. These matches are summarized for the total number of occurrences for a given cell type. While more cells supporting a particular annotation can increase your confidence in the annotation, occasionally the most common nearest-neighbor cell type can have a low number of supporting cells because the nearest-neighbors are split amongst several highly similar cell types (e.g., 'Cd16-Negative, Cd56-Bright Natural Killer Cell, Human' and 'Cd16-Negative, Cd56-Dim Natural Killer Cell'). The dataset_id corresponds to the Chan Zuckerberg CELL by GENE (CZ CELLxGENE) study from which the annotation was derived. To view this study, insert the id into this URL: https://cellxgene.cziscience.com/e/{dataset_id}.cxg/.
An example output is shown below:
{
"barcode": "AAACCAAAGAATGCAA-1",
"matches": [
{
"cell_count_in_model": 32,
"cell_type": "monocyte",
"dataset_ids_with_counts": [
{
"count_per_dataset": 30,
"dataset_id": "87ce26ed-e5d1-44b4-81cc-cc5b709a169f"
},
{
"count_per_dataset": 2,
"dataset_id": "b0e547f0-462b-4f81-b31b-5b0a5d96f537"
}
]
},
File Name: cell_types.csv and/or all_cell_types.csv
Description: This file contains the cell type annotation for each barcode and can be used to import the fine-scale cell type annotations directly into Loupe Browser.
The Pan-Human Azimuth model CSV file contains these columns:
barcode: The cell barcode being annotated.broad_cell_type: The high-level annotation of the cell type. For barcodes with low UMI counts (< 100), this field is set asUnassignedfor filtering out annotations with low UMI support.coarse_cell_type: The mid-level annotation of the cell type. Those coarse cell types are the display nodes we manually curated. For barcodes with low UMI counts (< 100), this field is set asLow UMI Barcodefor filtering out annotations with low UMI support.fine_cell_type: The original annotation derived from the model based on the most common cell type amongst the 500 nearest-neighbors. Note: This may be the same ascoarse_cell_typeif the original reference was only annotated to that level of detail. For barcodes with low UMI counts (< 100), this field is set asUnassigned.full_hierarchical_labels: A concatenation of the broad, coarse, and fine cell types, separated by pipes (|). For barcodes with low UMI counts (< 100), this field is set asUnassigned.final_level_softmax_prob: A probabilistic estimate of how correct the cell annotation is.coarse_cell_type_unfiltered: The high-level annotation of the cell type (e.g., T Cell, B Cell, Neutrophil, etc.). Those coarse cell types are the display nodes we manually curated. Not subject to filtering by UMI count.umi_count: The number of UMIs associated with the barcode.sample_name: This column is only present inall_cell_types.csv(output bycellranger multi) and specifies the sample that the barcode belongs to.
The 10x Cloud model CSV file contains these columns:
barcode: The cell barcode being annotated.coarse_cell_type: The high-level annotation of the cell type (e.g., T Cell, B Cell, Neutrophil, etc.). Those coarse cell types are the display nodes we manually curated. For barcodes with low UMI counts (< 100), this field is set asLow UMI Barcodefor filtering out annotations with low UMI support.fine_cell_type: The original annotation derived from the model based on the most common cell type amongst the 500 nearest-neighbors. Note: This may be the same ascoarse_cell_typeif the original reference was only annotated to that level of detail.cell_count_in_model: The number of cells in the model that support the givenfine_cell_typeannotation, with a maximum of 500 cells.coarse_cell_type_unfiltered: The high-level annotation of the cell type (e.g., T Cell, B Cell, Neutrophil, etc.). Those coarse cell types are the display nodes we manually curated. Not subject to filtering by UMI count.umi_count: The number of UMIs associated with the barcode.sample_name: This column is only present inall_cell_types.csv(output bycellranger multi) and specifies the sample that the barcode belongs to.
An example is shown below (from all_cell_types.csv). This example shows the 10x Cloud model format; the Azimuth all_cell_types.csv uses the columns listed above for the Pan-Human Azimuth model.
barcode,coarse_cell_type,fine_cell_type,cell_count_in_model,coarse_cell_type_unfiltered,umi_count,sample_name
AAACCAATCGGTAAGTACAGTCTG-1,Low UMI Barcode,erythrocyte,204,hematopoietic cell,31,Sample1
AAACCAGGTGTGTCGCACAGTCTG-1,Low UMI Barcode,erythrocyte,144,hematopoietic cell,51,Sample1
AAACCAGGTGTTAGTCACAGTCTG-1,Low UMI Barcode,erythrocyte,259,hematopoietic cell,7,Sample1
The number shown for cell_count_in_model reflects the level of support for a cell's annotation. The algorithm identifies the 500 most similar cells in the reference set using embeddings from both the query dataset and the reference database. The cell type assigned is the annotation that appears most frequently among these 500 nearest neighbors. For example, if 400 of the nearest neighbors are labeled as T cells and 100 as lymphocytes, the cell will be annotated as a T cell, and the cell_count_in_model will be 400. The maximum possible value for this metric is 500.
This number should be interpreted with caution as an indicator of confidence in the model’s assignment. A high fraction of nearest neighbors supporting a fine-level cell type can suggest greater confidence in the annotation. However, a low value does not necessarily indicate low confidence in the coarse cell type assignment. For example, a T cell coarse-level annotation might be supported by different T cell subtypes, each represented by relatively few cells, but with all 500 nearest neighbors still classified as T cells based on Cell Ontology terms. This nuance highlights two key points: (1) the cell_count_in_model should not be treated as a confidence metric, and (2) there is no threshold that can reliably serve as a confidence cutoff for this number.
File Name: cell_annotation_differential_expression.csv
Description: This file contains the results of a differential expression analysis conducted between coarse cell types. These differentially expressed genes can be used to check that the cell type contains the expected marker genes. The pipeline uses the same algorithm employed in Cell Ranger and Loupe Browser to calculate fold changes and p-values, ensuring consistency within these platforms.