Data quality assessment is a sample- and experiment-specific process. Here are some of the ways in which Xenium Explorer can help to check data quality. Contact support@10xgenomics.com for additional help.
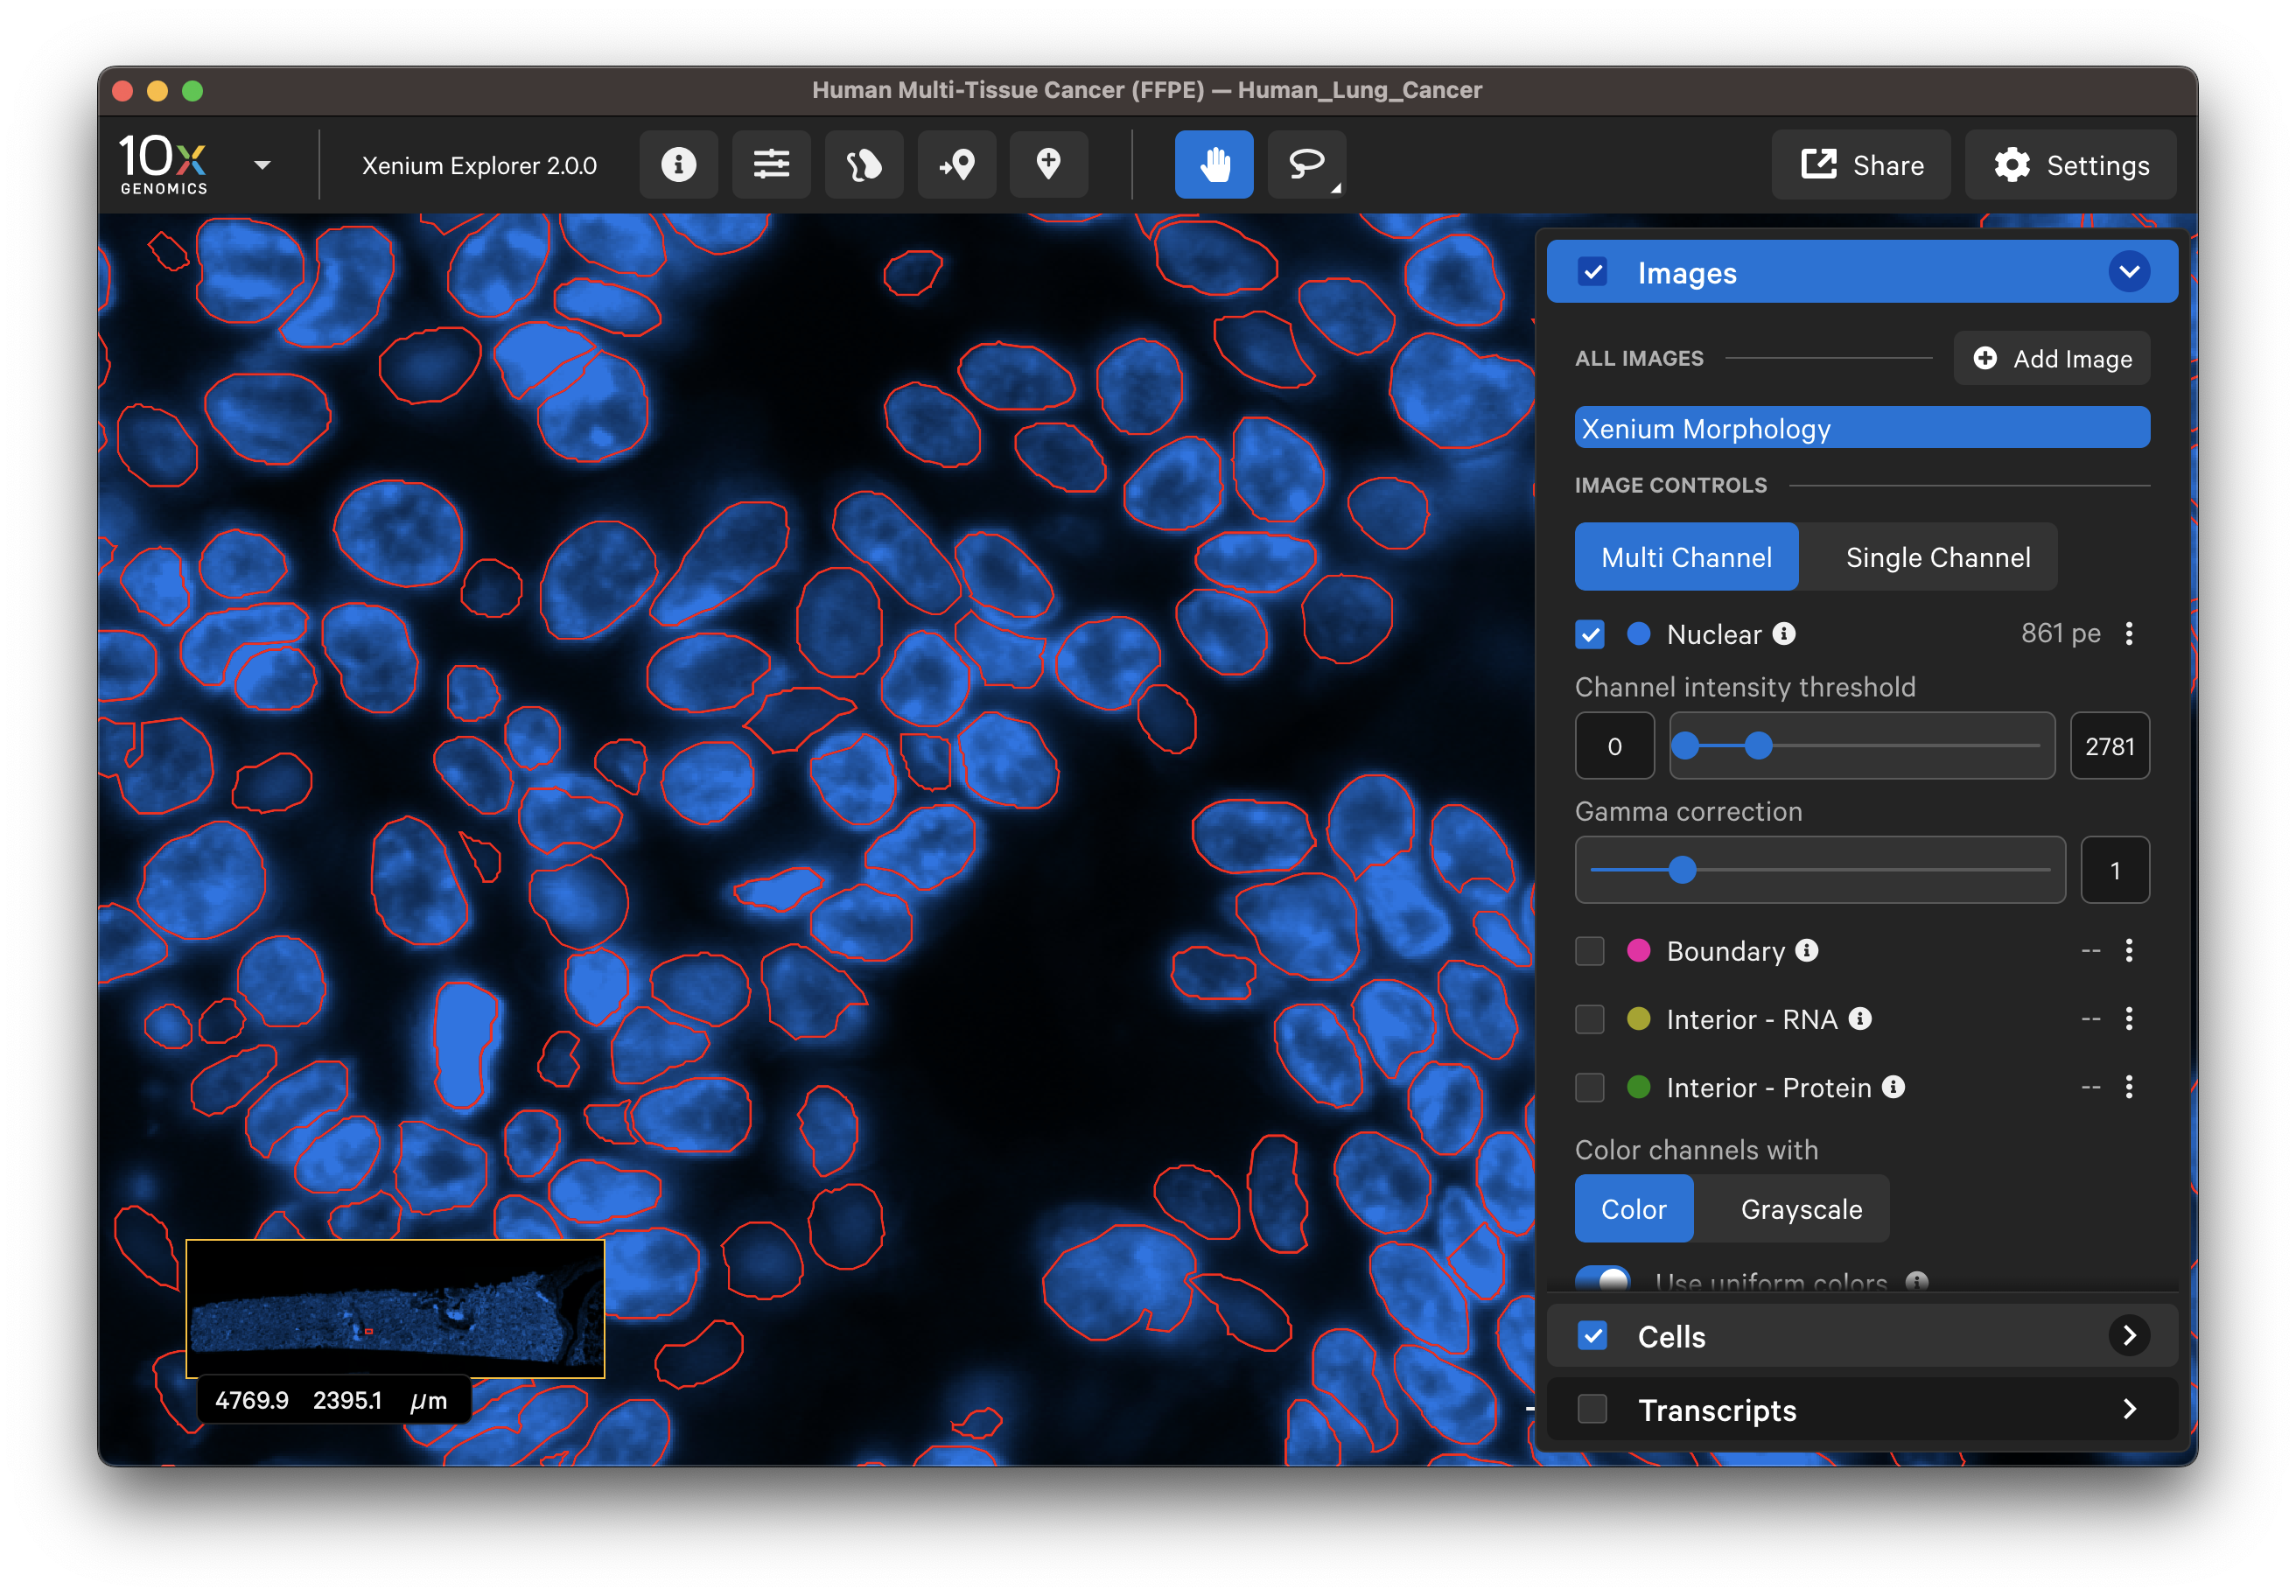
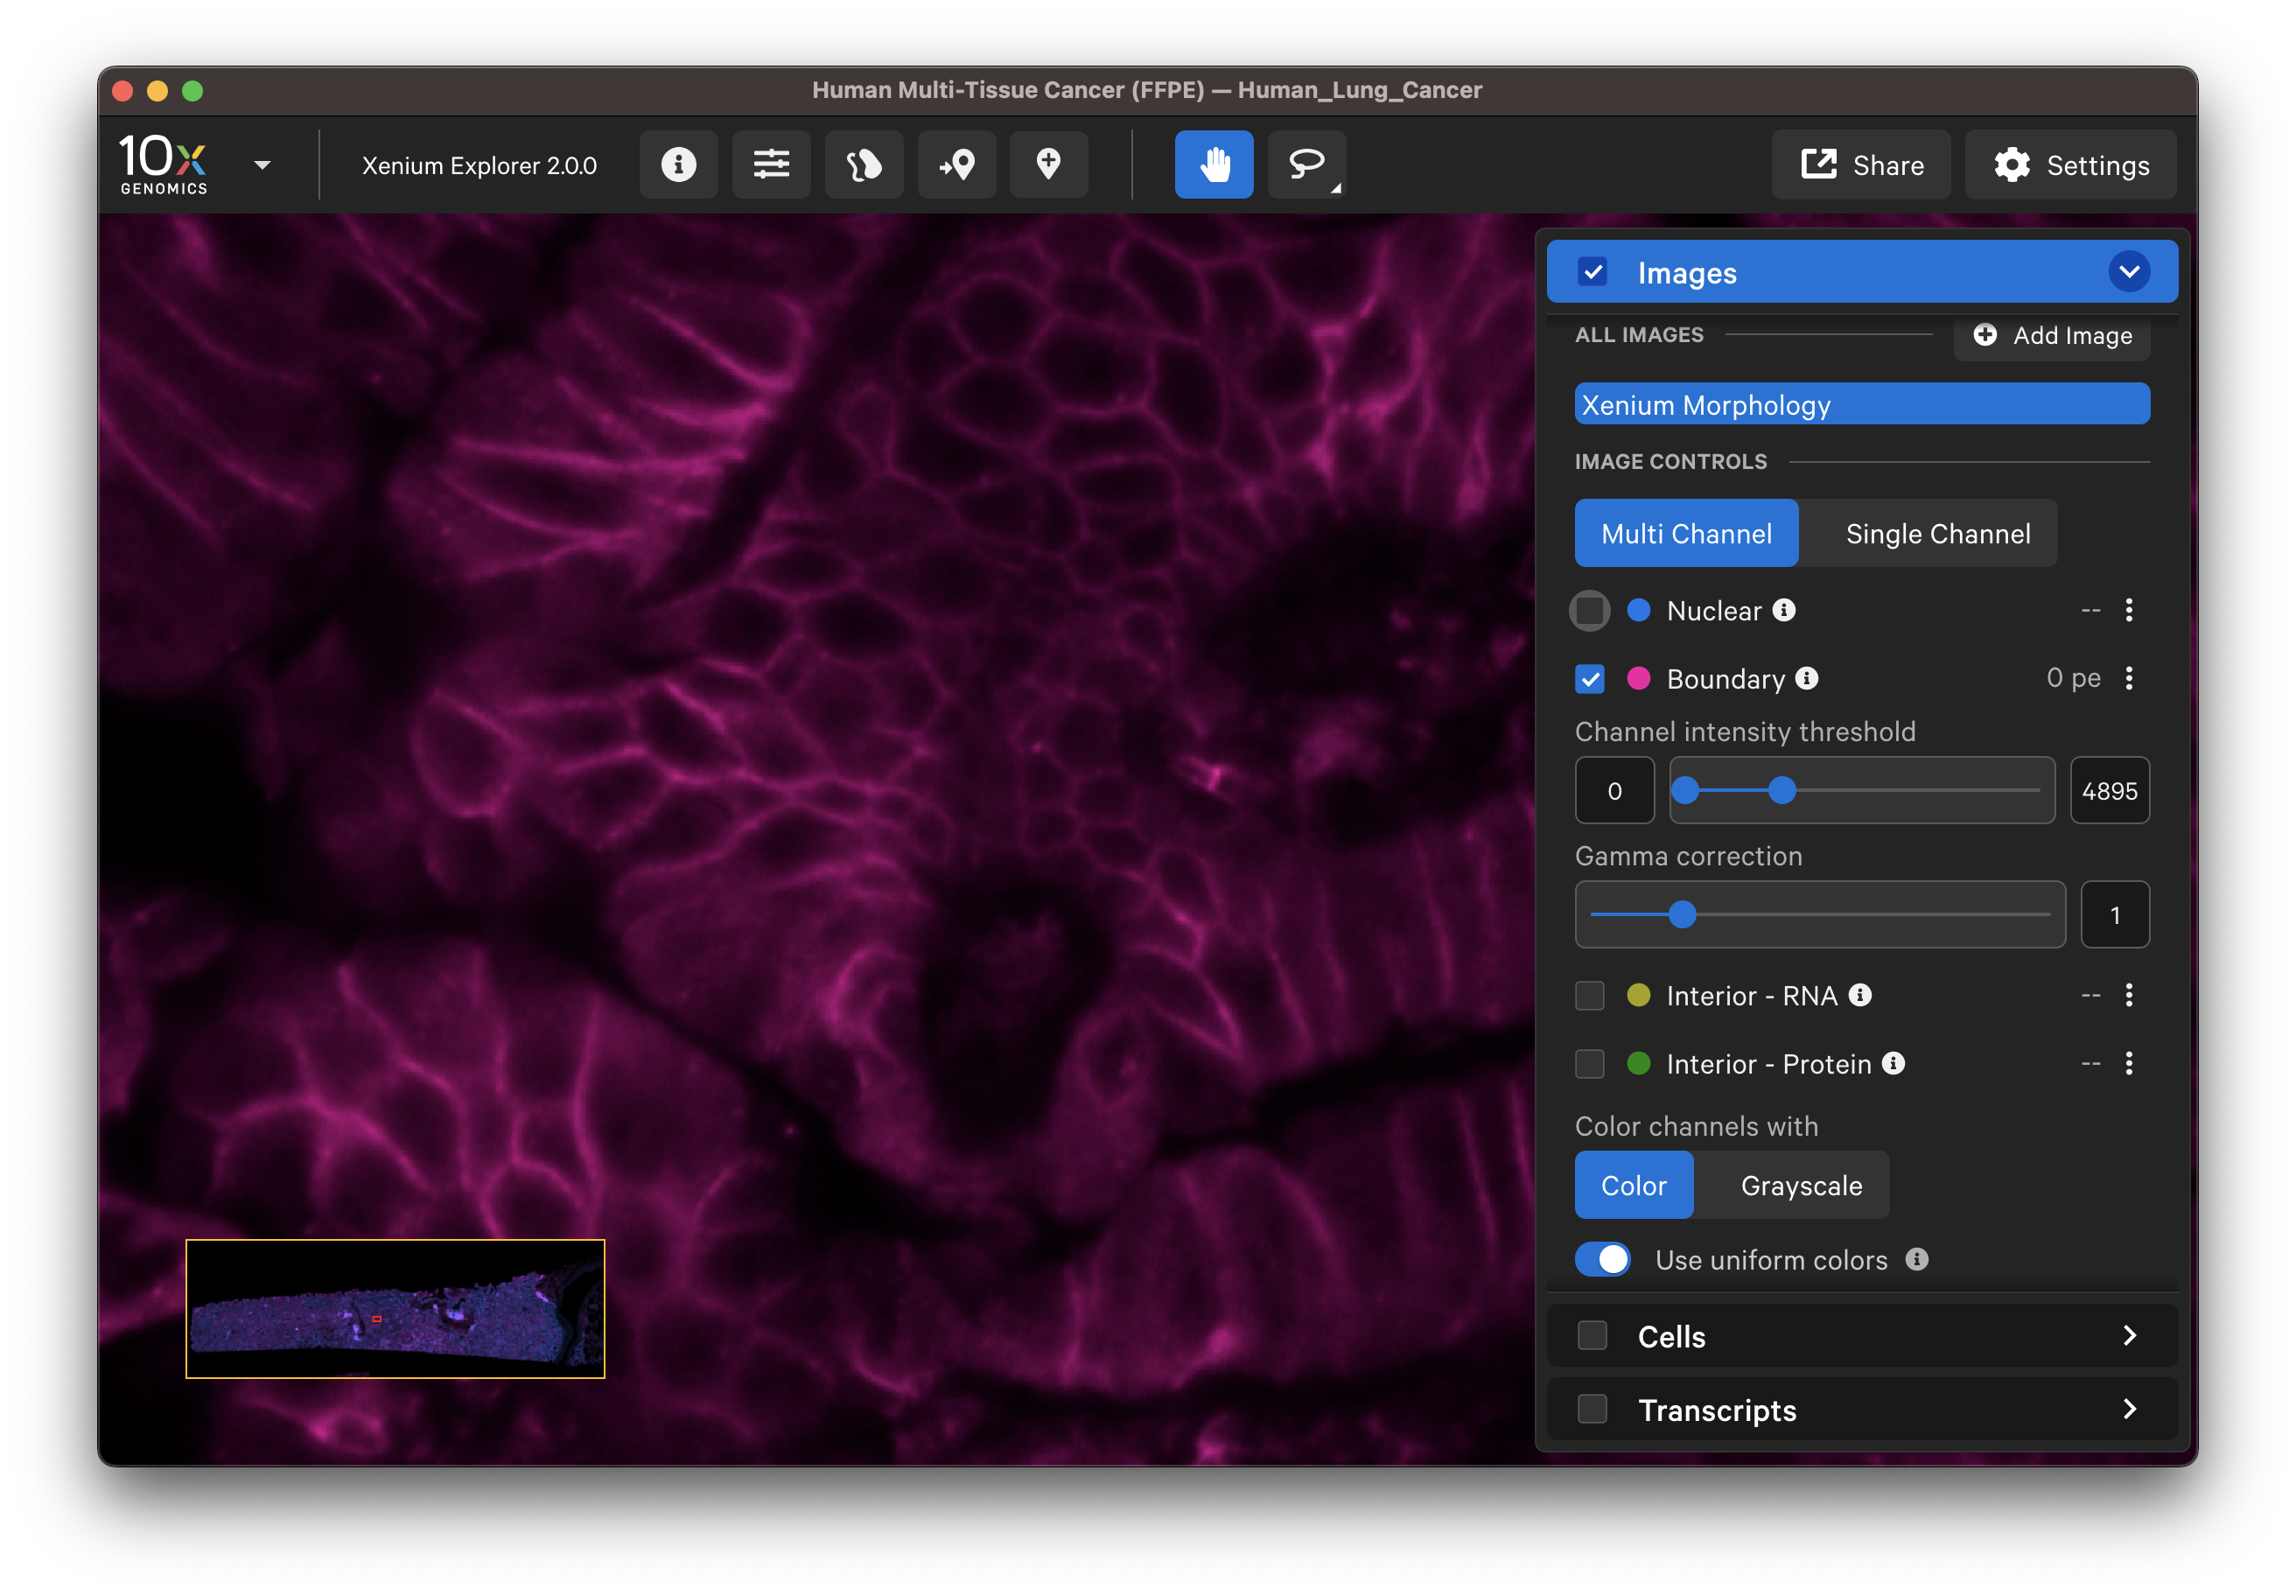
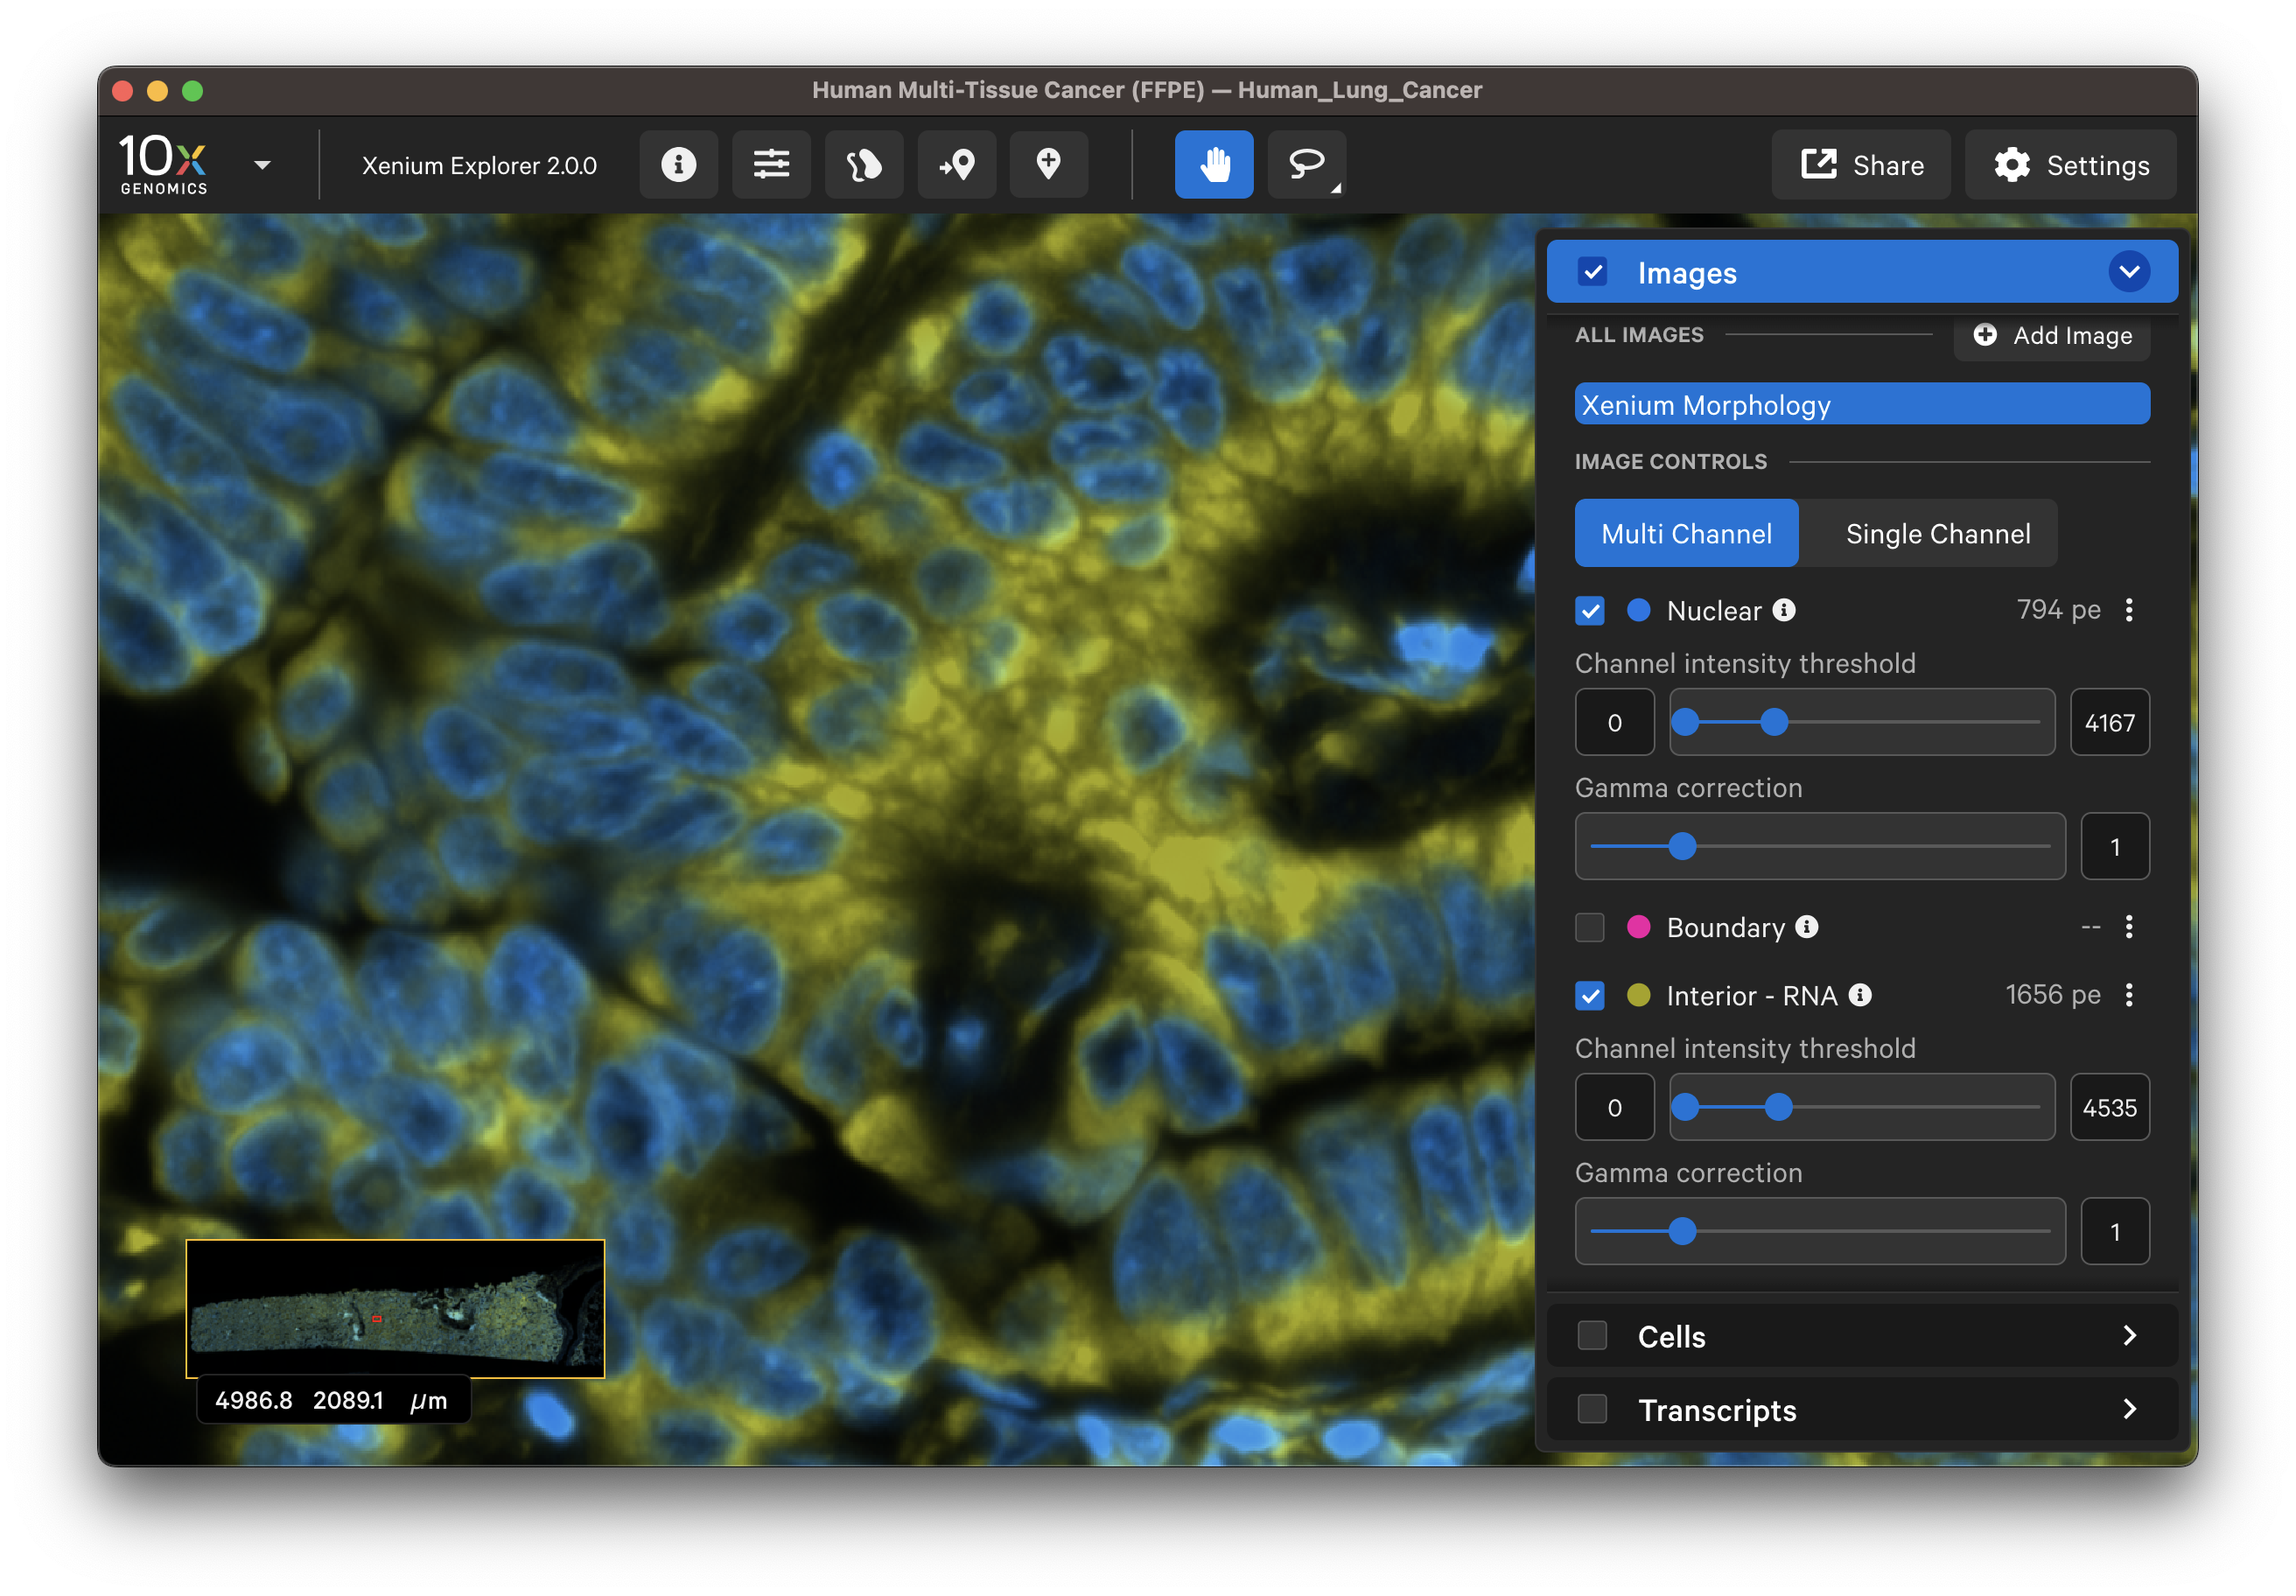
Inspect nuclei-stained (DAPI) images for tissue detachment or tears using the Image options settings. For data generated with the cell segmentation staining workflow, the interior protein stain (alphaSMA/Vimentin) image may help to identify morphological structure in tissues such as connective tissue or blood vessels.
Xenium Explorer displays nucleus and cell segmentation polygon boundaries, which are approximations for visualization performance. This enables qualitative assessment of segmentation results based on either nuclear expansion or multimodal cell segmentation algorithms. The true segmentation mask results are in the cells.zarr.zip output file.
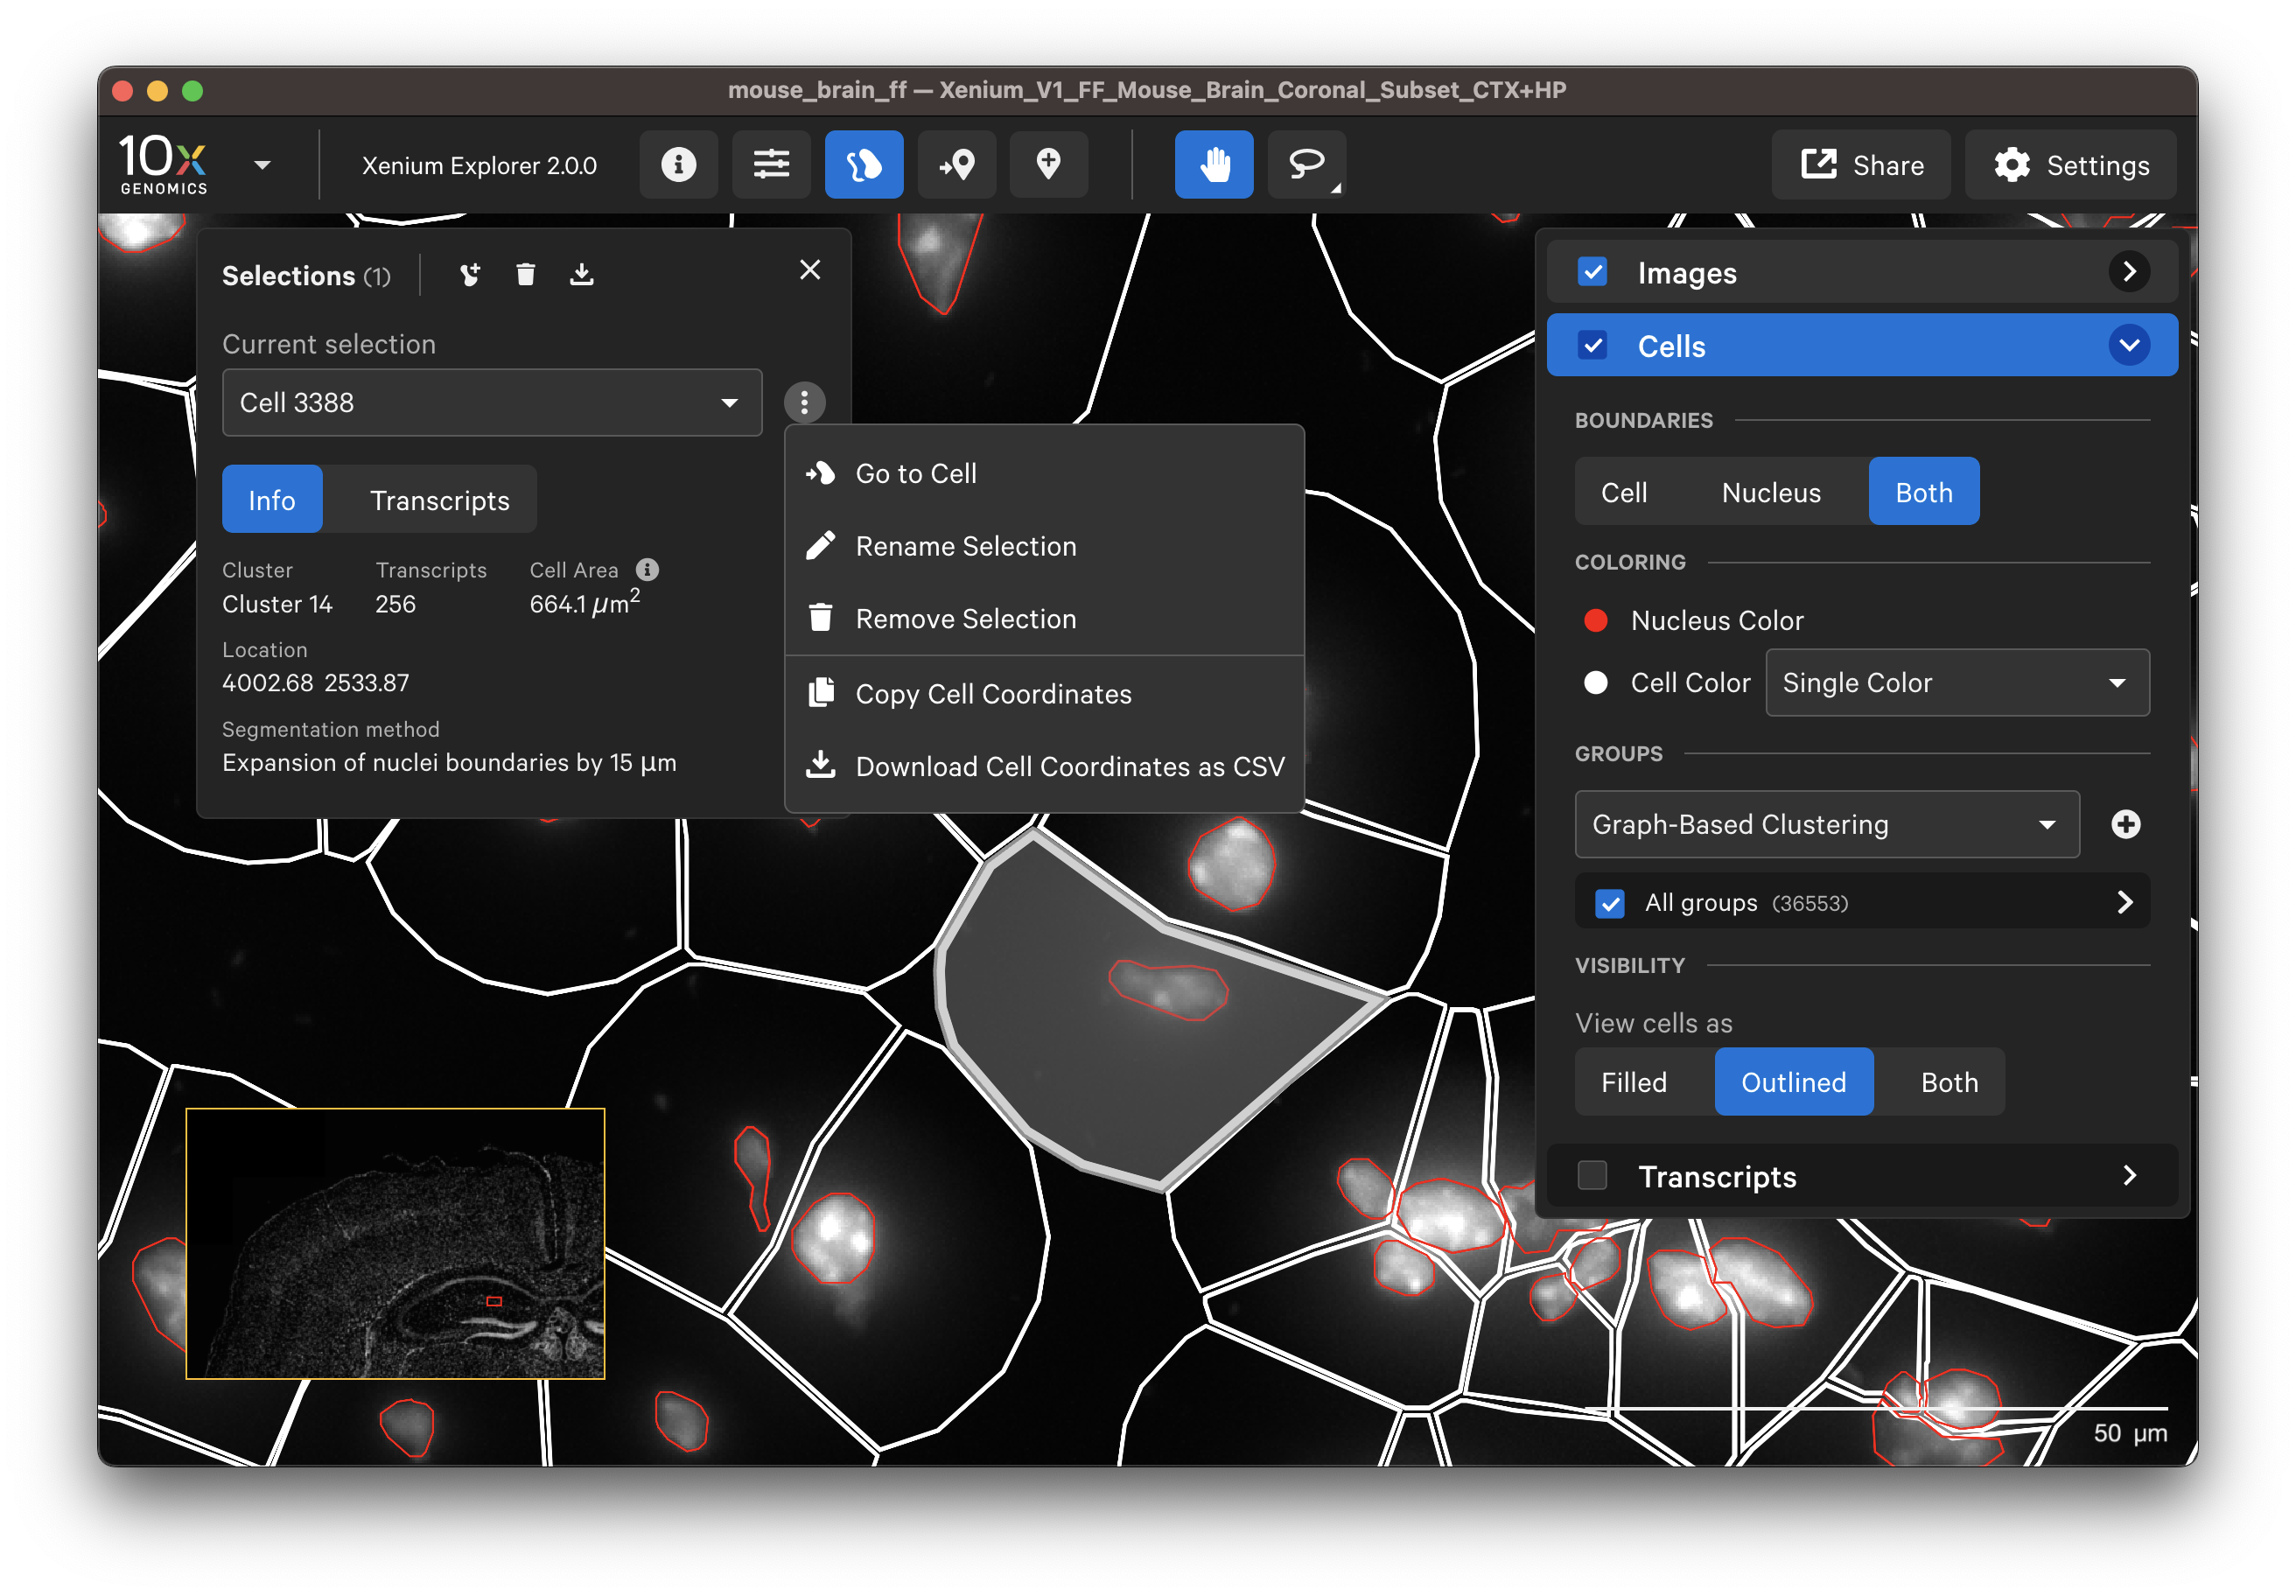
Display or export information about poorly segmented cells by clicking on a specific cell or using the lasso tools to select a region of interest. To remove some cells from downstream analysis, export cell IDs from Xenium Explorer and filter them out from the cell-feature matrix.
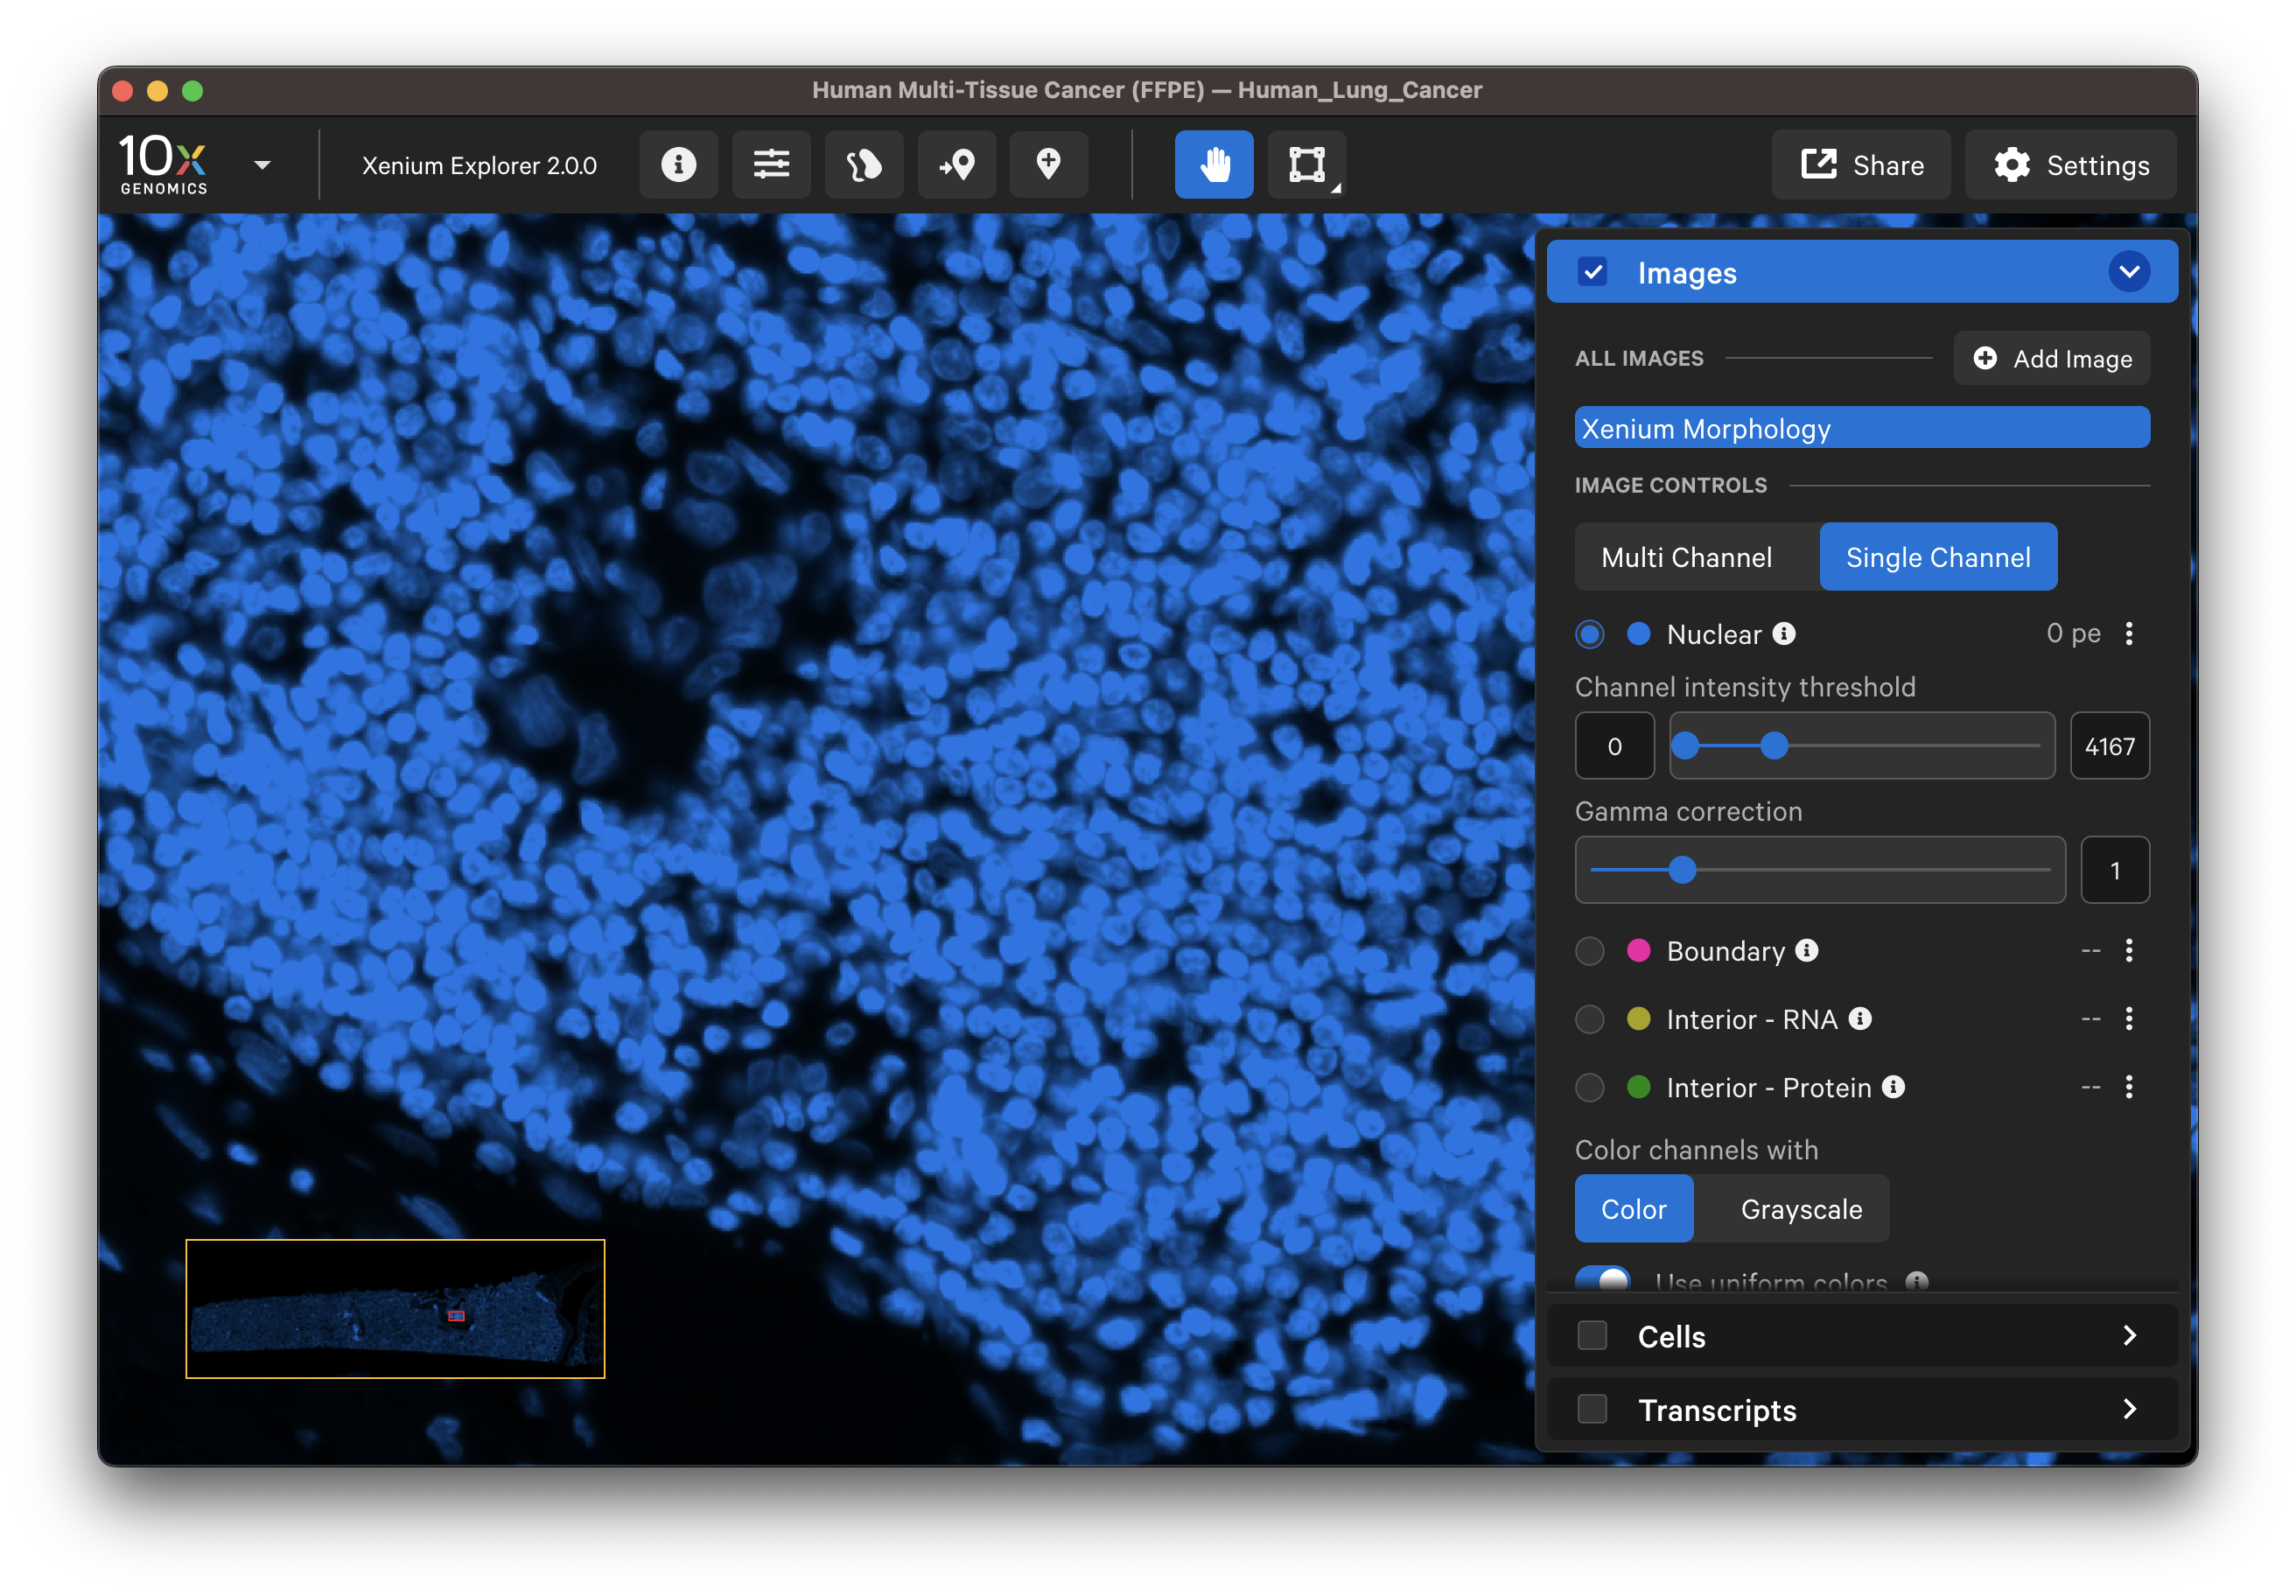
Zoom in to the DAPI image to compare the DAPI stain with the nucleus segmentation boundaries. Zoom out to locate and check segmentation of nuclei-dense regions of the DAPI image. When viewing the entire tissue area, check whether any regions with DAPI staining are missing segmented cells. Adjust the channel intensity threshold and gamma correction and if available, compare with post-Xenium stain images.
-
Do the segmented nuclei correspond well with the DAPI image?
-
If there are discrepancies, are the nuclei very dense in this region of the tissue? Nuclei-dense regions where nuclei overlap are more challenging to segment. Here is an example of some immune cells with overlapping nuclei:
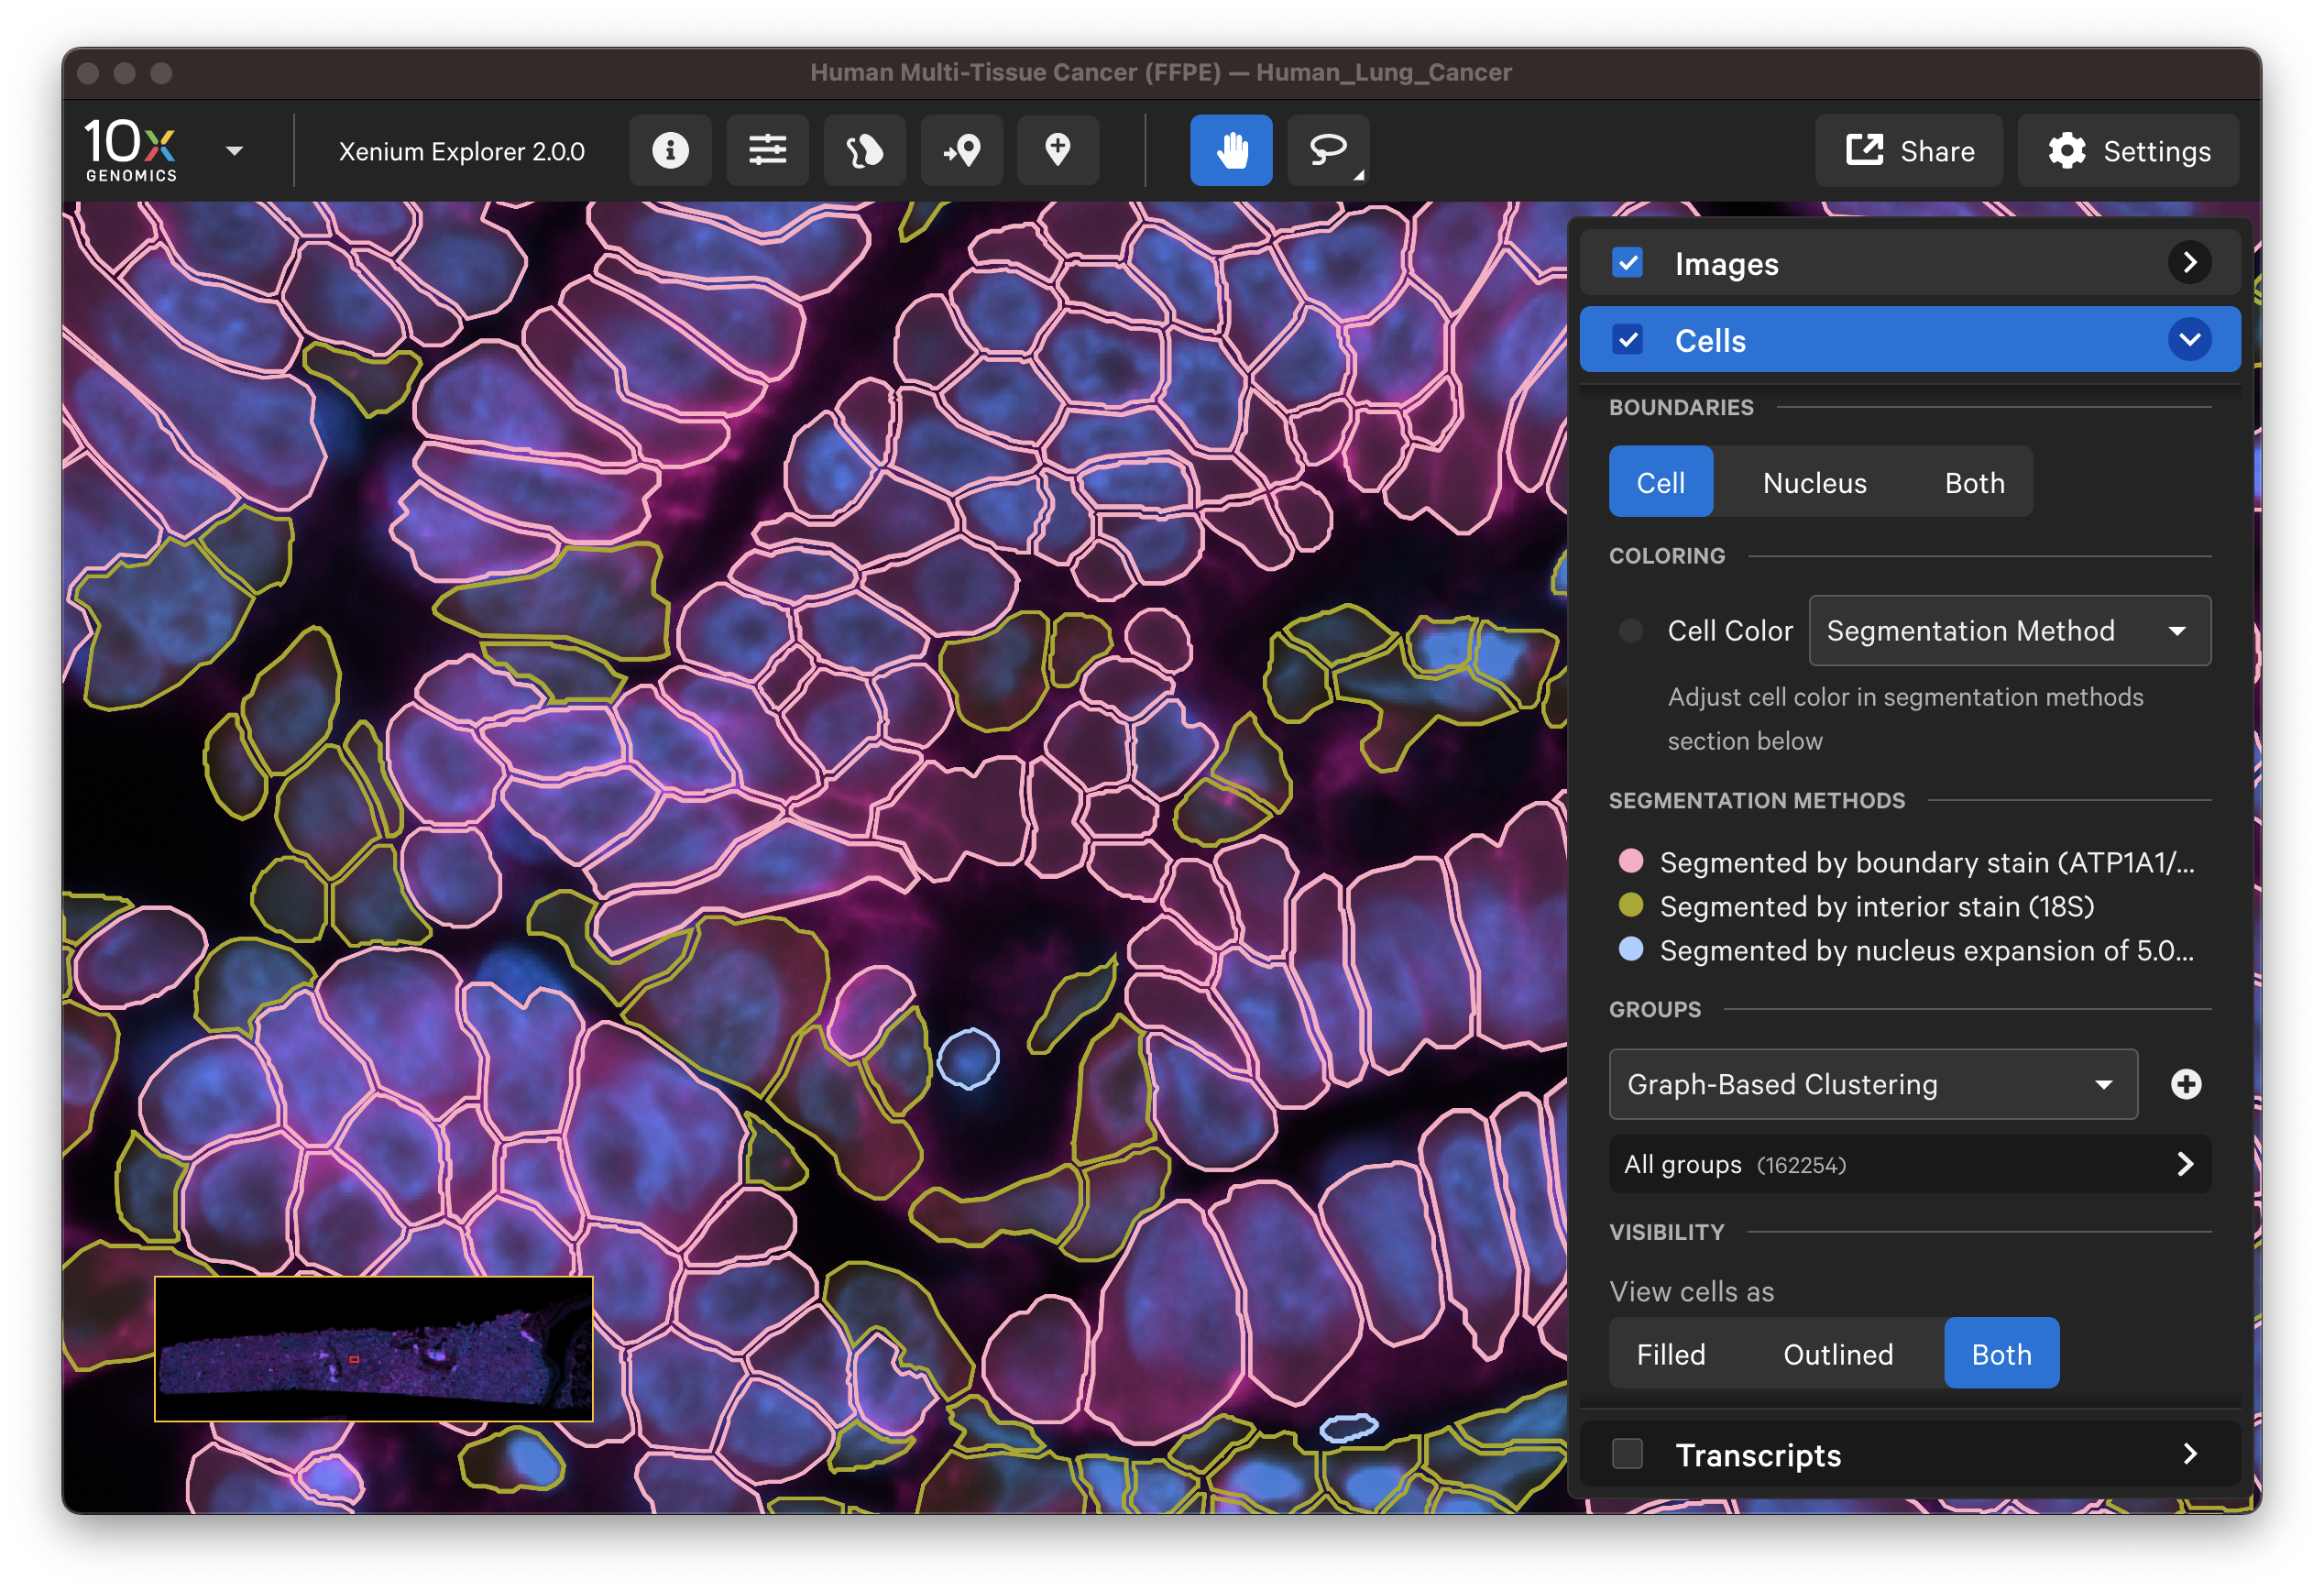
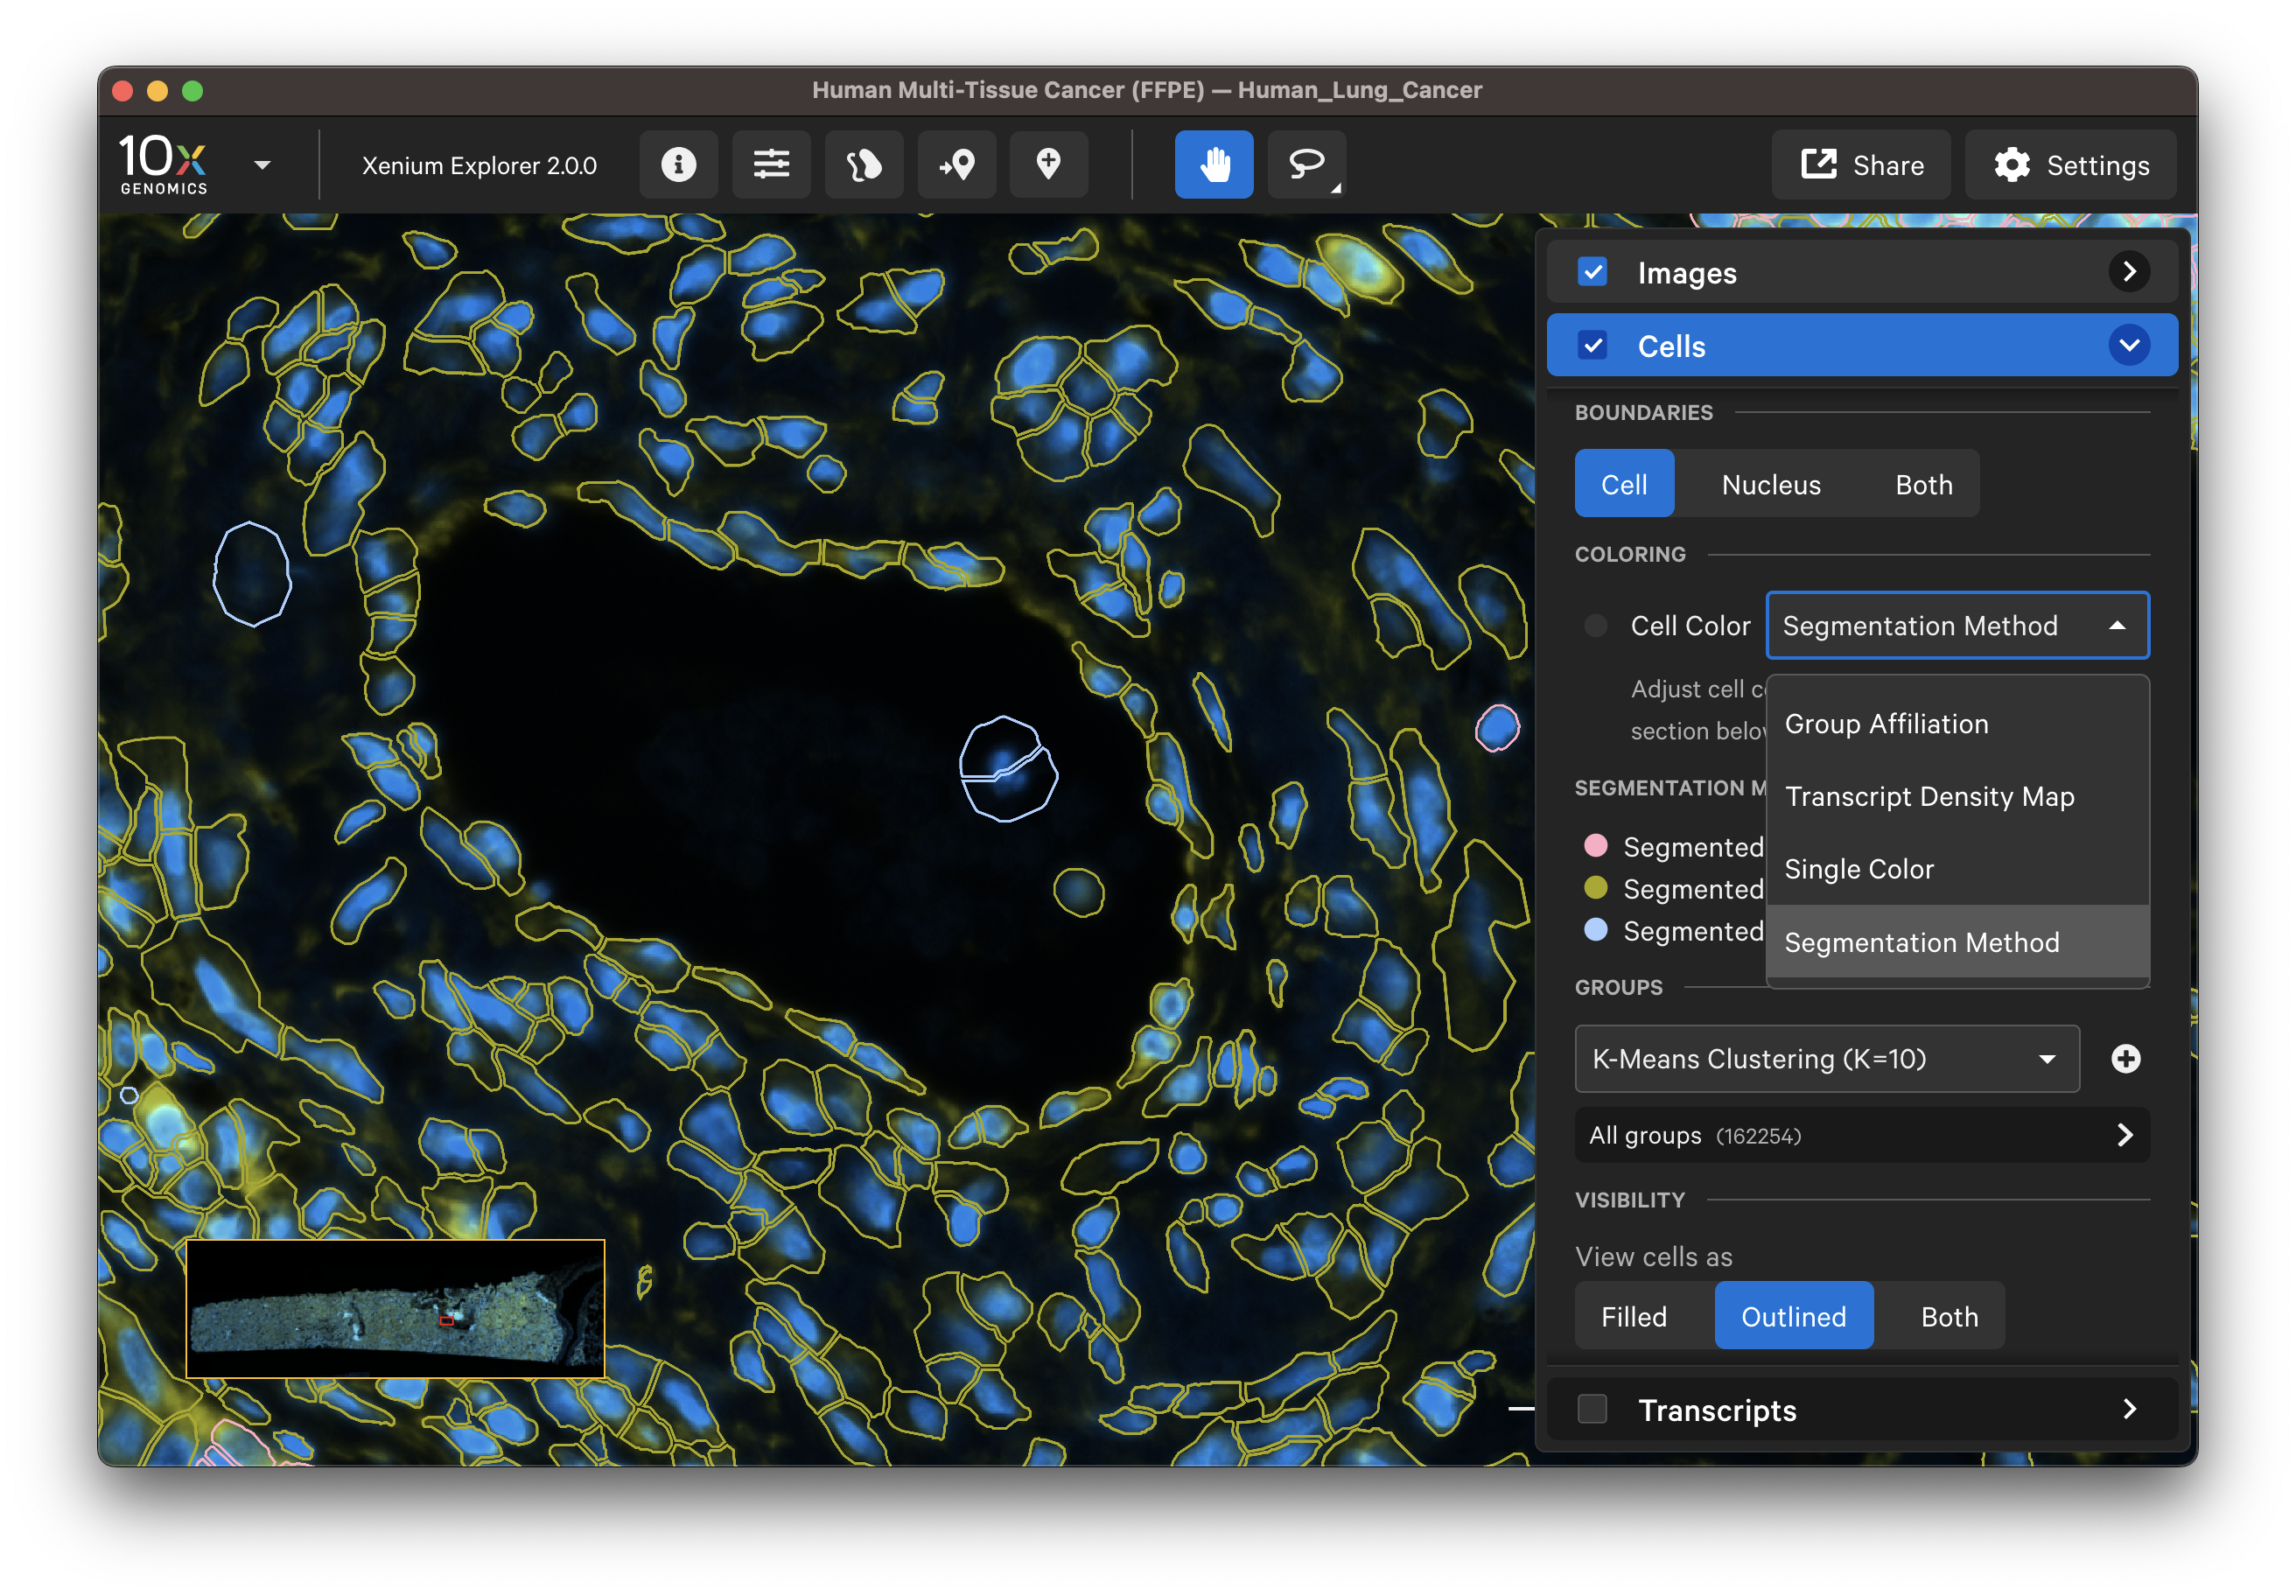
For multimodal cell segmentation datasets, check the Image and Cells layer boxes to compare the cell boundaries with the DAPI, boundary, and interior stain images. Select Segmentation Method from the cell color dropdown in the Cells layer. A legend will be displayed showing the cell fill and/or outline colors that correspond to each method. Adjust the channel intensity threshold and gamma correction as needed to compare the image with the segmentation result boundary. Toggling the Cells display on and off may be helpful.
| Boundary stain | DAPI + Interior - RNA stains |
|---|---|
 |  |
The segmentation method per cell is shown when you click on individual cells in the Selections pop-up window (learn about multimodal cell segmentation algorithms). You can also open the analysis_summary.html in Xenium Explorer under Sample Information to view segmentation method metrics.
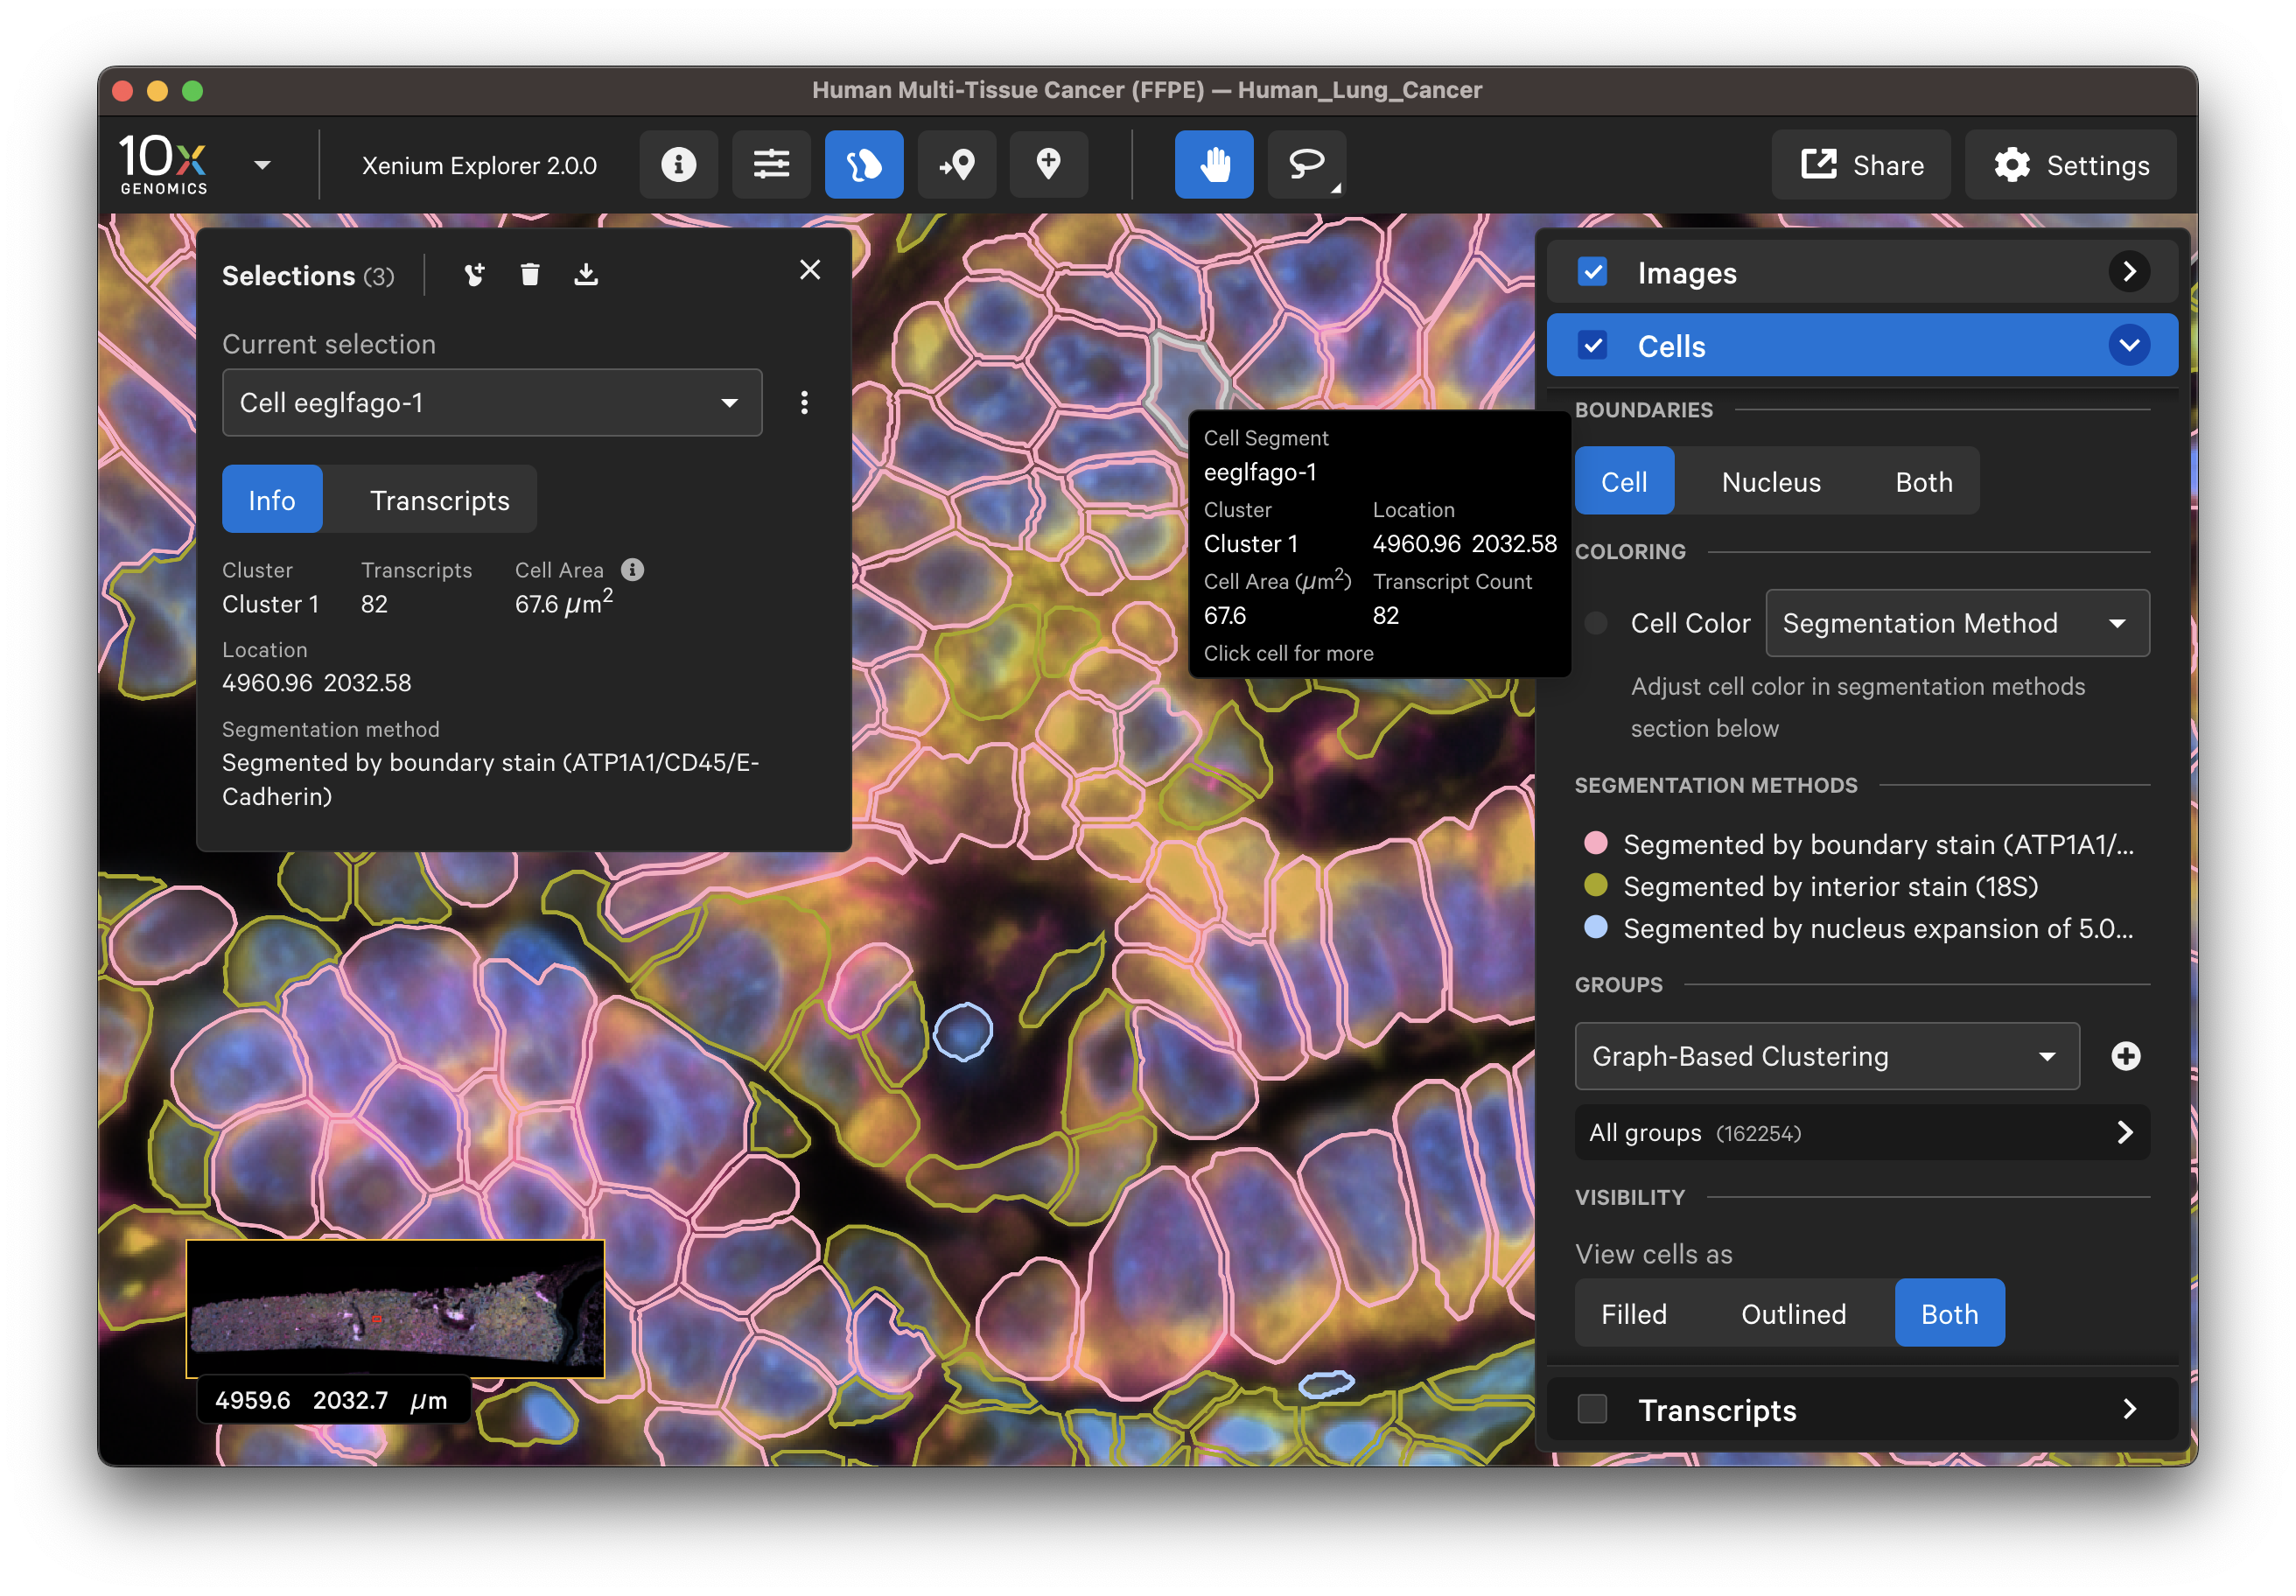
The segmented cell boundaries should correspond to the boundary and interior stains, except in the case of cells segmented via isotropic nuclear expansion. For nuclear expansion, the expansion stops when it encounters another boundary or if it reaches 5 µm (see segmentation algorithms for details).
- Do the boundary segmented cells correspond well with the boundary stain image?
- Do the interior segmented cells correspond well with the interior - RNA stain image? Interior-based segmentation requires a defined nucleus. The algorithm only considers interior stained regions with nuclei.
- For cells segmented by nuclear expansion, how do the stains look? How do the 3D DAPI Z-slices look? There should be very few nuclear expansion-based segmented cells with the Cell Segmentation Staining workflow.
Select different cell types to spot-check cell segmentation quality. For example, use the results from default graph-based and K-Means clustering or custom groups to identify different cell types. Particular cell types may segment better with certain methods than others since the Multi-Tissue Stain Mix targets biological features. If available, H&E morphology features should correspond to DAPI and multi-tissue stain image features. For example, here is a region of the human lung data with blood vessel (red blood cells in the center) fibroblast and muscle cells:
| K-Means=10 | Post-Xenium H&E |
|---|---|
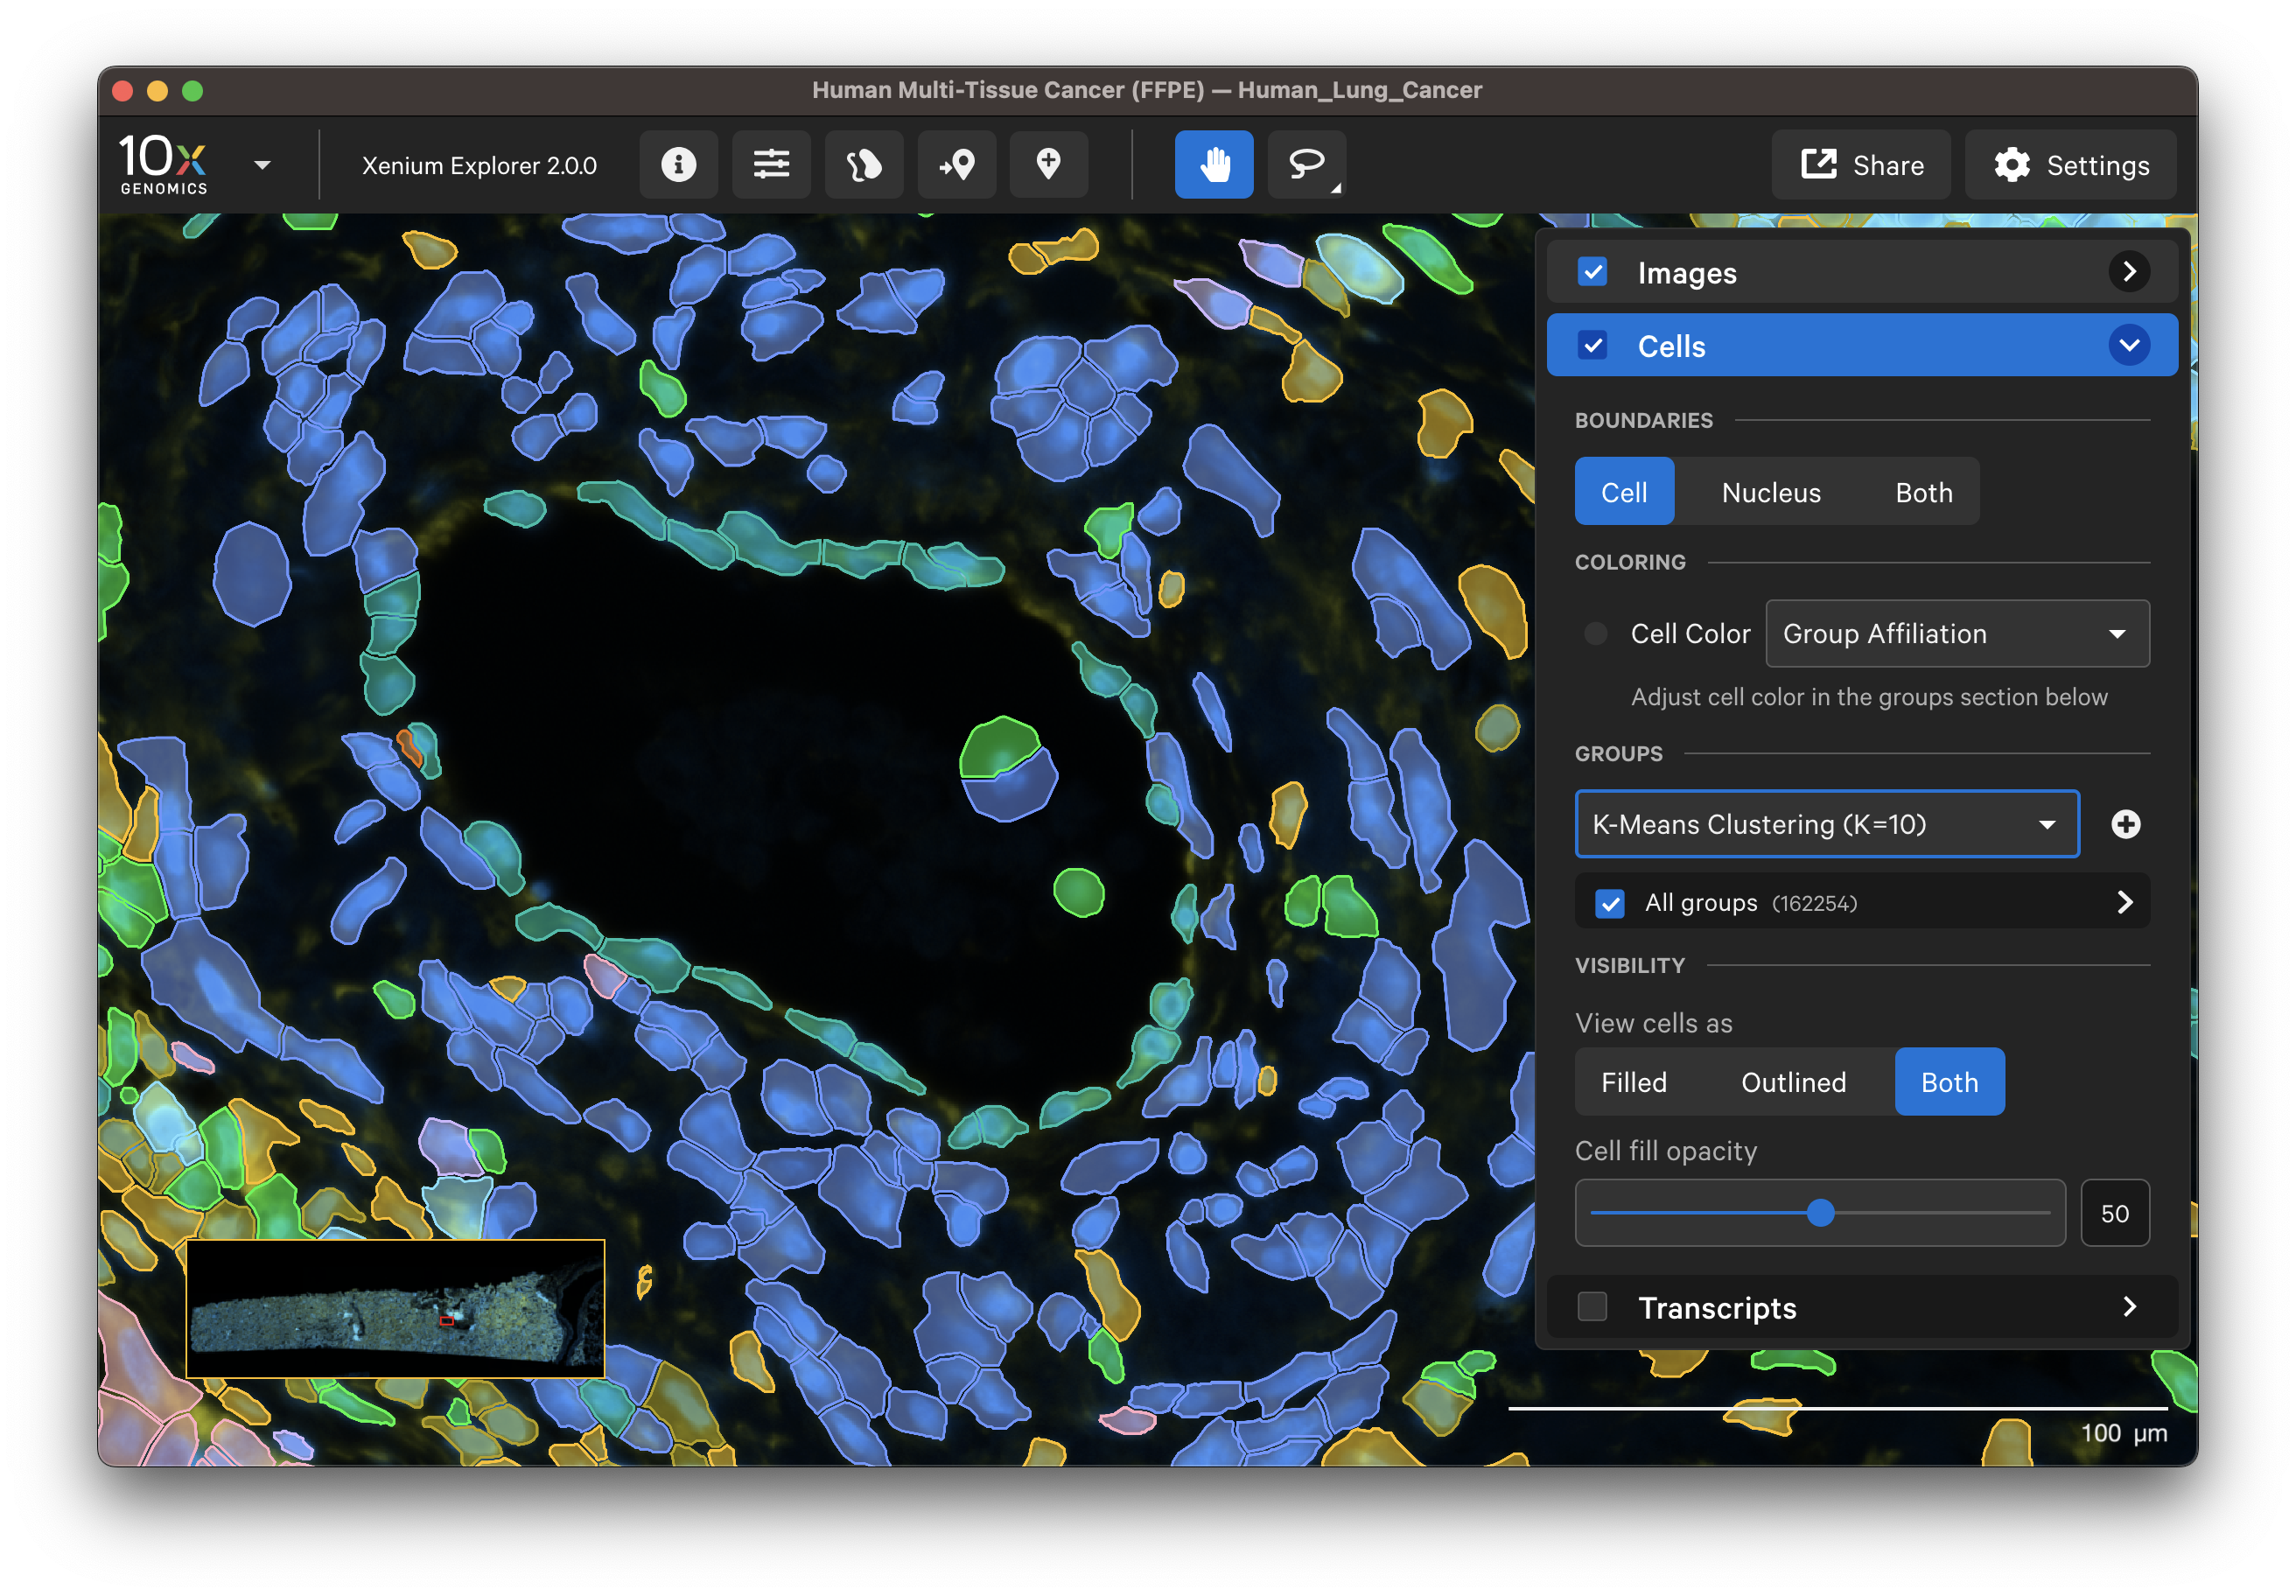 | 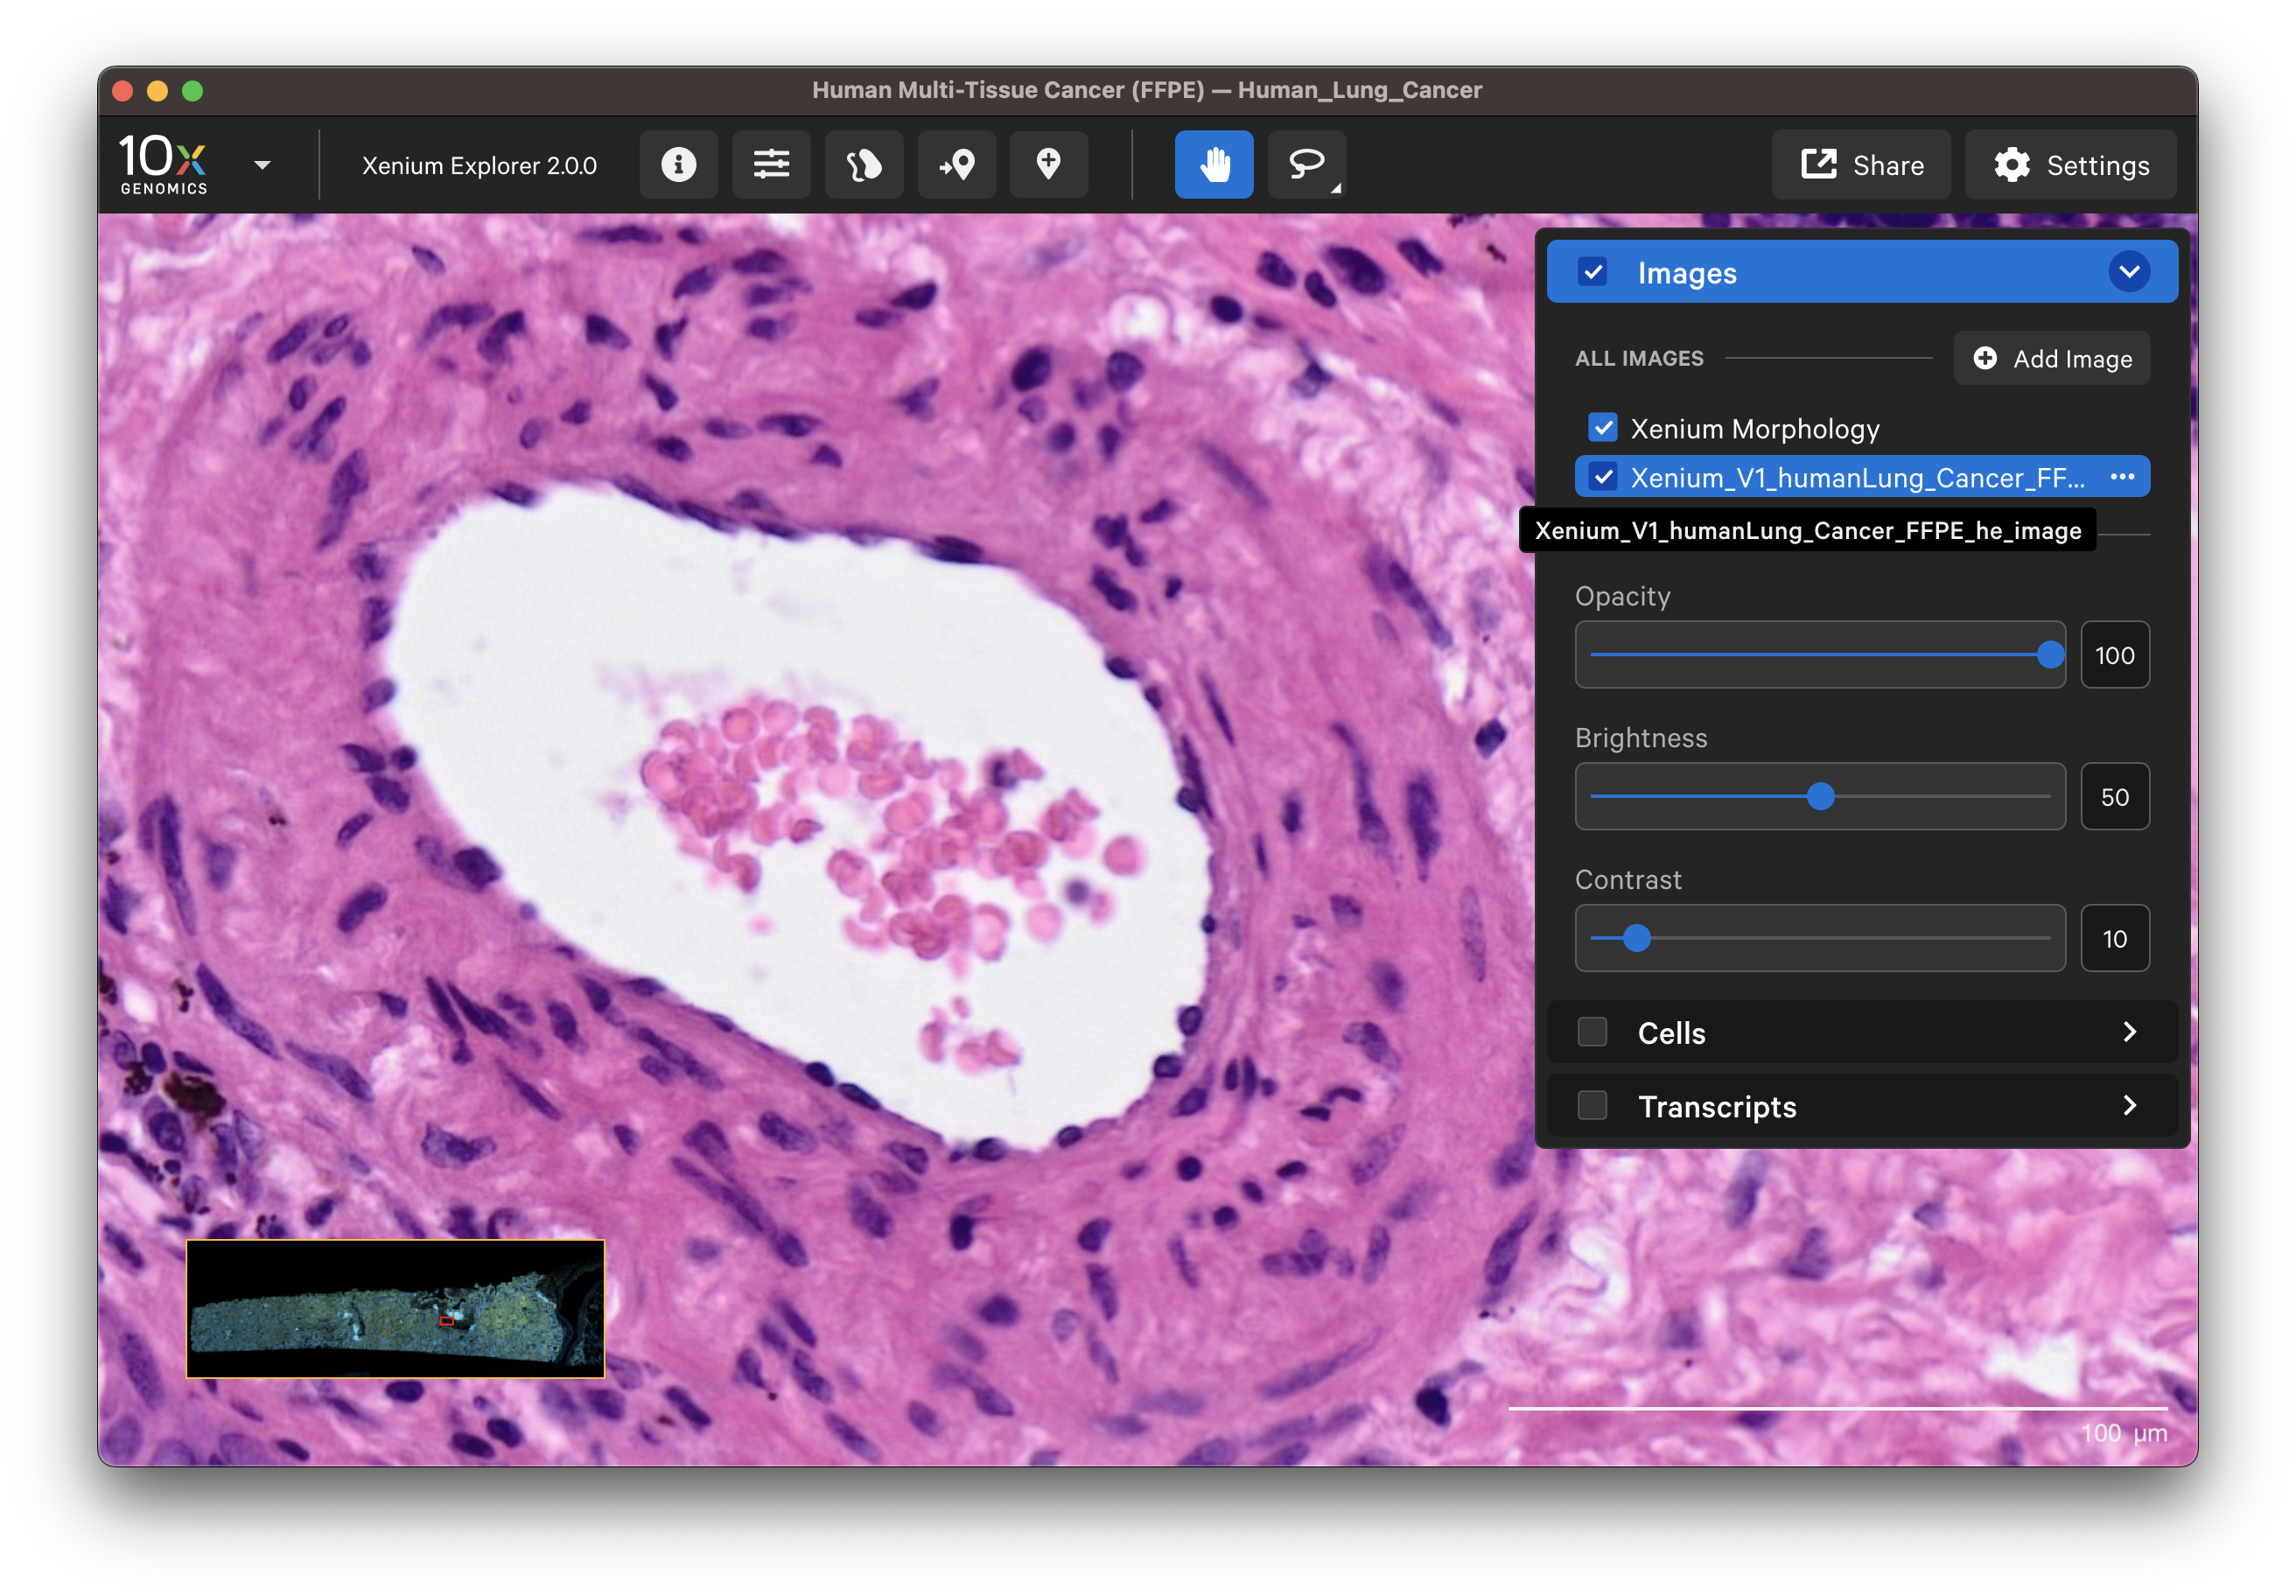 |
In this example, the fibroblast cells are predominantly segmented via the interior stain method:
For single channel (DAPI-only) datasets, cells are defined by isotropic expansion of the nucleus boundary. Examine these results by checking the Cells layer and visualizing the cell fill and/or outlines with a single color, such as white cell boundaries and red nucleus boundaries.
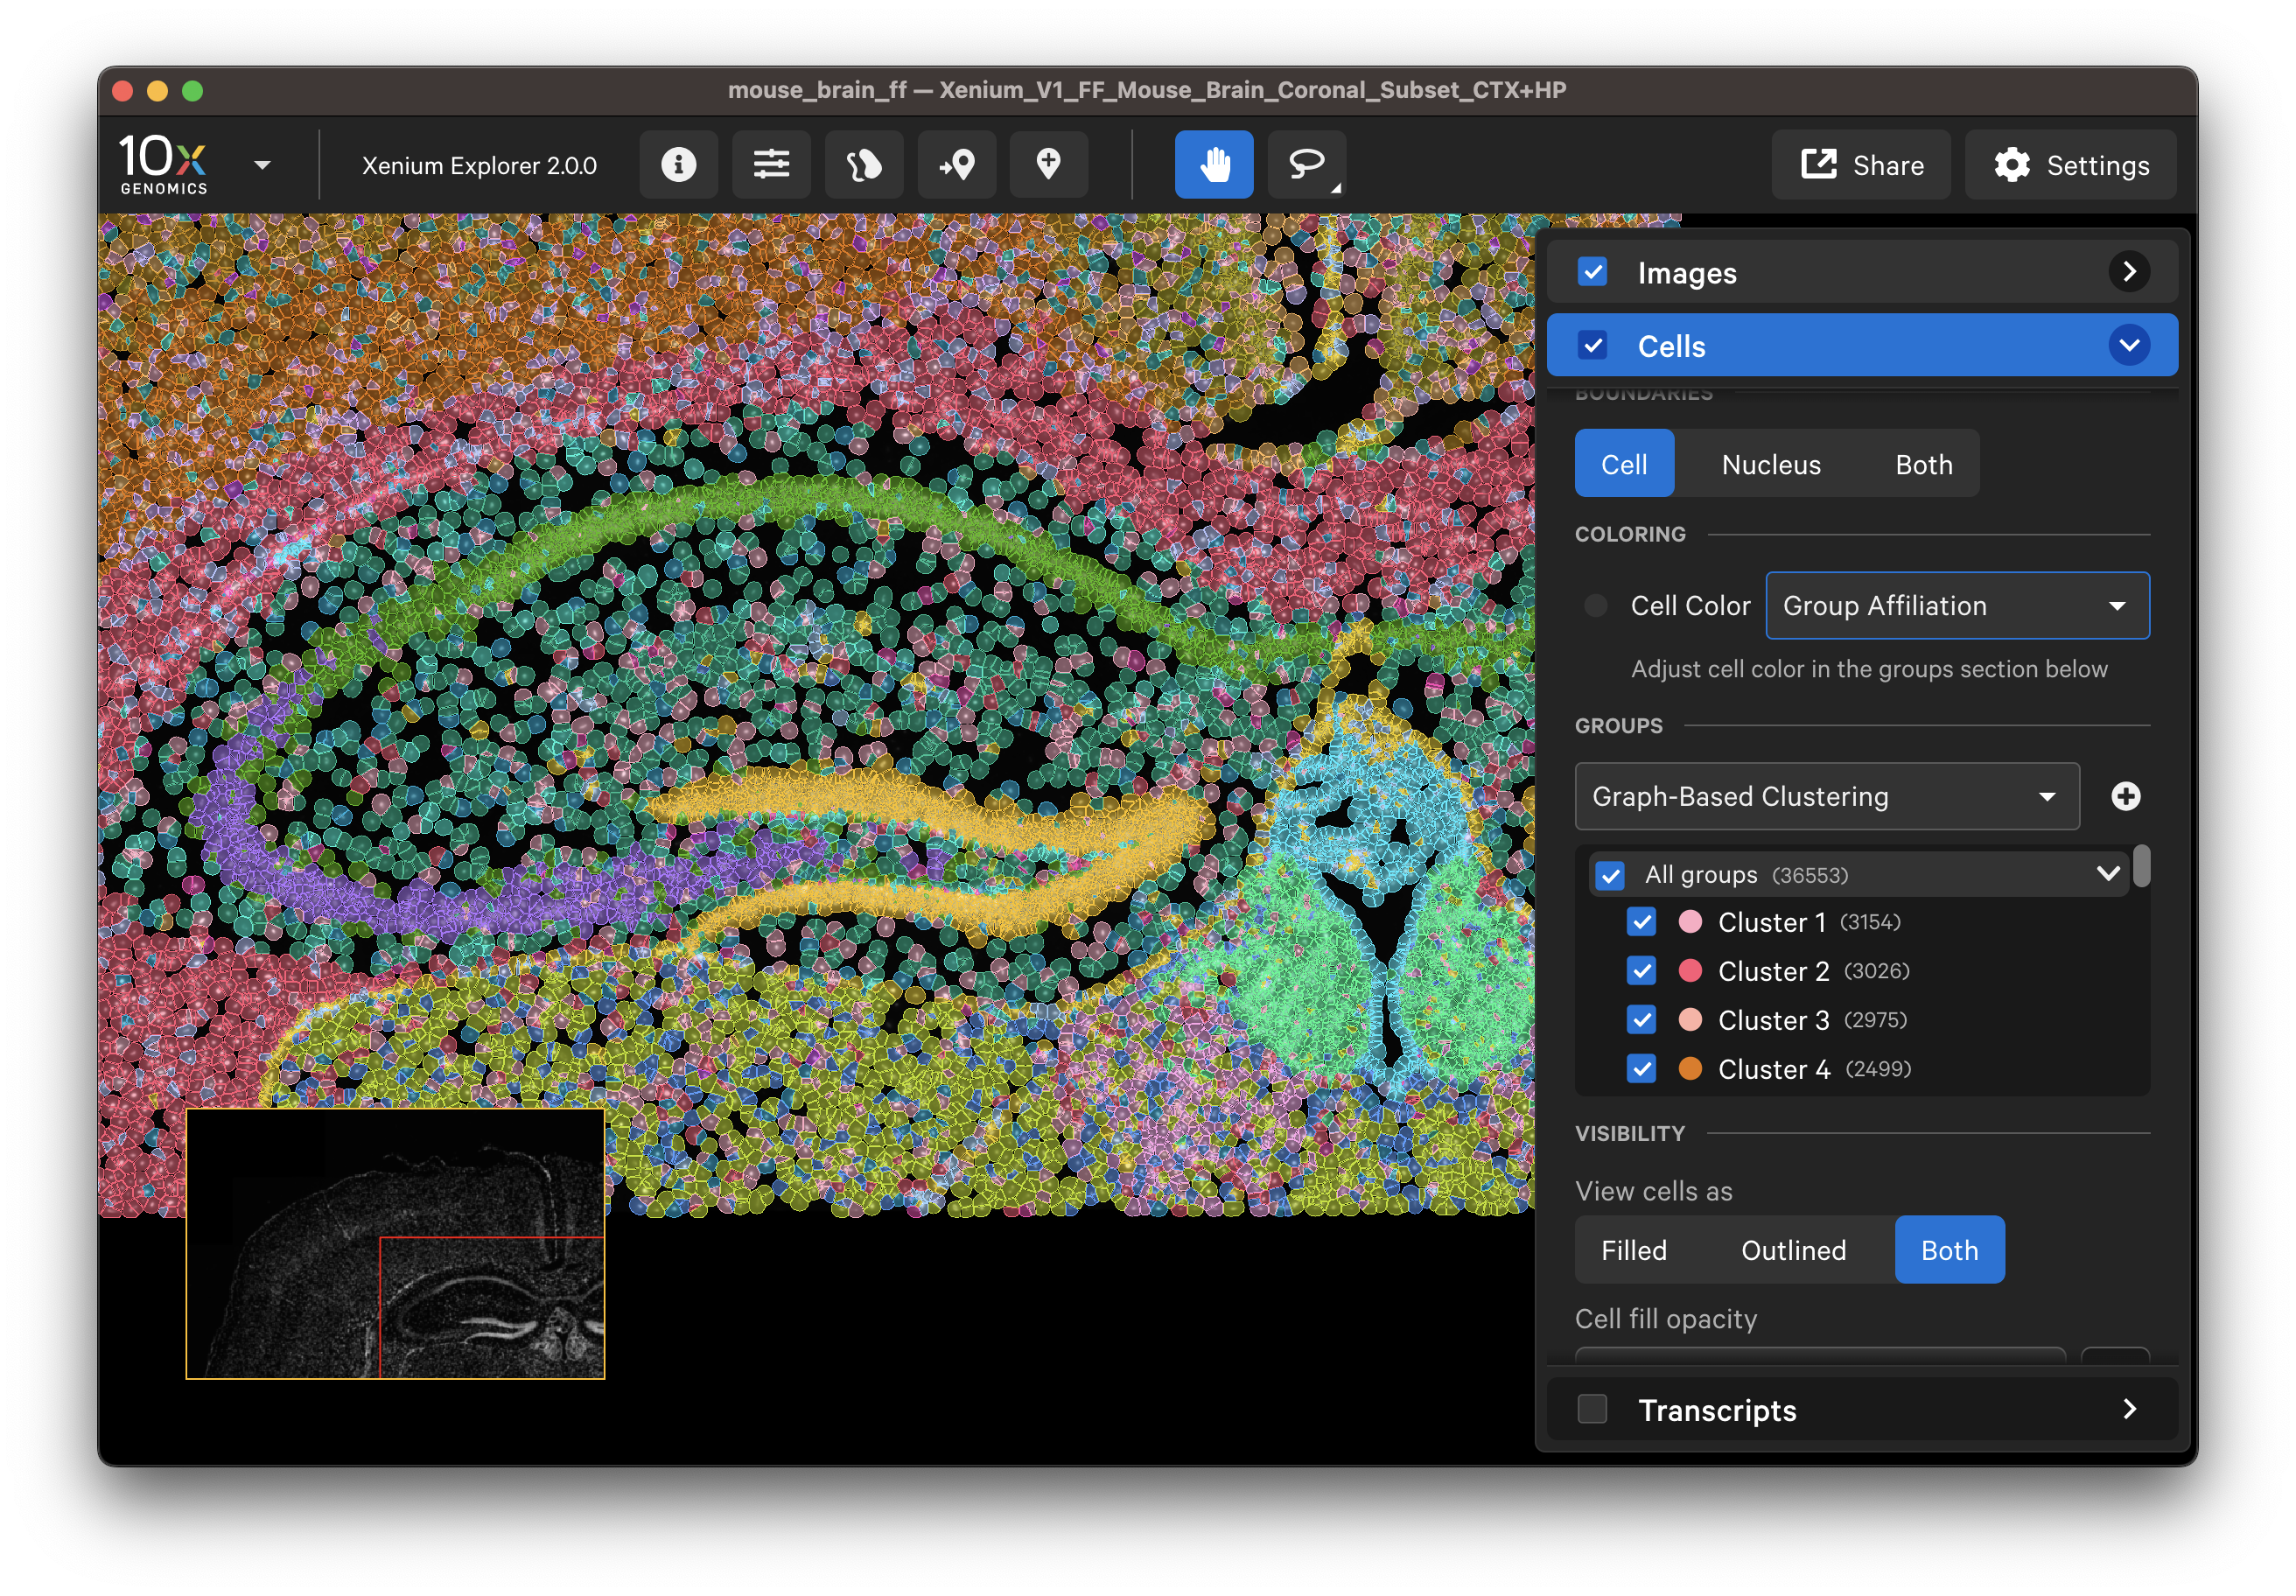
Examine cells colored by cluster affiliation to check whether clusters align with knowledge of the tissue type/state. Click on cells to check whether selected marker genes in cells match biological expectations.
Here are some ways to validate the accuracy of your transcript data with genes that have known spatial or cell localization patterns:
- Select cell type marker genes and assess them using per-gene localization plots (Q-Score ≥ 20).
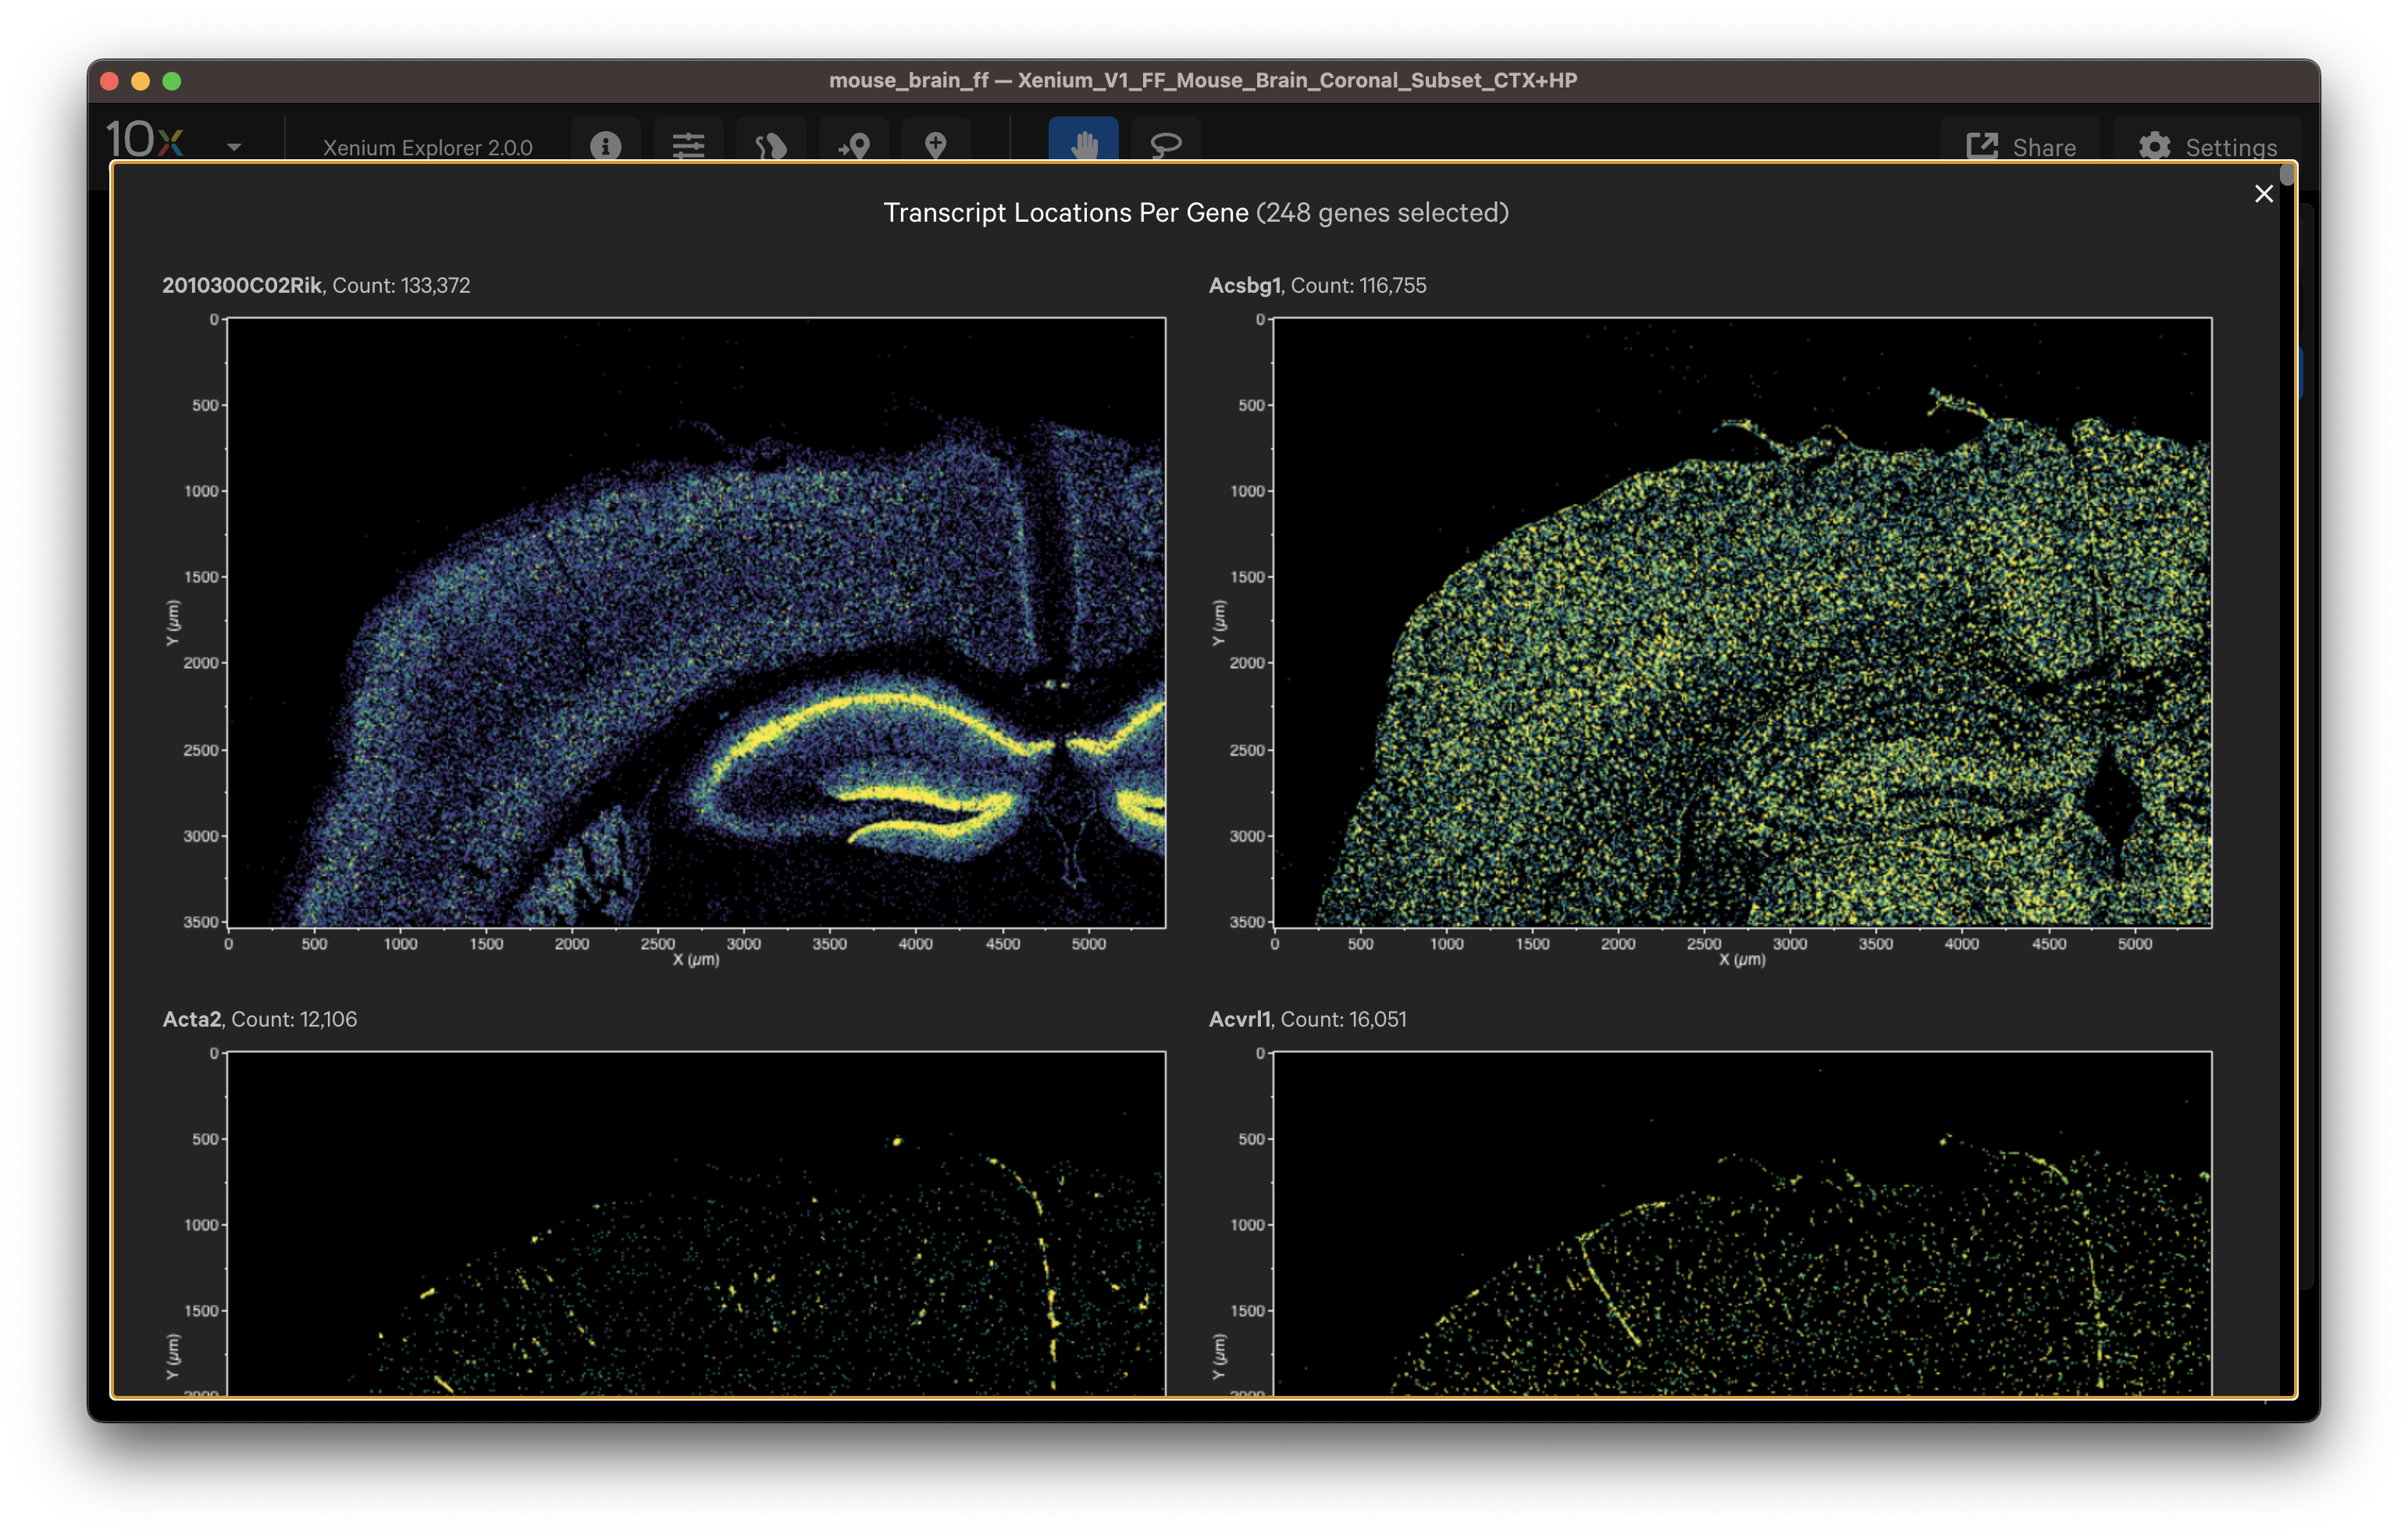
- Select a group of marker genes for a given cell type and view as different colored points to visualize separation between cells (i.e., to identify cell subtypes).
- View gene transcript patterns individually in the viewing area.
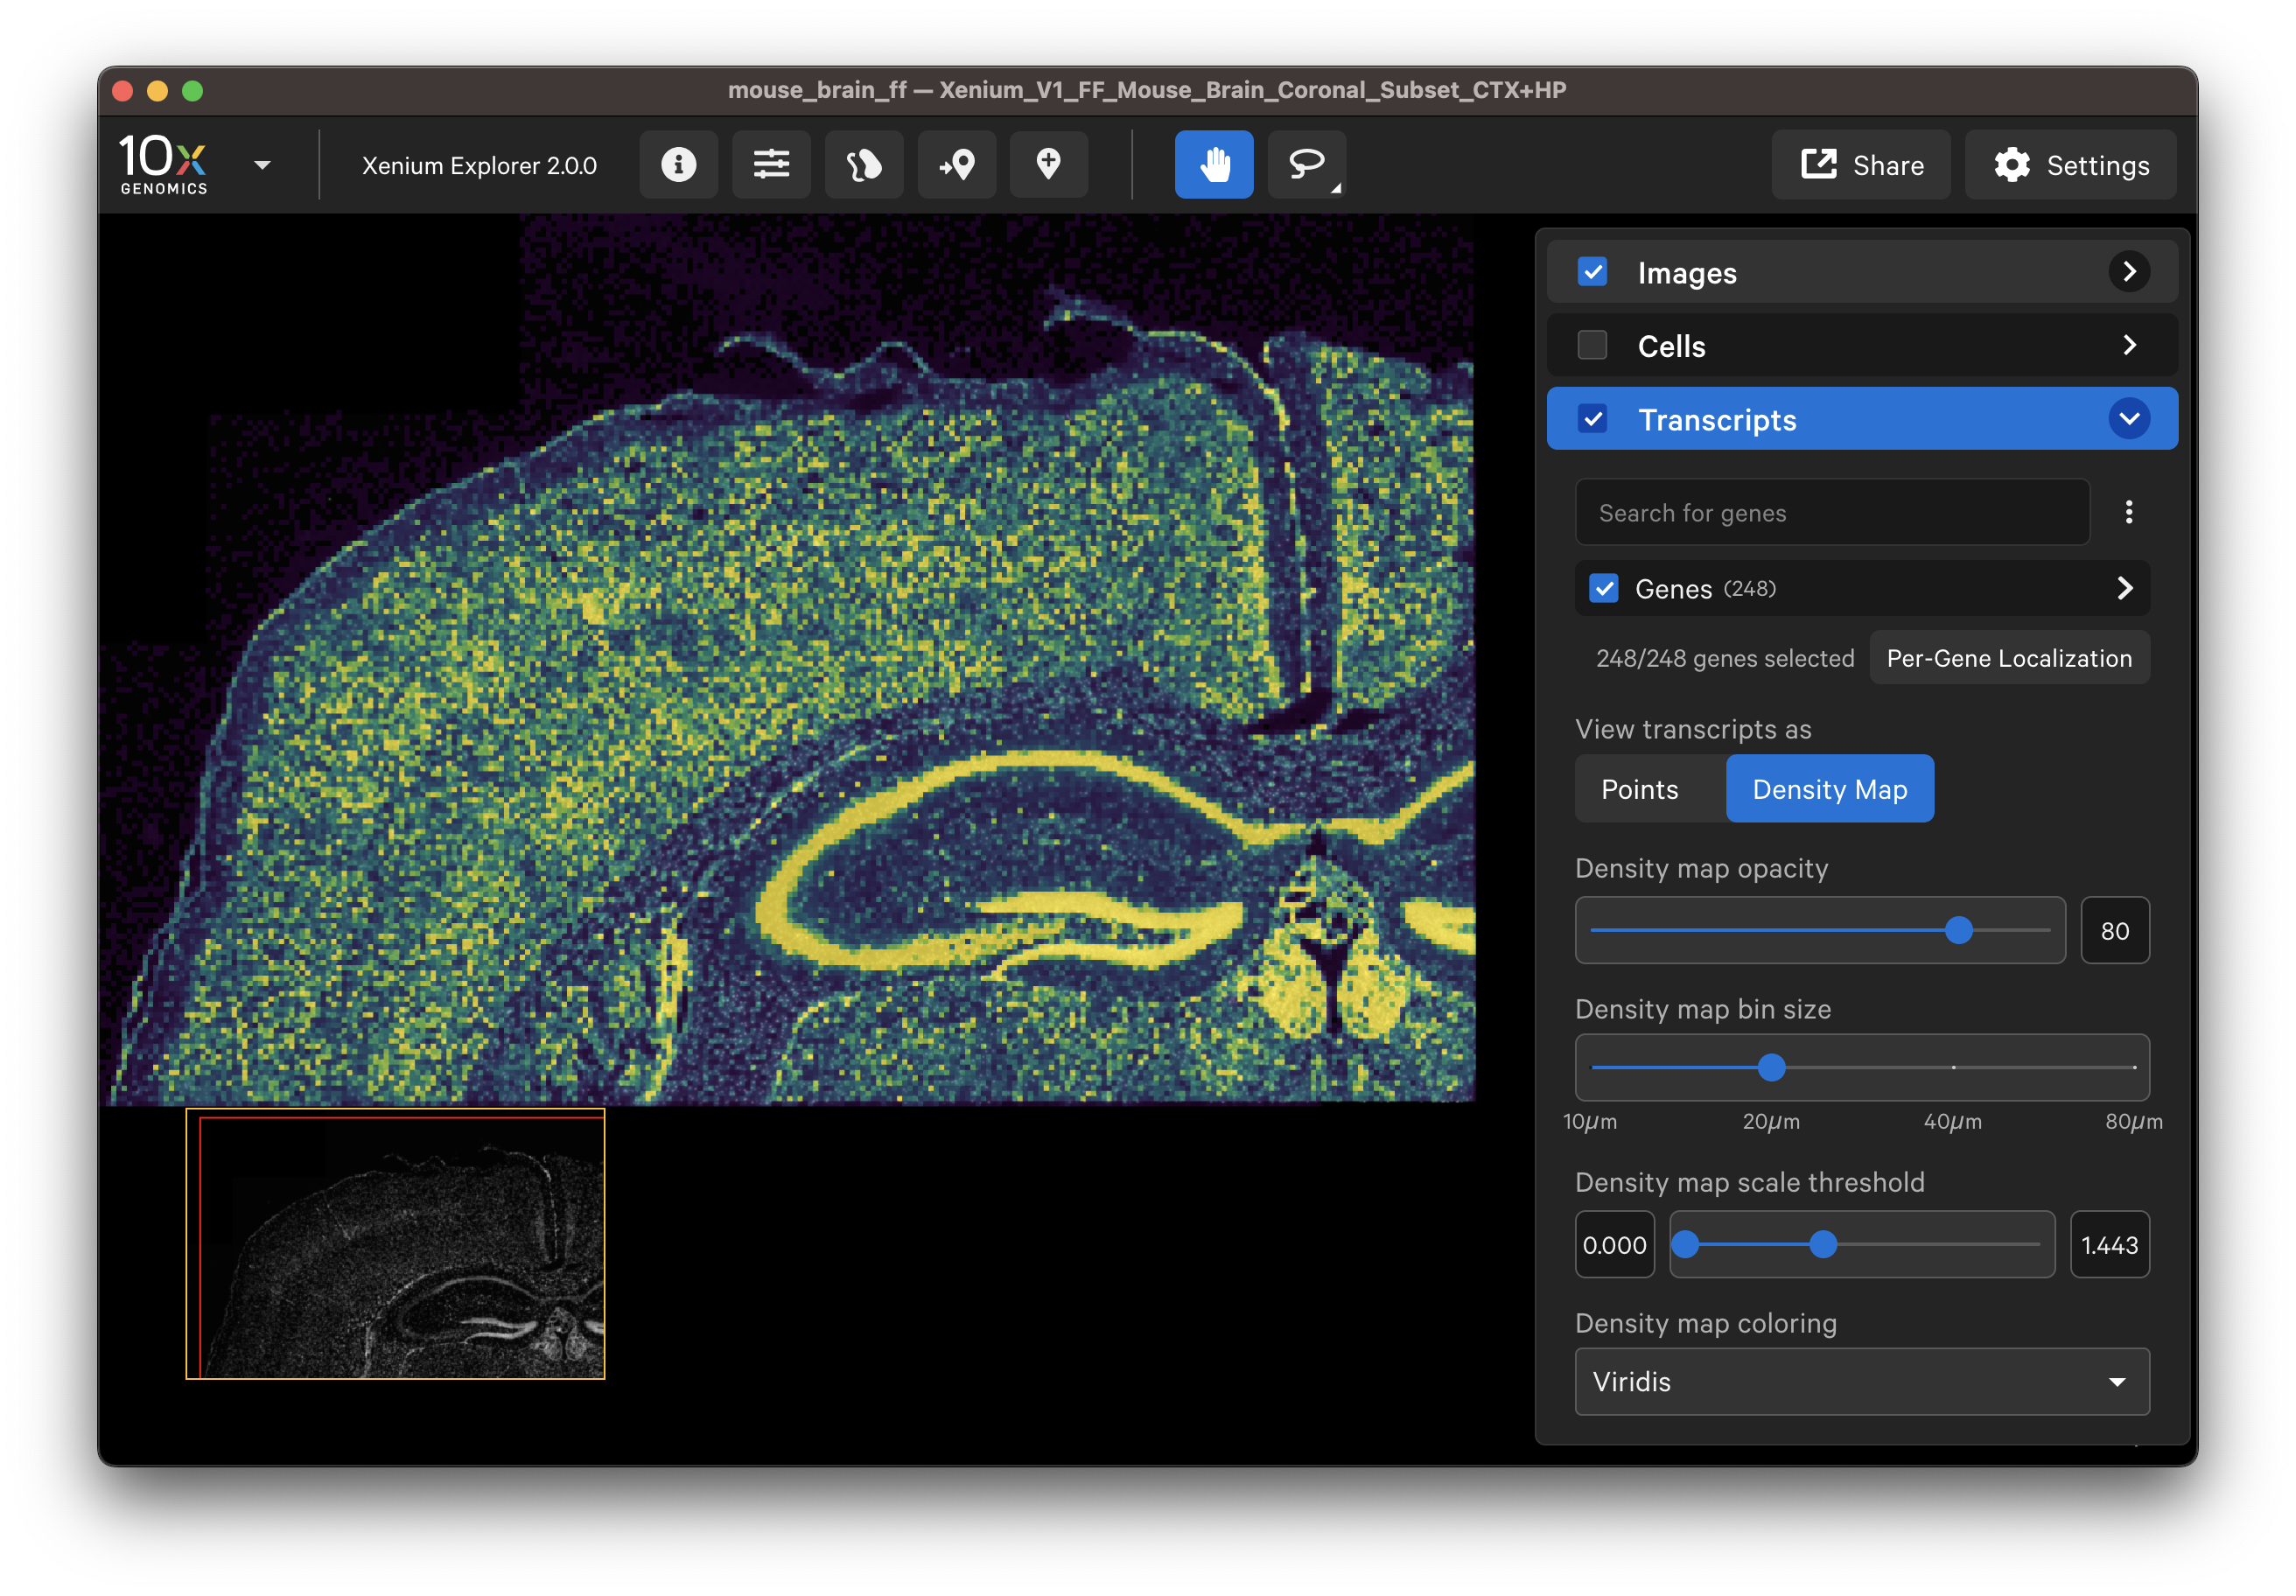
- View all gene transcripts as a density map across the entire sample to ensure uniform result.
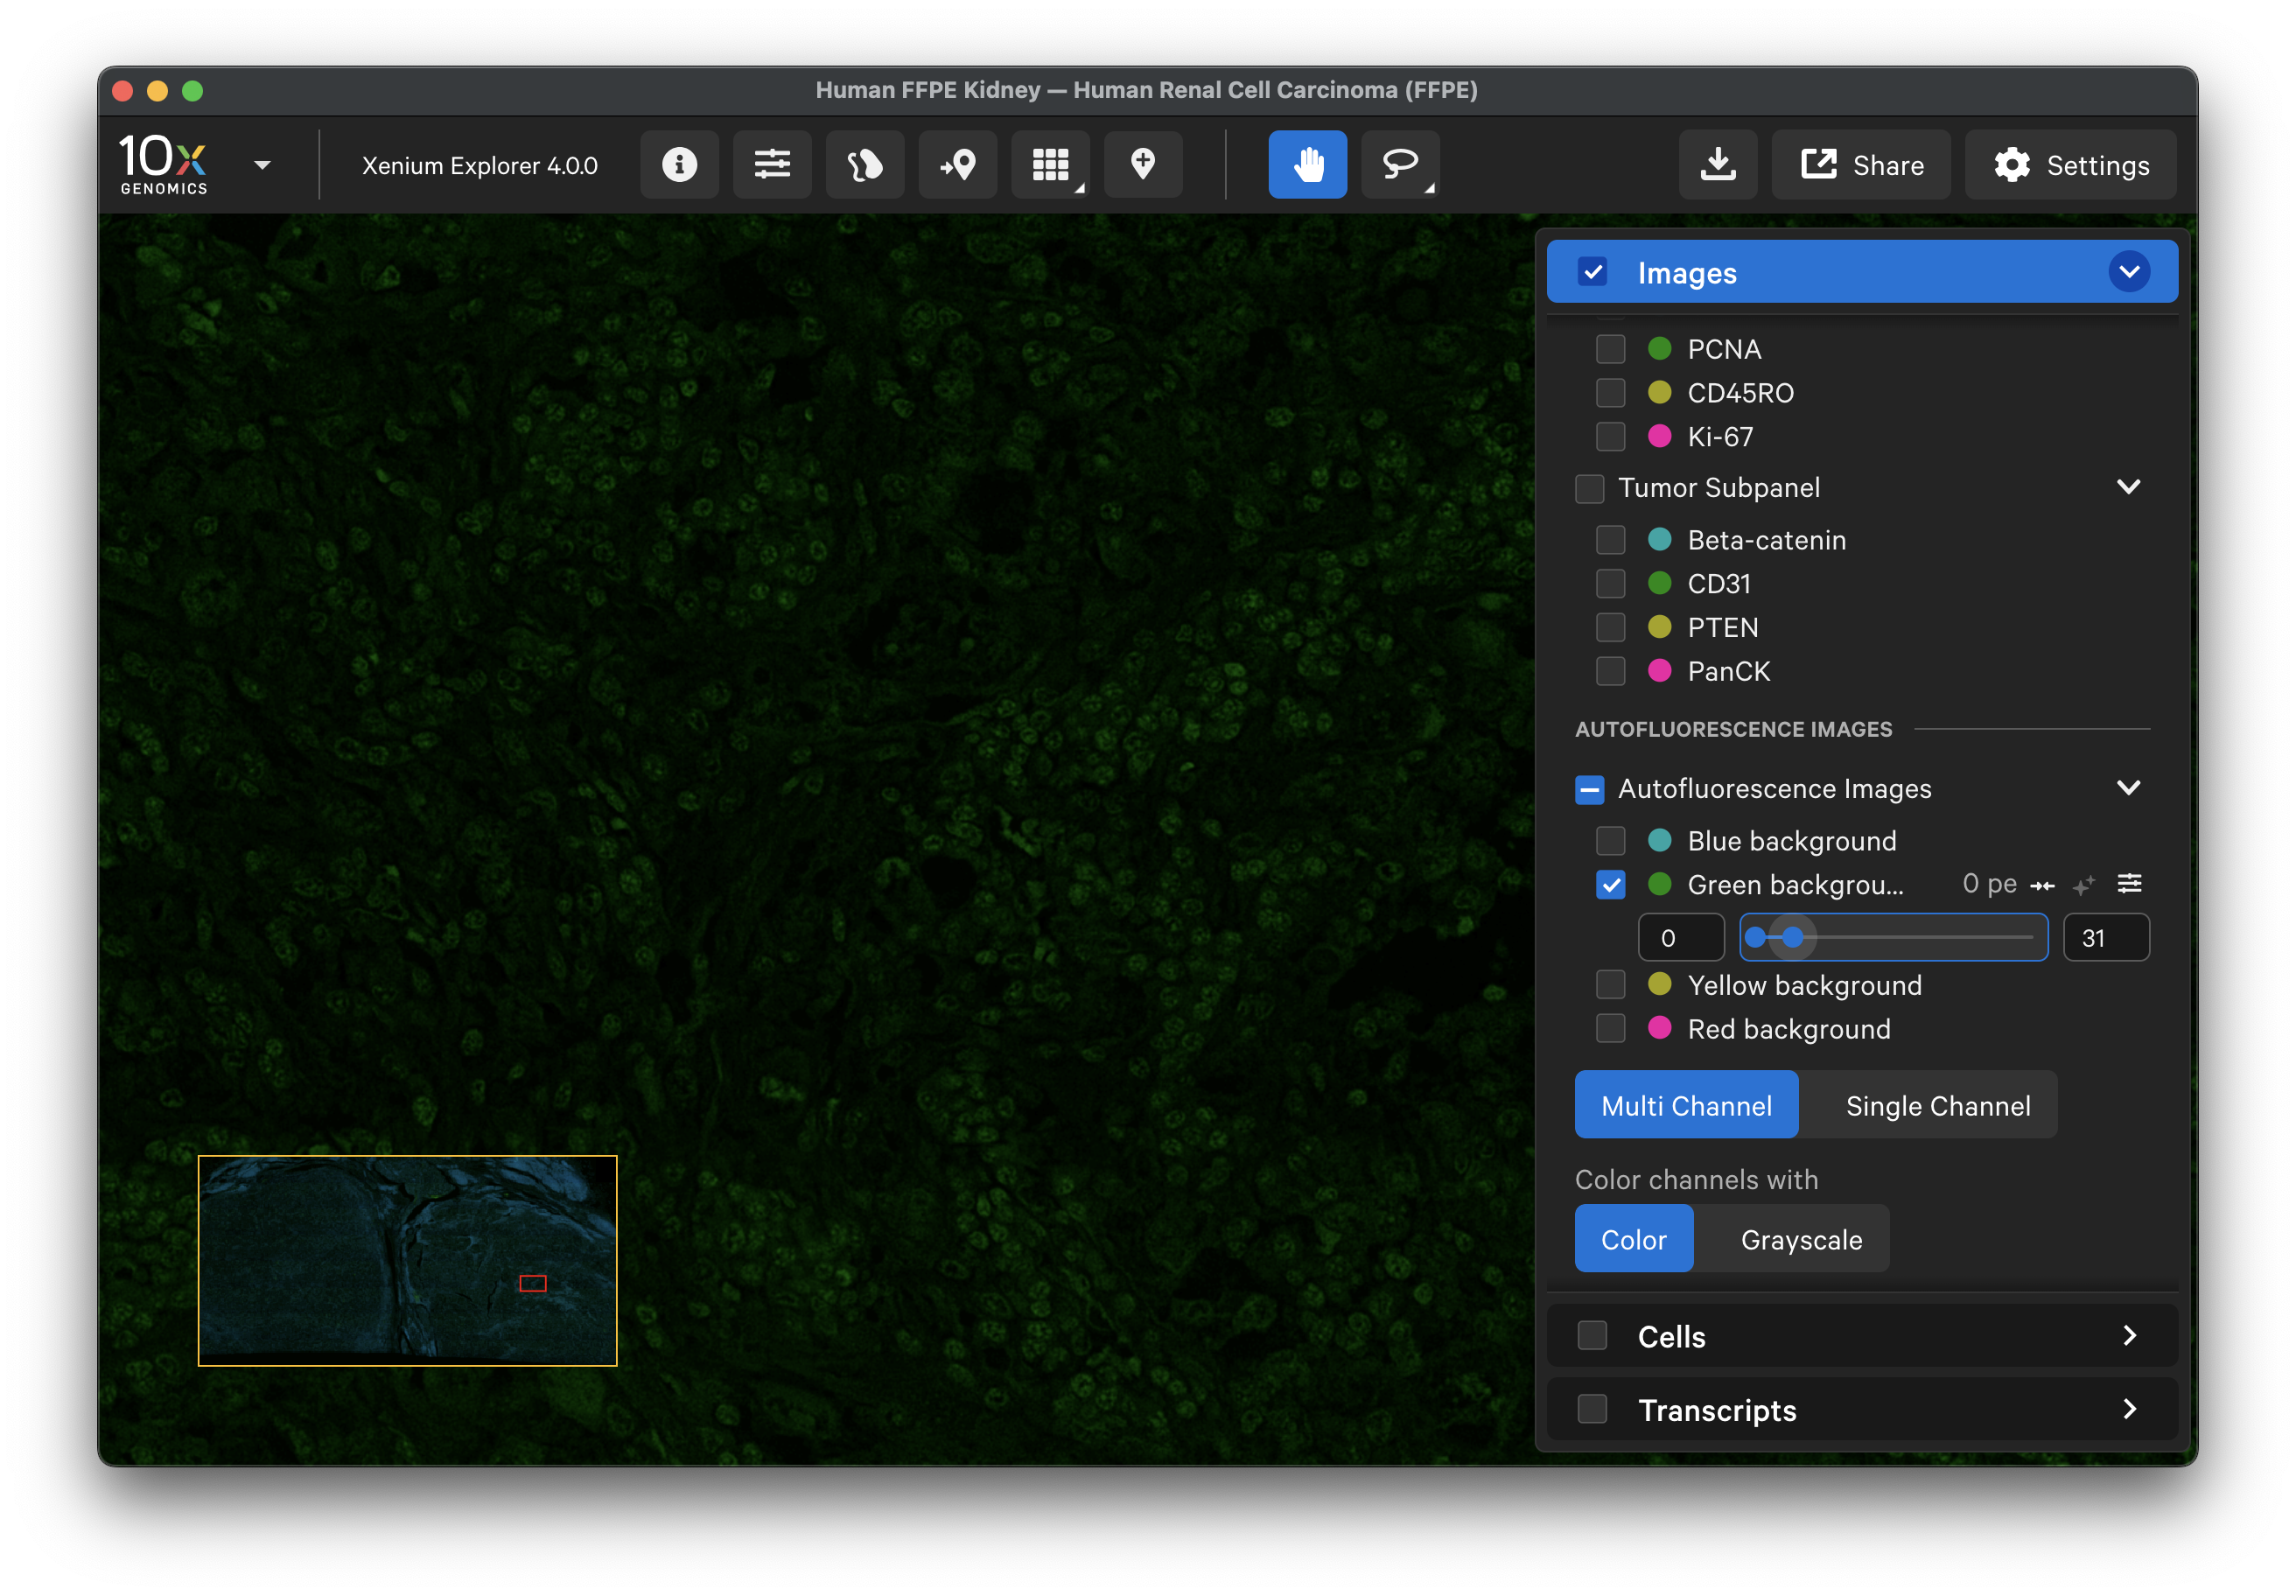
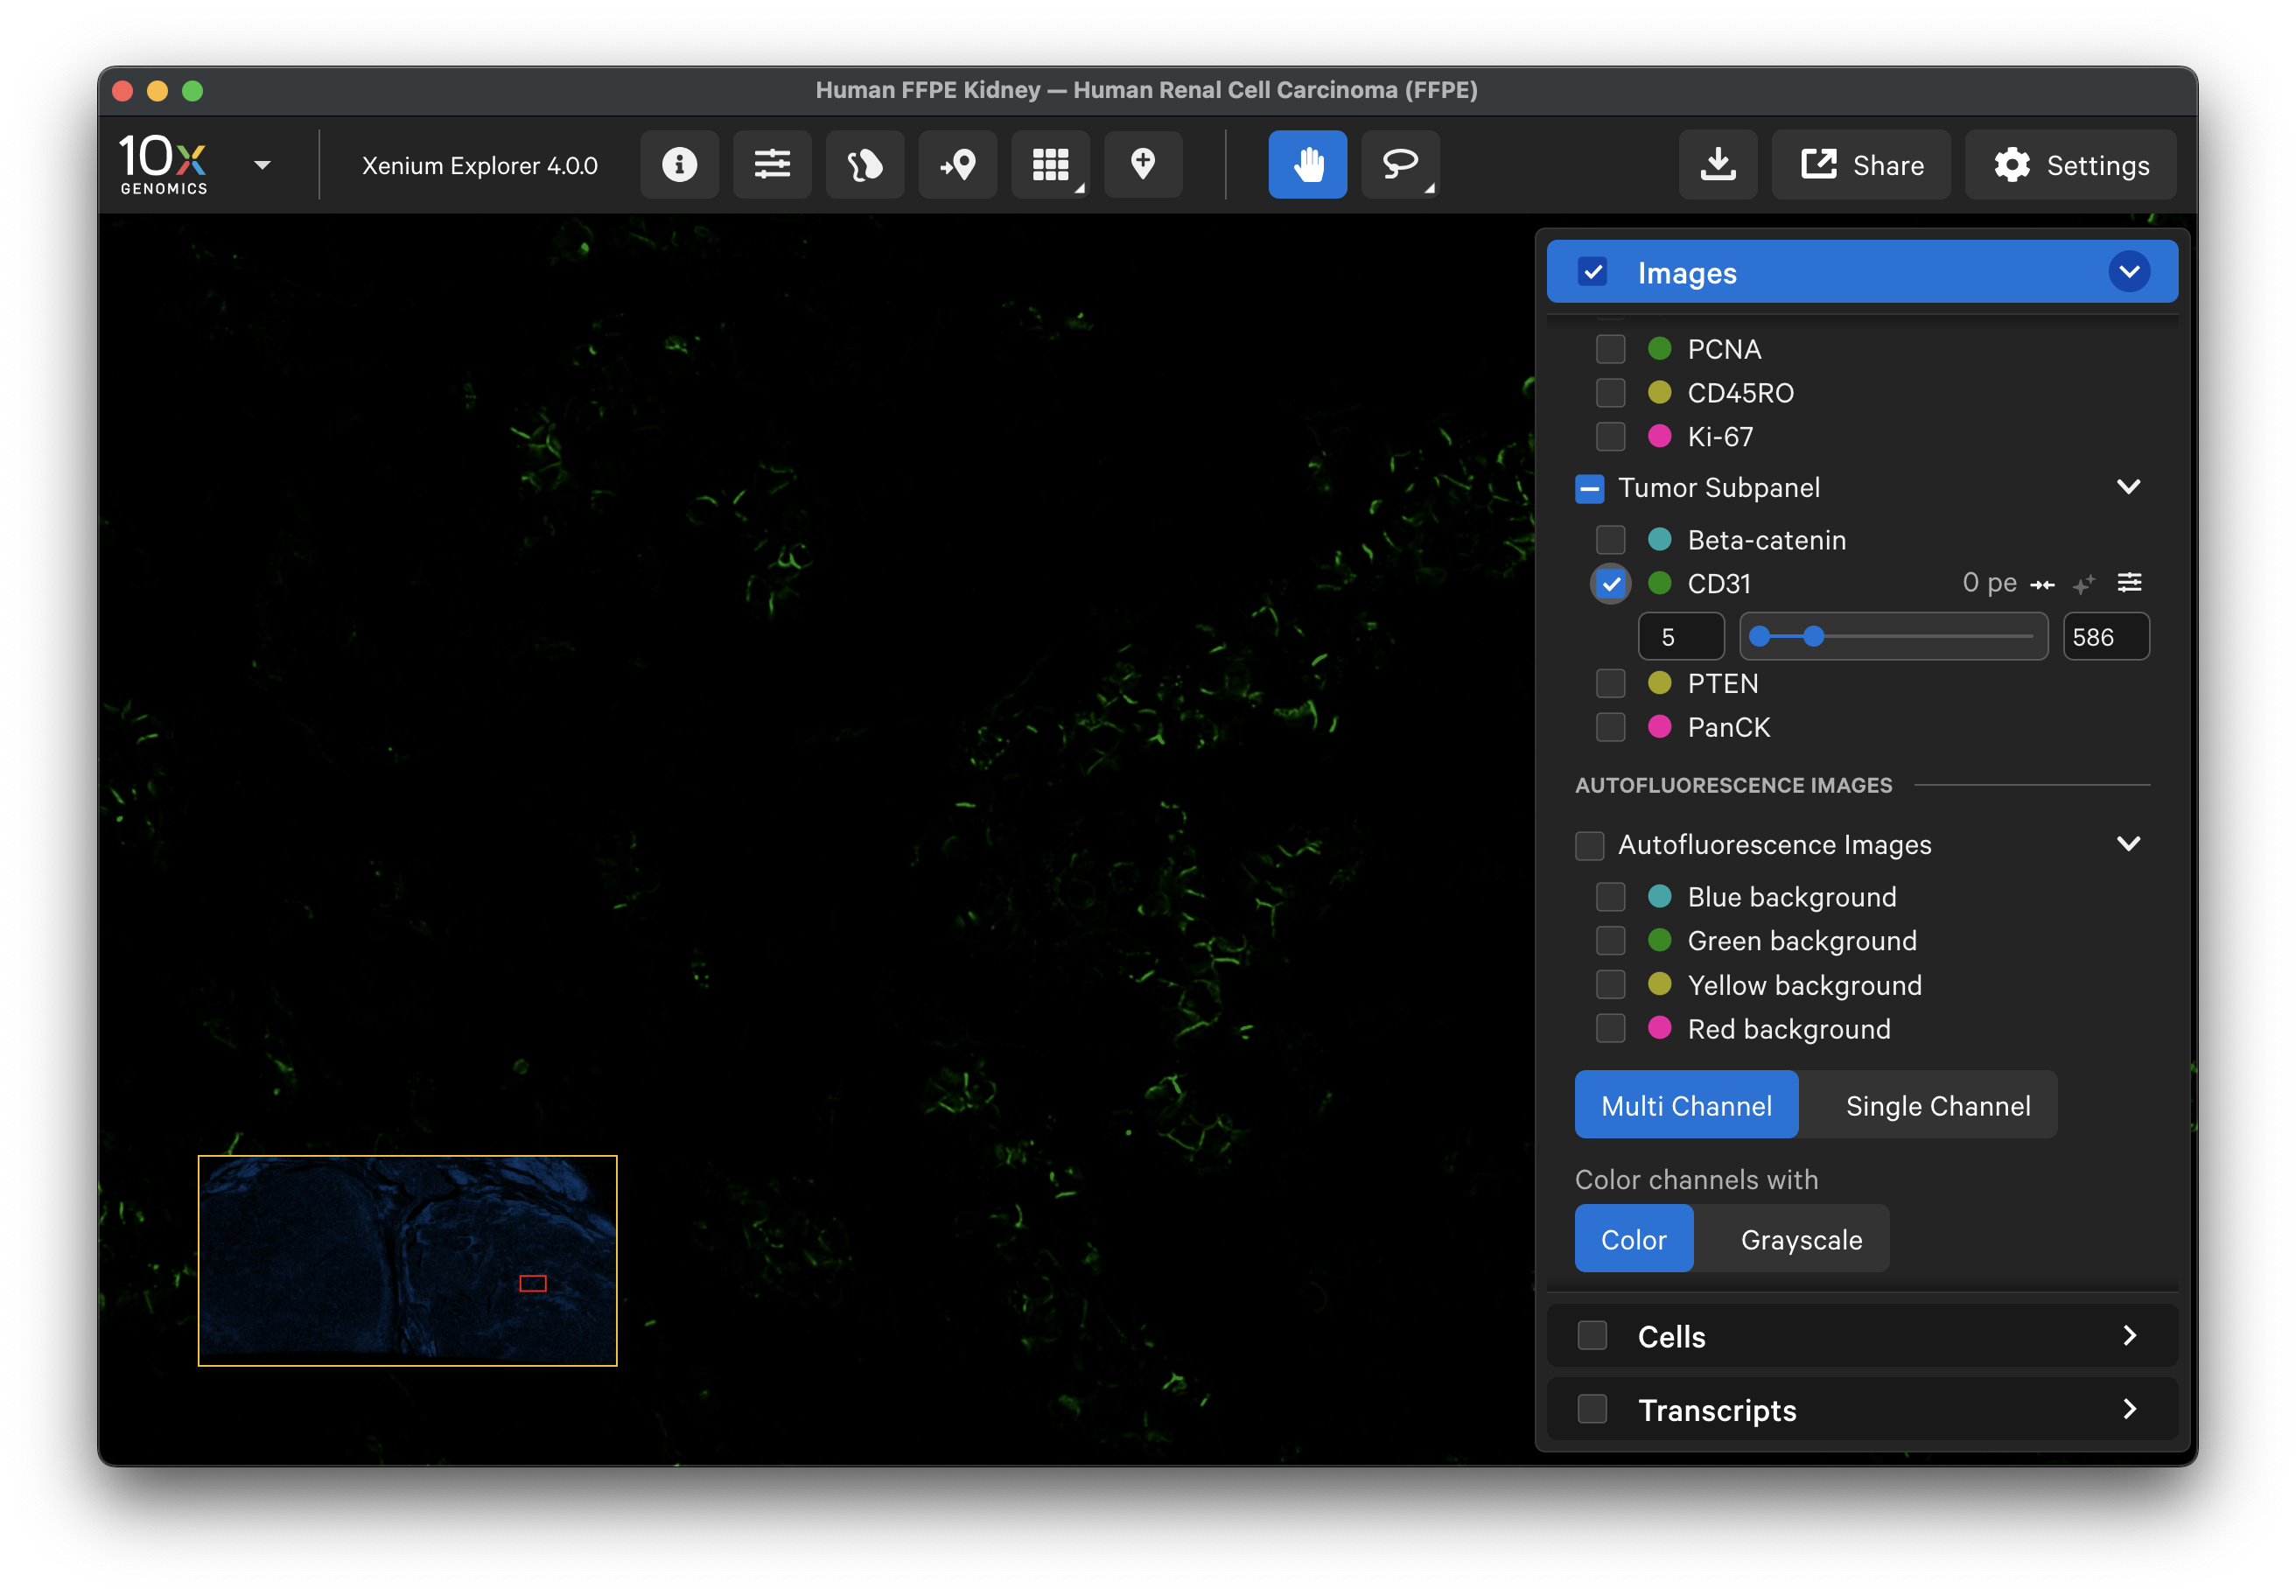
For data generated with the Xenium Gene and Protein Expression with Cell Segmentation Staining workflow, inspect protein marker images for expected morphological features and cell types based on the sample's protein subpanel(s), tissue type, and disease state.
The 1st cycle background images are provided in the Autofluorescence Images section. The stain signal in these images was used for background subtraction in the protein and cell segmentation images. Protein markers are grouped by protein subpanel, and each protein within a subpanel is sorted by wavelength. Background images are sorted by wavelength. Overlay a protein channel image with its corresponding autofluorescence channel image to help visualize the signal that was subtracted.
-
For example, here is the background image for the green channel:
-
Here is the data for CD31, which is imaged in the green channel. By comparing the two, you can qualitatively assess the background signal that was subtracted:
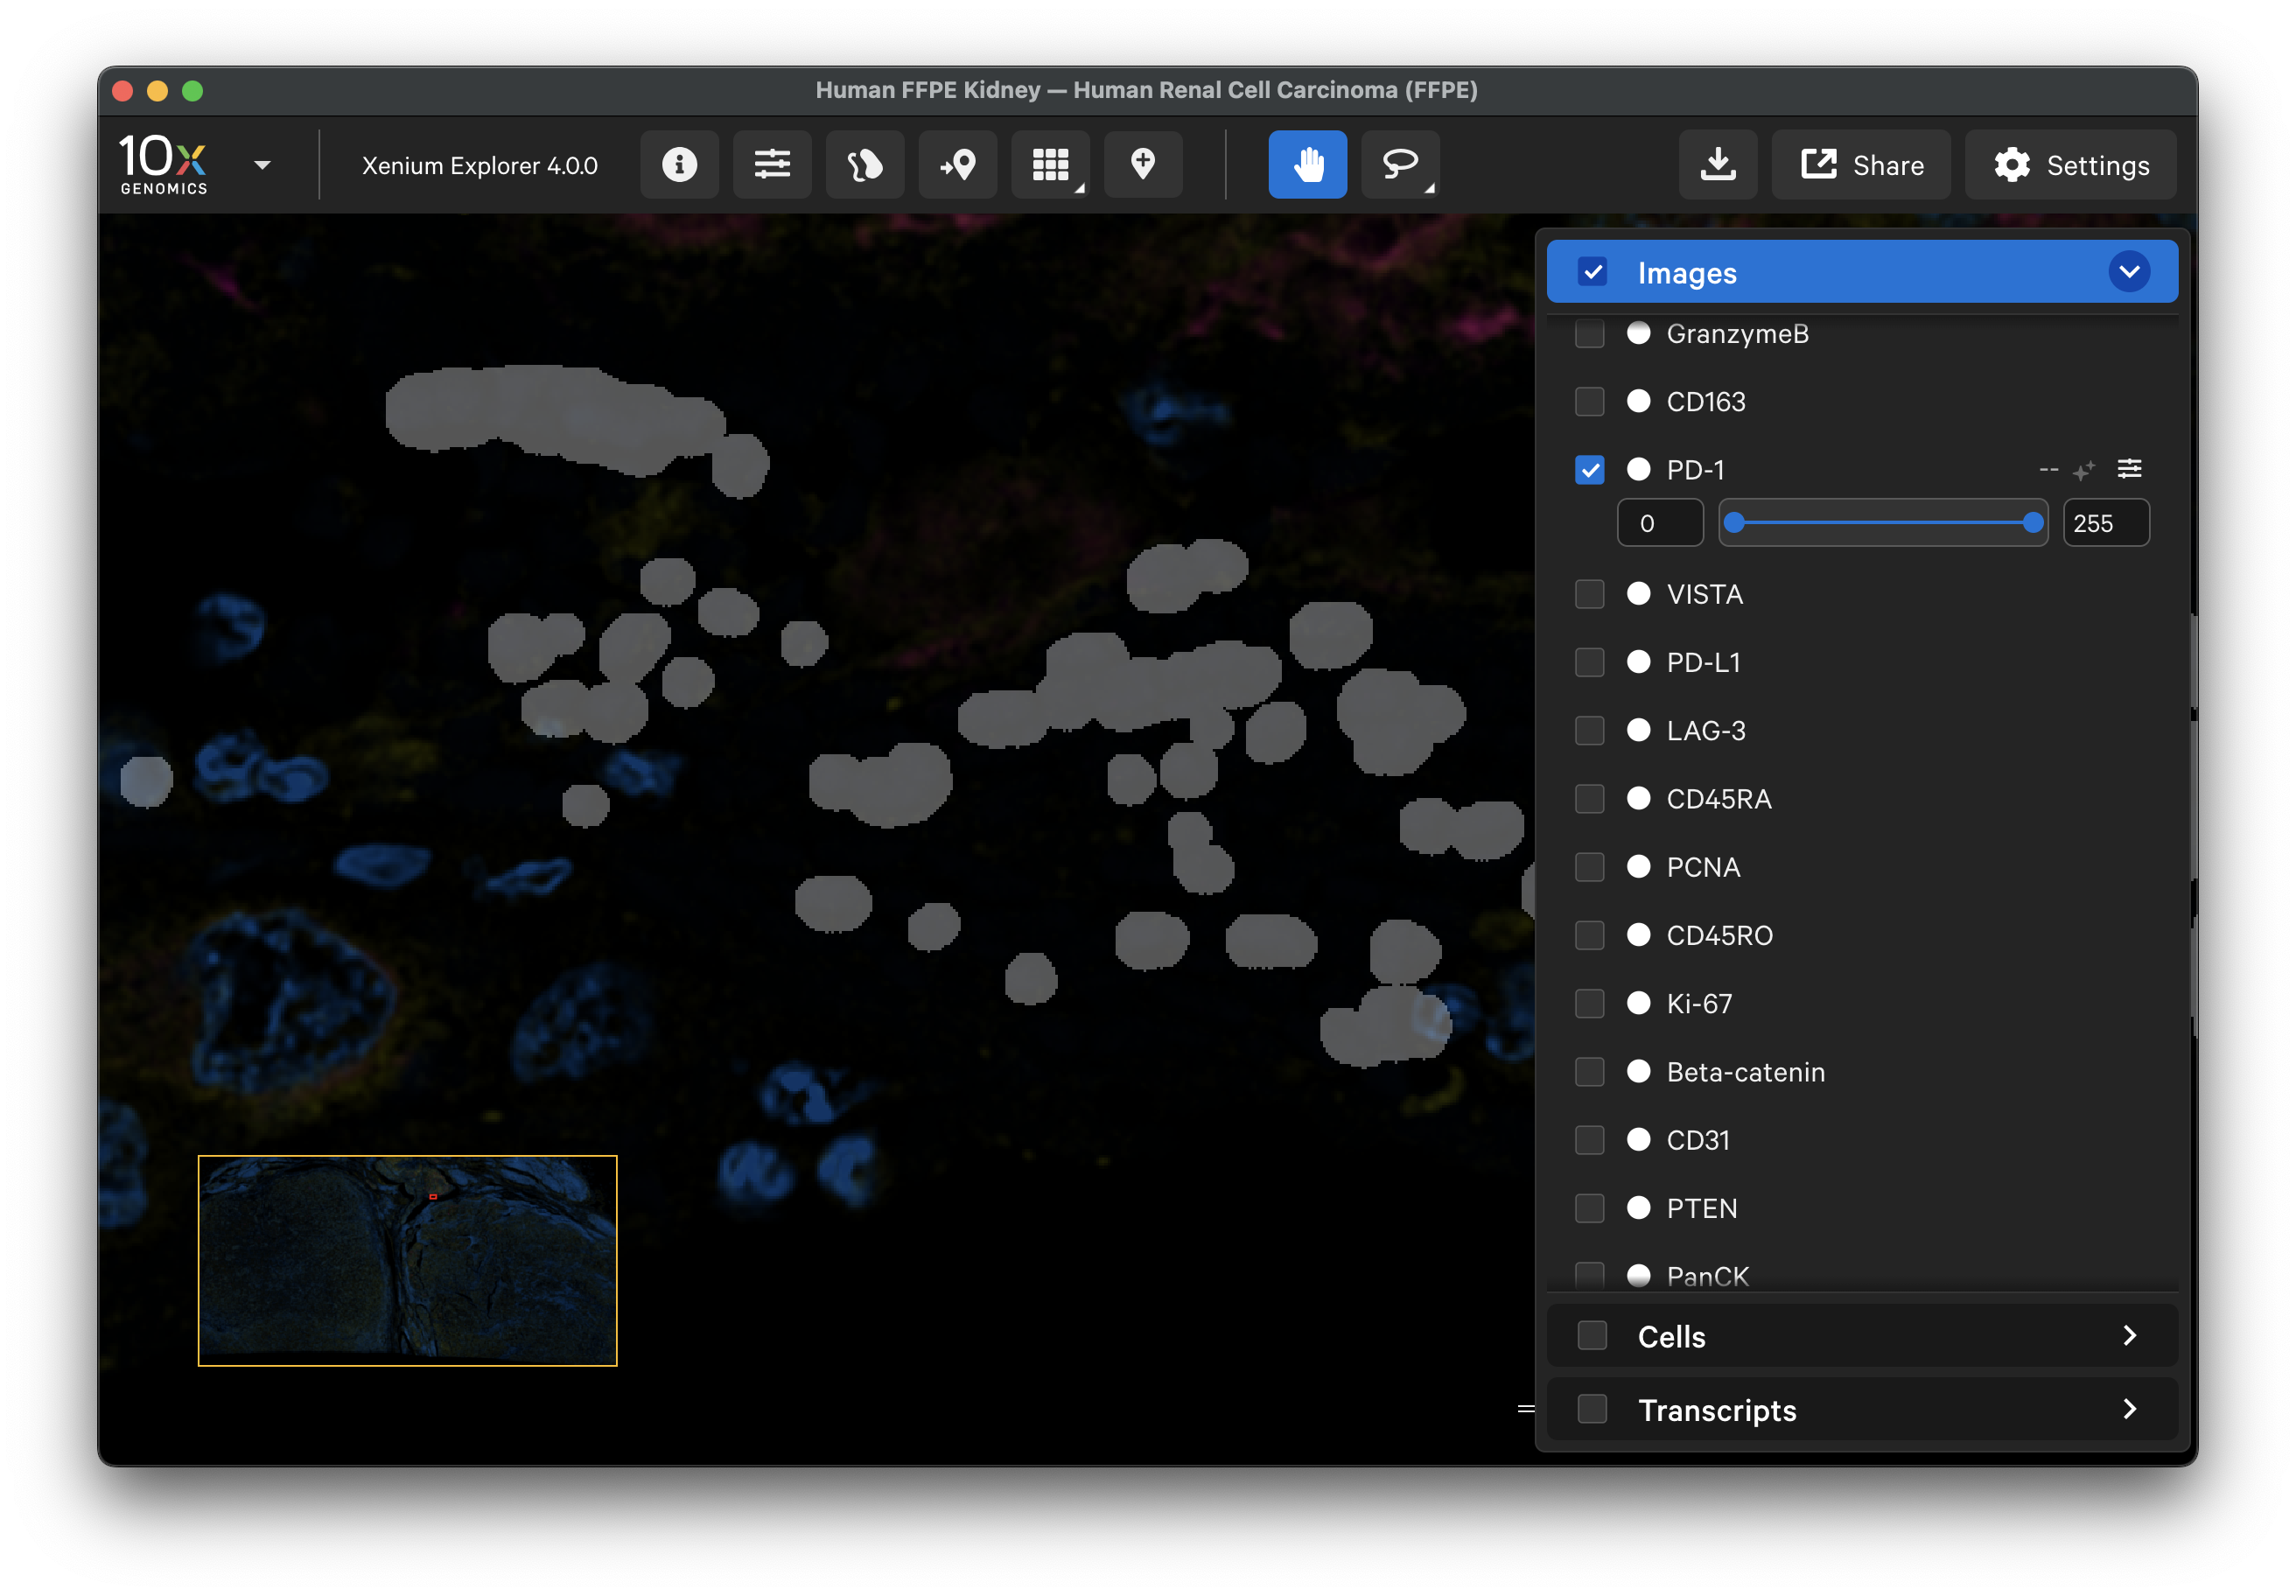
To further assess where each protein had high background signal, XOA v4.0 outputs a saturation QC mask per protein channel image (aux_outputs/morphology_focus_qc_masks) (see saturation masking algorithm). These masks show any regions of the background image that had saturated pixels to aid in distinguishing signal that was masked versus had no signal.
- Use Xenium Explorer’s image import workflow to import the
morphology_focus_qc_masks/ch0000_dapi.ome.tiffile. The masks are already aligned with the dataset's protein images, so further alignment can be skipped. This will load all the mask files since thech0000file contains the metadata for all channels in the dataset. - The image will look blank. Adjust the opacity slider to view the tissue sample under the mask layer (less than 100% opacity). Brighter regions are saturated (pixel value = 255) in the background image, while unsaturated areas are dark (pixel value = 0).
- After inspecting the results, you may wish to crop out regions that were masked in the protein images for downstream analysis. Use the lasso tool to select saturated regions, export selected region coordinates, and subsequently remove these cells from the cell-feature matrix or other XOA output files.