Xenium Explorer offers several features to save and share results.
The Save Current View button allows you to save the current image and viewer state to revisit later on the same computer. While the recent files menu opens the last view state for a given dataset, we recommend saving the current view for important analyses that you would like to continue working on later.
Click the Save Current View button and give the view a name. If you modify a saved view, you can save it with a new name (views cannot be overwritten with the same name) or delete an existing view to reuse the view name.
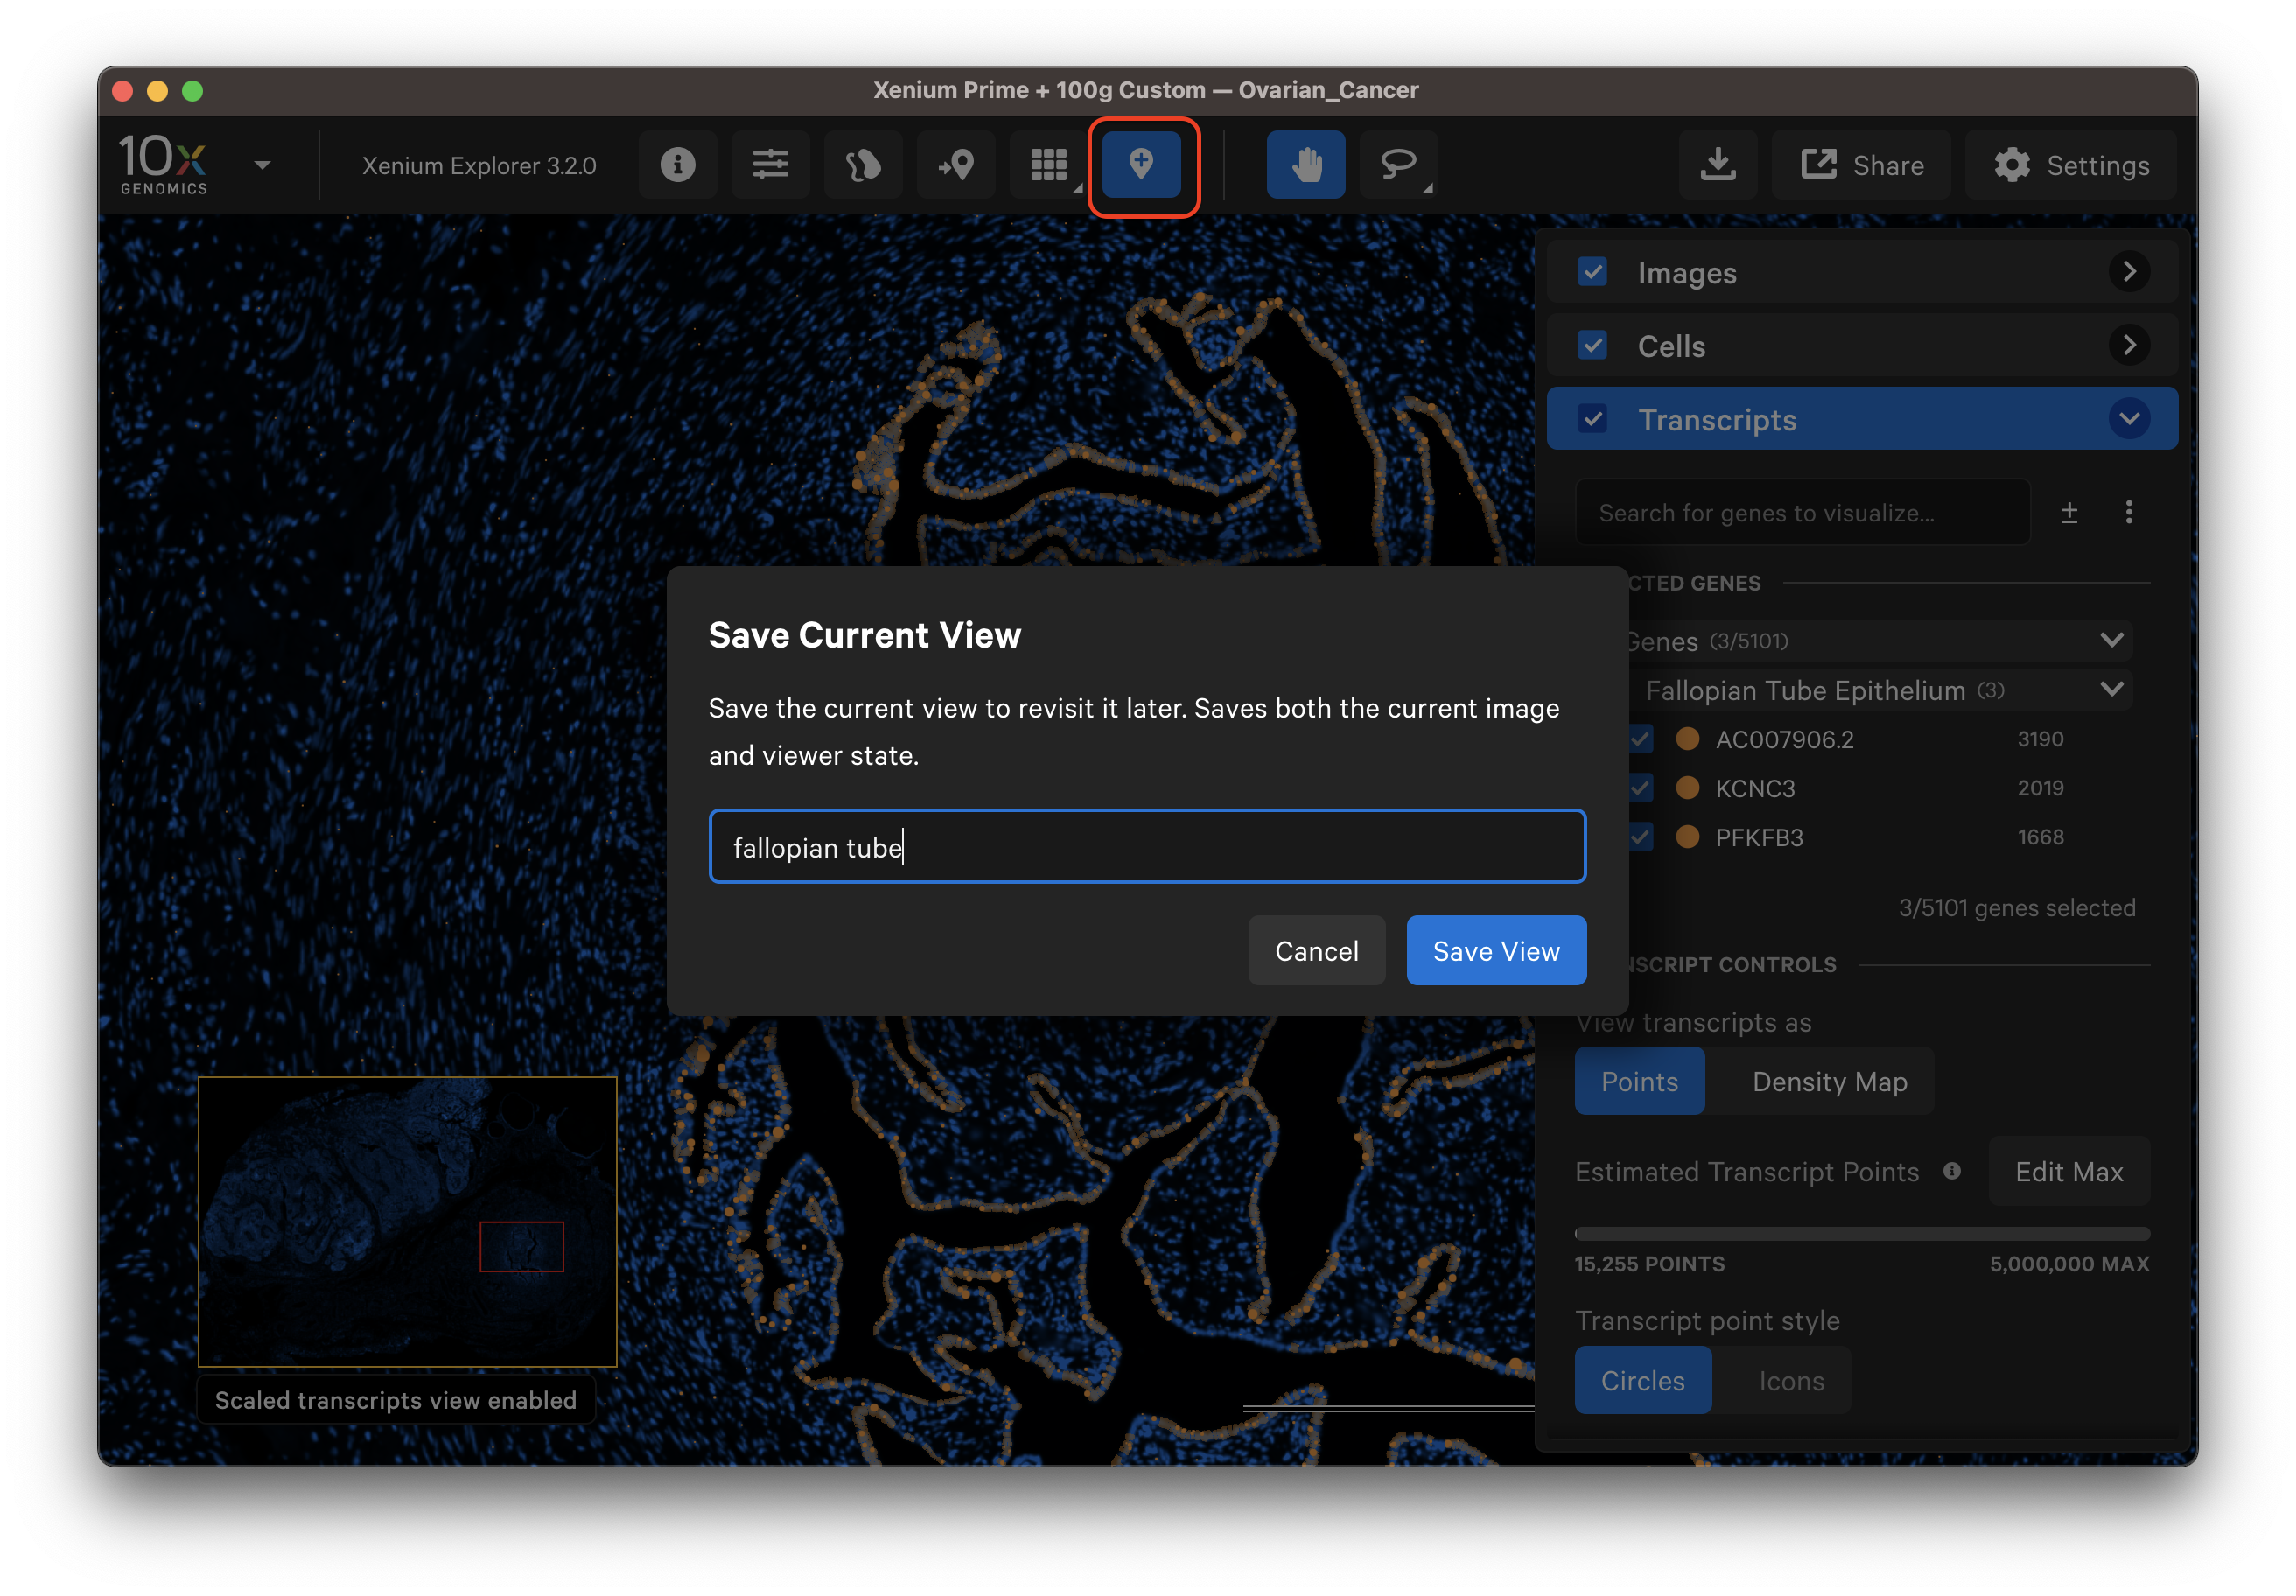
This feature saves the image viewing area (zoom coordinates, image channel contrast) and color settings (i.e., palette, opacity, bin size, scale threshold). In addition, it saves:
- Imported gene groups and associated transcript icon colors and shapes
- Custom transcript or cell coloring
- Custom cell groups and group annotation names
- Selections
- Aligned images
The list above are not saved in shared permalinks (except aligned images) or transferred configurations.
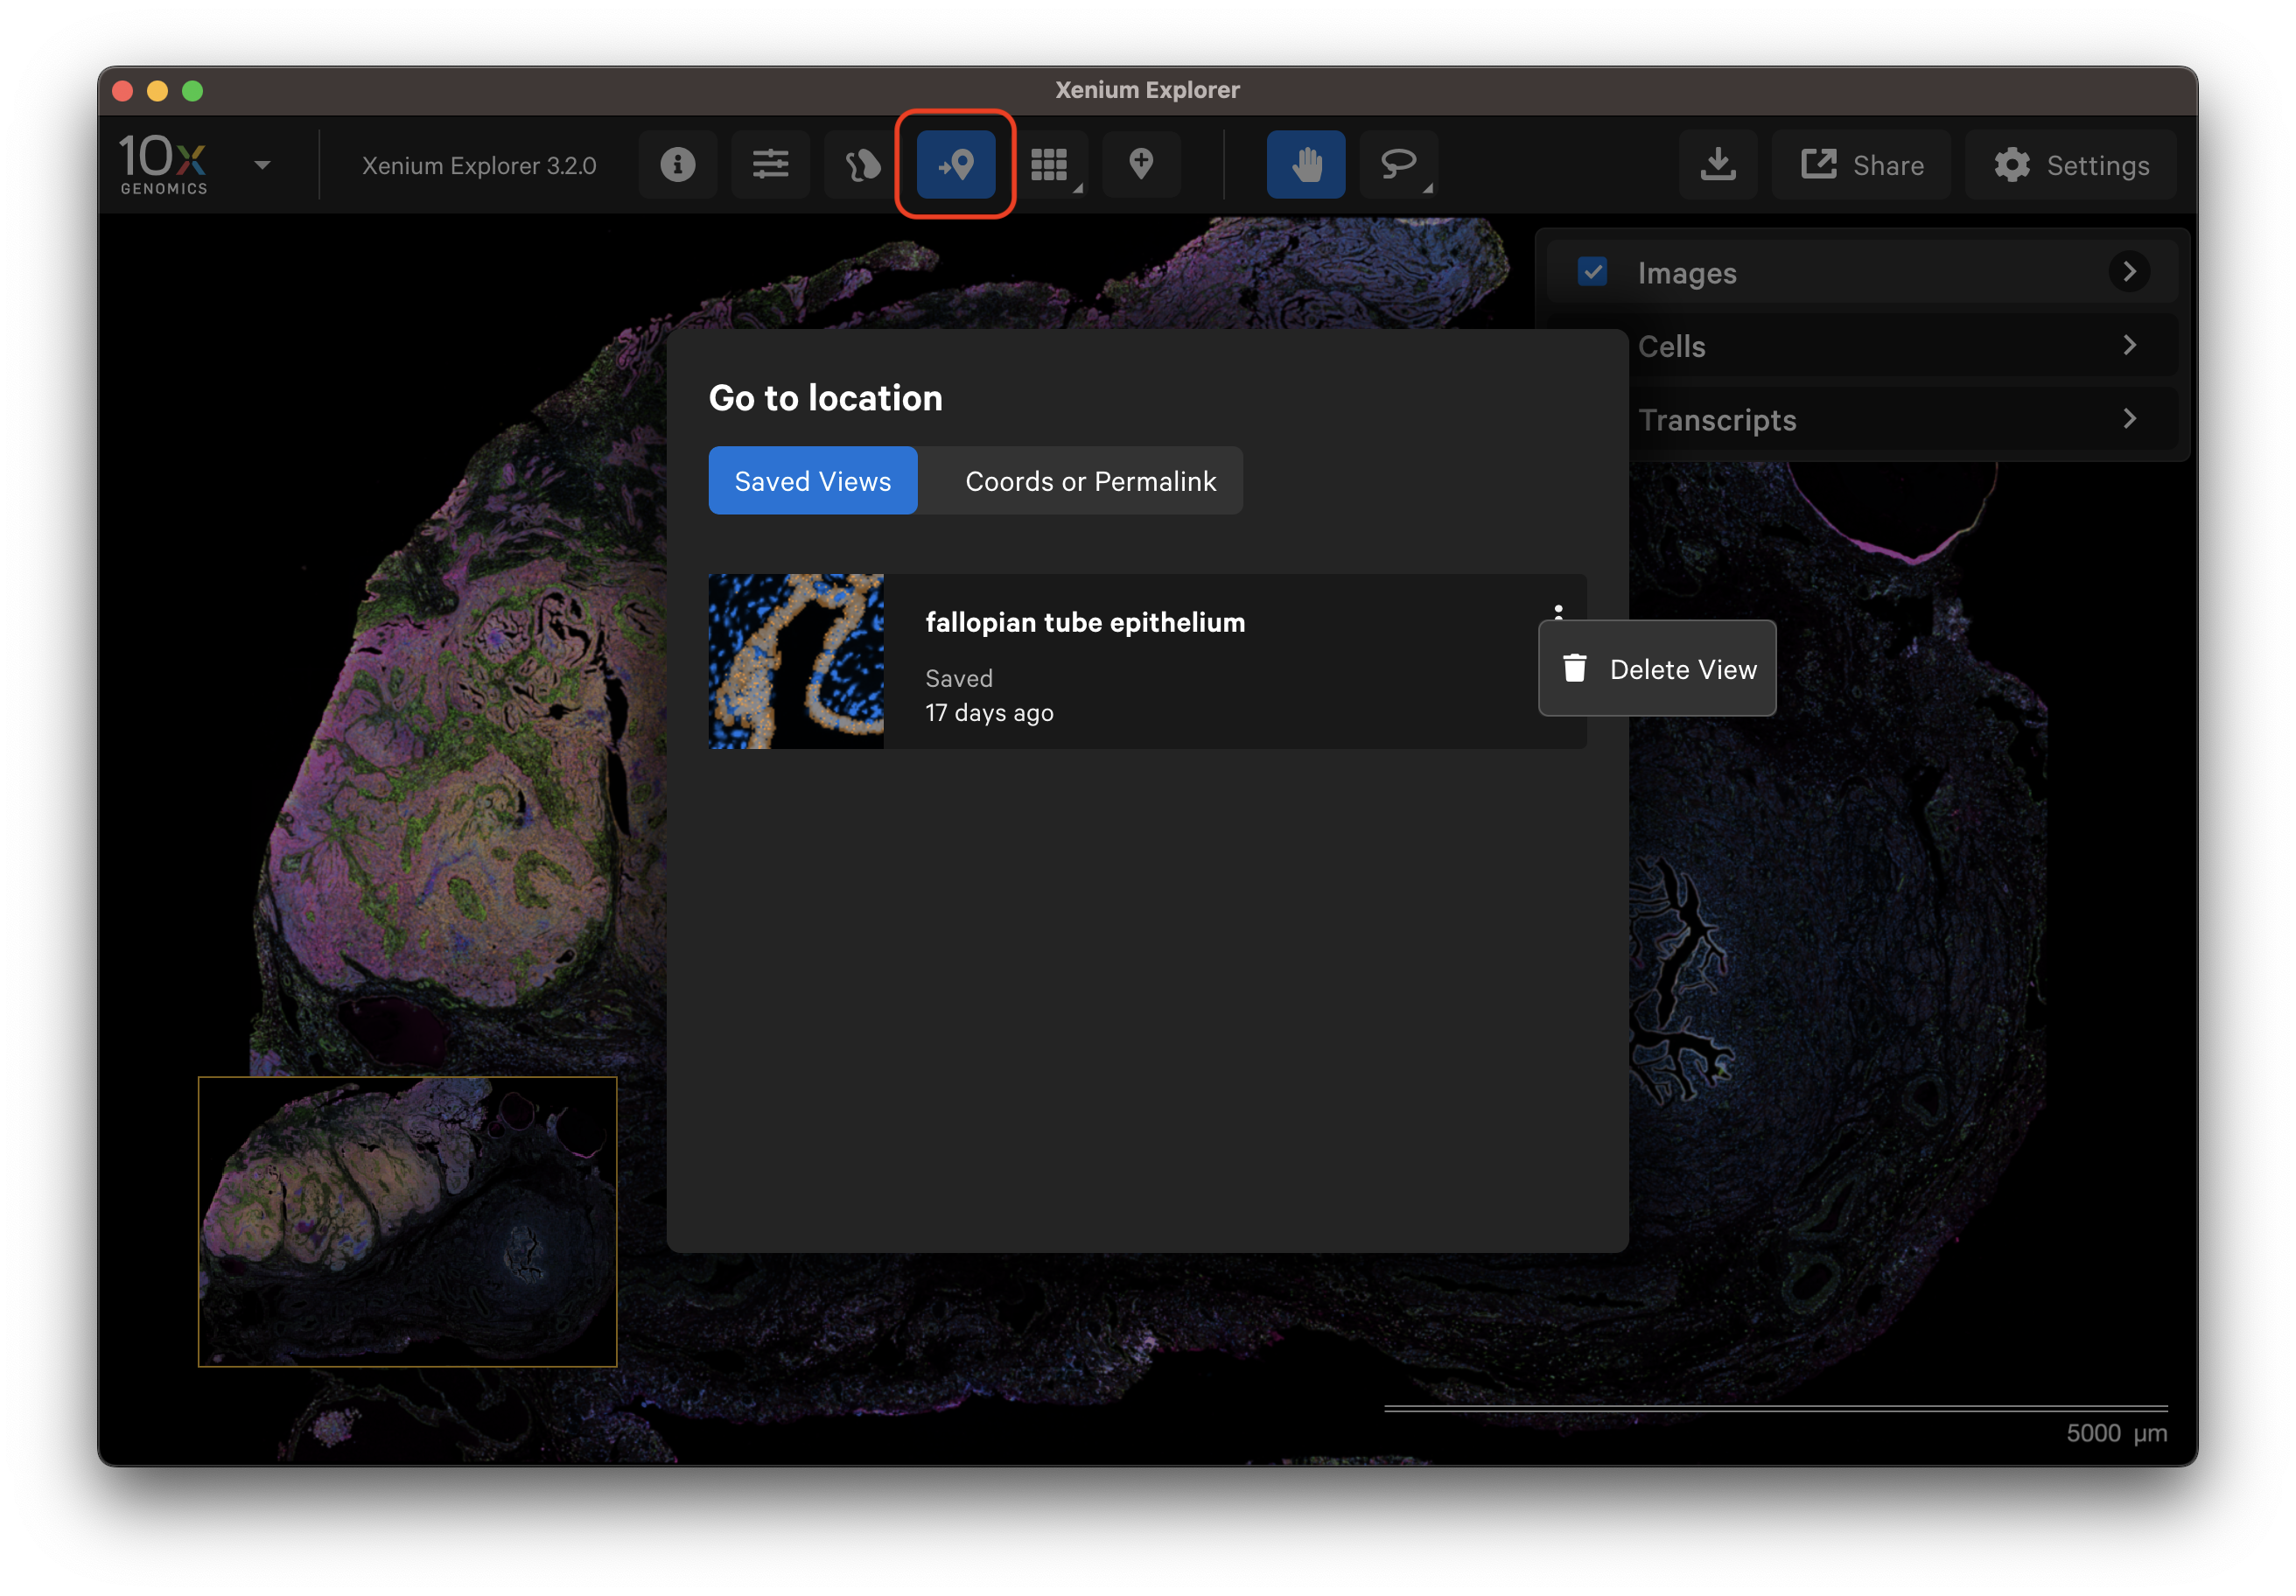
The saved view can be retrieved from the Go to location window. Metadata about the view are displayed on the saved view tile (i.e., the time since the view was saved).
To delete an individual saved view, click the three vertical dots from the Go to location window tile.
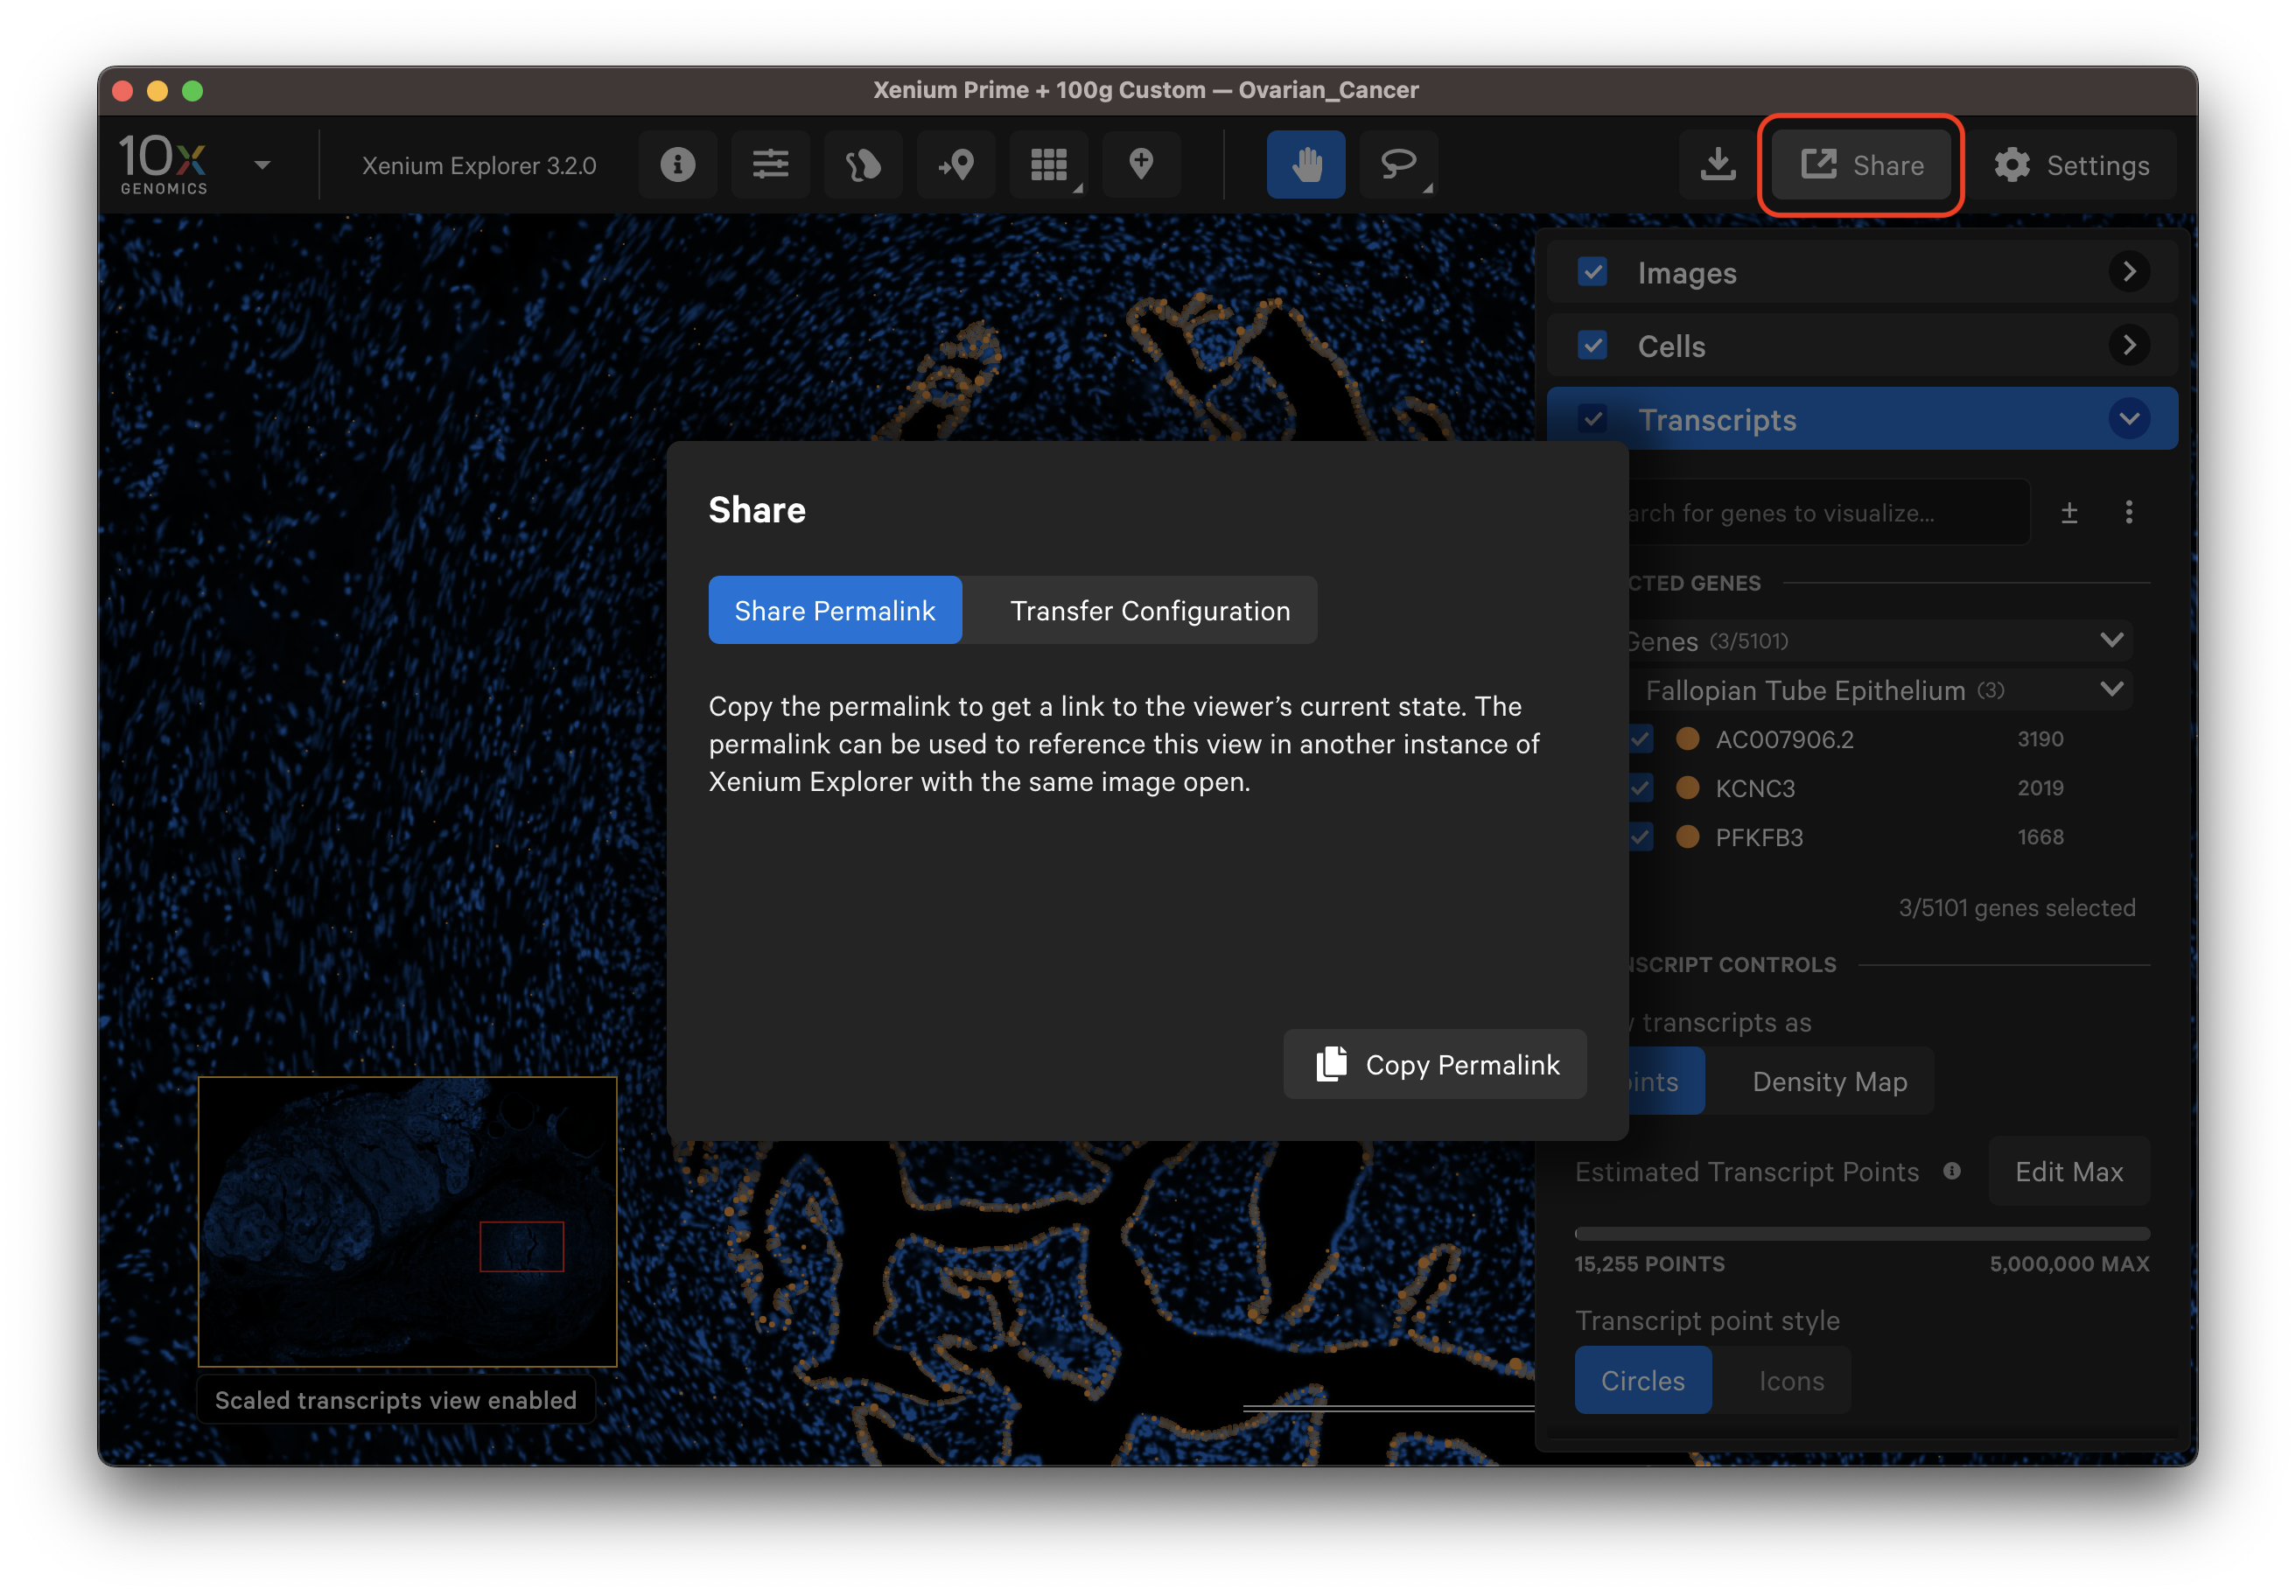
The permalink enables you to share many Xenium Explorer user interface settings, including aligned post-Xenium images. This feature allows a user on another computer to quickly navigate to the same location (e.g., a specific cell) in a given sample with many of the same view settings for easier collaboration.
However, the permalink does not save the following:
- Selections
- Uploaded gene groups
- Custom transcript color/icon
- Custom cluster color/name
- Checked graph-based or K-means clusters in Cells layer
- If turned off, hidden UI setting
- If turned off, filter out low quality transcripts toggle
- Any open pop-up windows (i.e., Sample information)
After modifying viewer settings, click Share and select Copy Permalink.
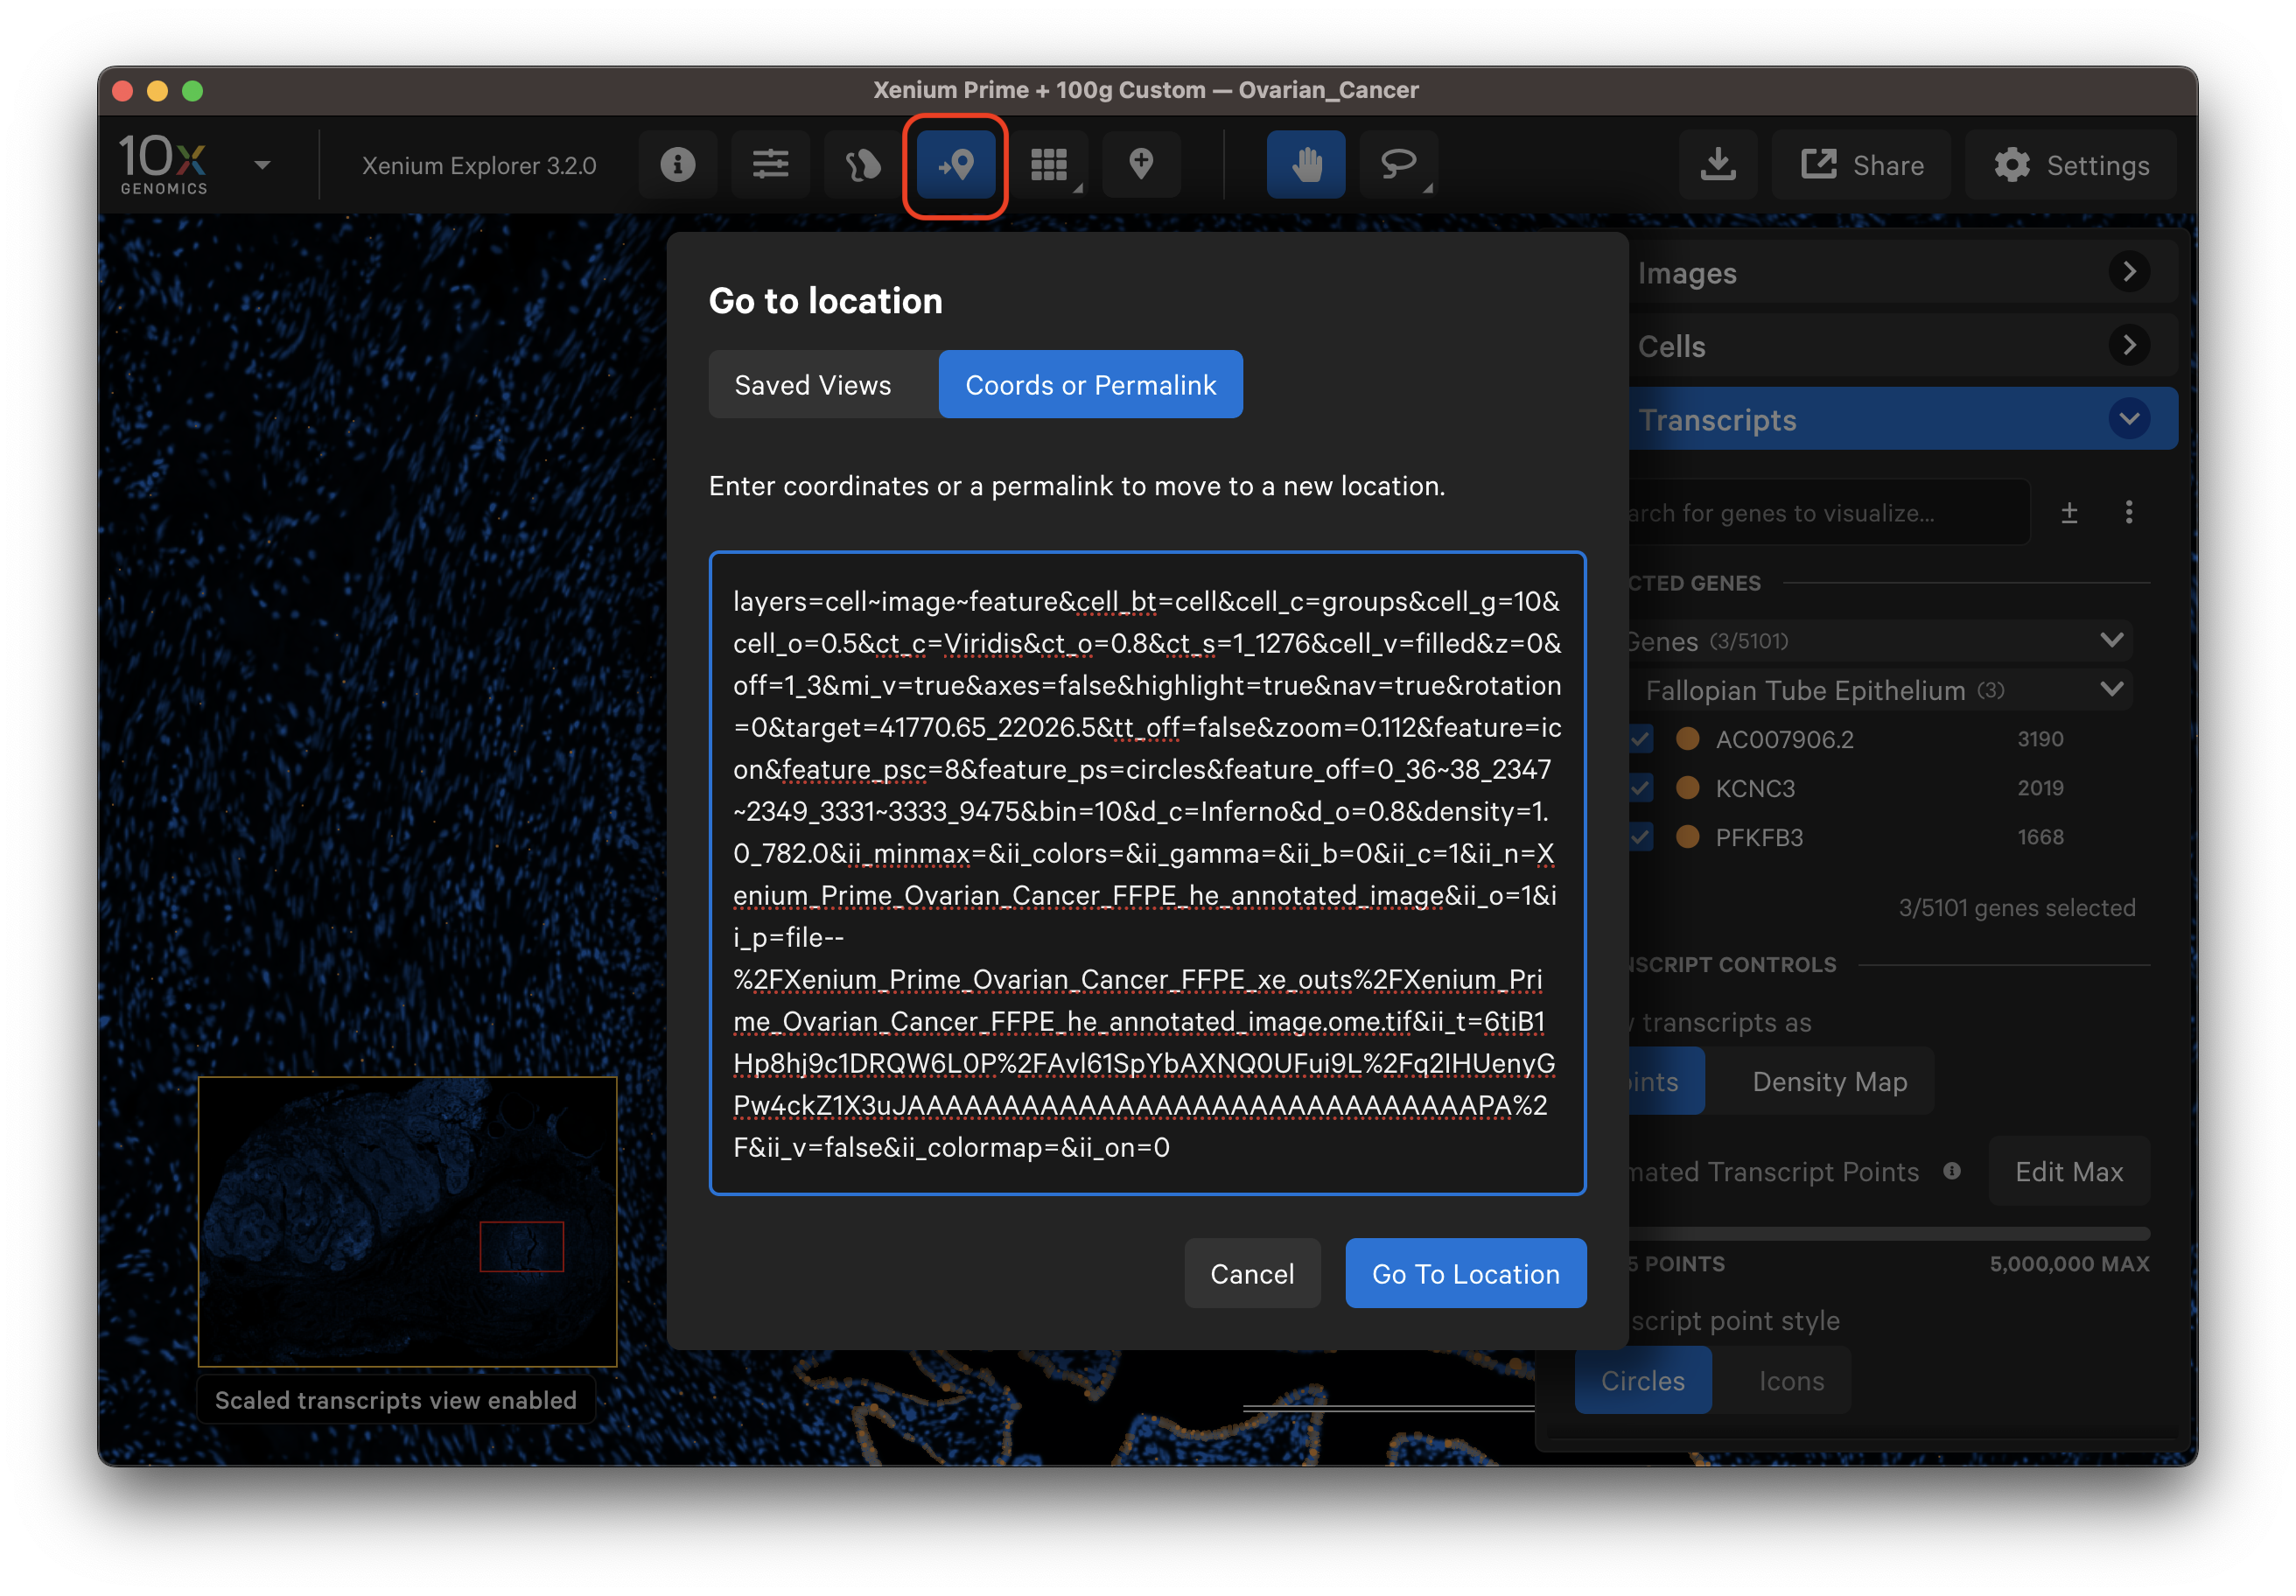
Paste the permalink in the Go to location window (switch to Coords or Permalink).
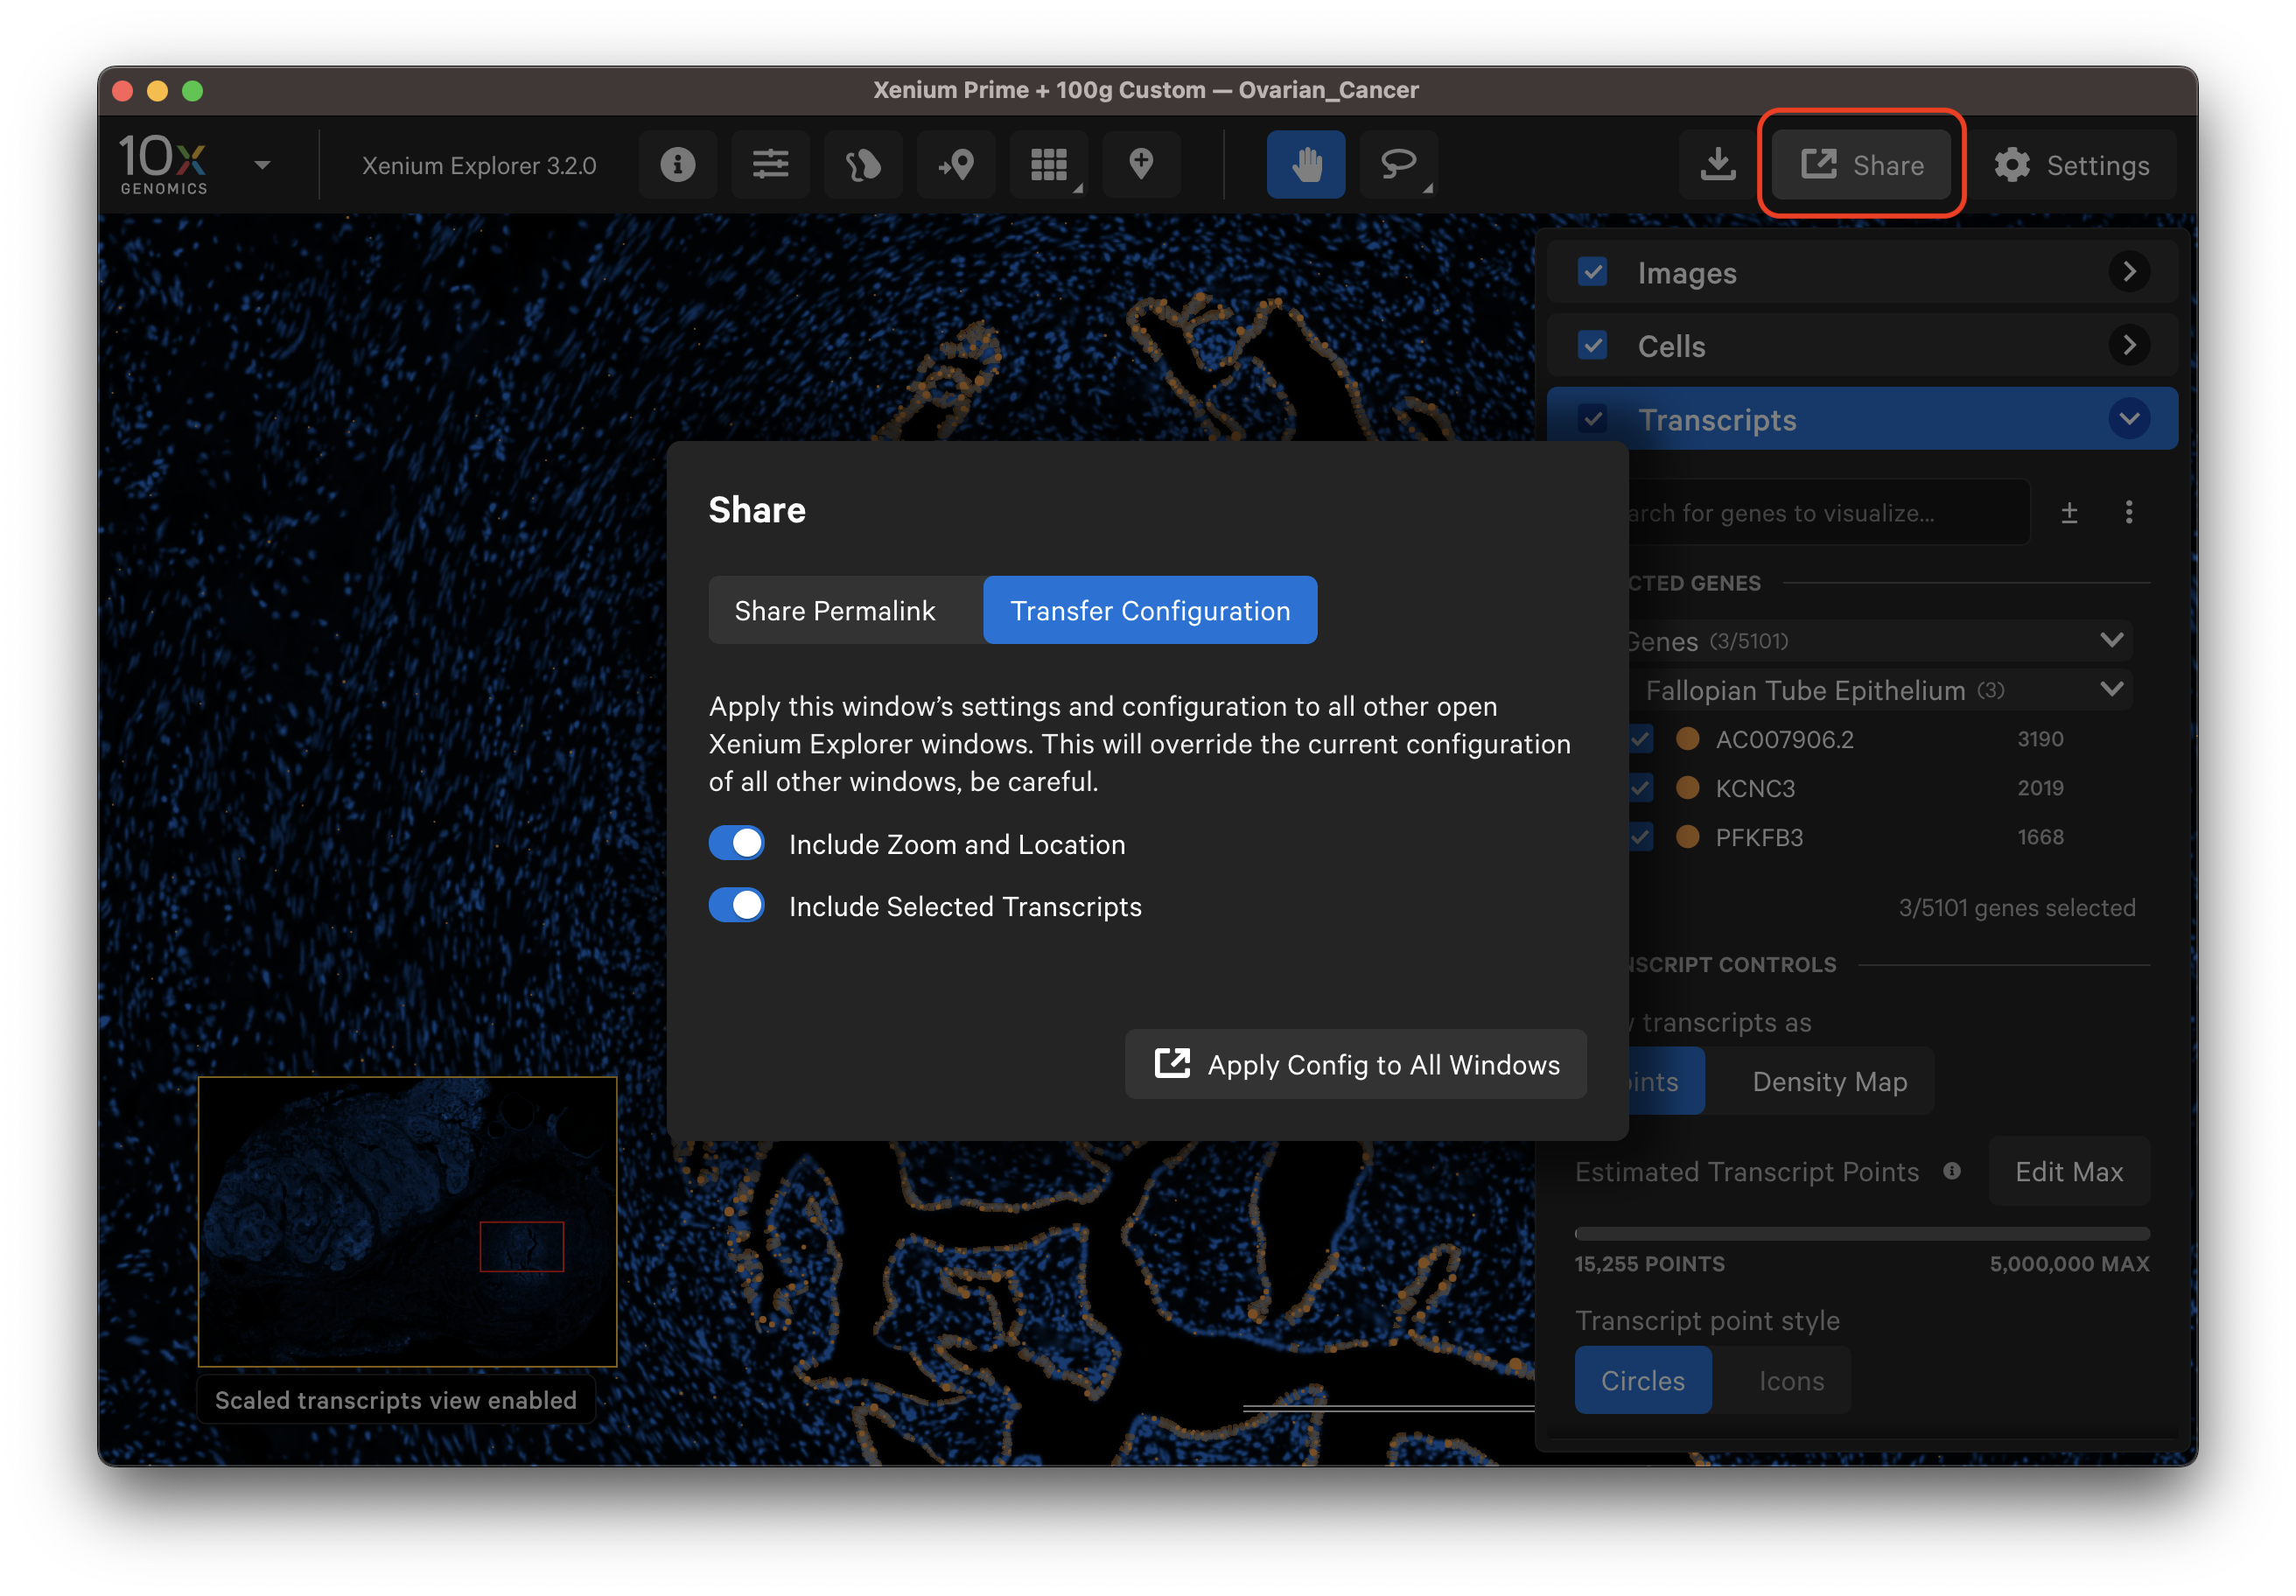
The Transfer Configuration option allows you to share the zoom and location and/or selected transcripts (as density map or as points) and cell states with other open Xenium Explorer windows on the same computer. This feature allows users to apply the same view settings to multiple replicates in an experiment in different Xenium Explorer windows to accelerate analysis.
It will override configurations in other open windows. This feature does not transfer gene groups, custom colors/names, or selections.
After modifying settings, open a new window (File > New Window). Then, click Share, Transfer Configuration, and select the information to transfer with the toggles. Finally, click Apply Config to All Windows. You can transfer configurations to the same dataset or a different dataset opened in a new window.
Modifying permalinks
While it is easiest to adjust settings in the user interface itself, the following parameters can be modified in the permalink:
| Parameter | Query value example | Description |
|---|---|---|
| axes | axes=false | Show scale axes toggle setting (true, false) |
| bin | bin=10 for 10µm bin size | Density map bin size (10, 20, 40, 80) |
| bounds_c | bounds_c=ababab~dd51ad | Boundary colors for cell and nucleus (hex color values, separated by ~) |
| cell_bt | cell_bt=nucleus (show cell nuclei) | Cell boundary type (cell, nucleus, both) |
| cell_c | cell_c=groups for coloring by cluster affiliation and neutral for coloring cells white | Cells colored by (constant, features, groups) |
| cell_g | cell_g=2 for 3rd clustering type | Clustering type (any integer) |
| cell_o | cell_o=.5 for 50% opacity | Cell fill opacity slider for groups (any decimal number between 0-1) |
| cell_v | cell_v=outlined (cell outline) | Cell view type (filled, outlined, both) |
| colors or colormap | Color set to hex value or colormap set to colormap name | Image color |
| ct_c | ct_c=Inferno | Transcript density map coloring setting (Viridis, Inferno, YlOrRd) |
| ct_o | ct_o=.8 for 80% opacity | Cell fill opacity slider for transcripts (any decimal number 0 - 1) |
| ct_s | ct_s=5_123 for 5 to 123 | Cells colored by Selected Transcripts slider (integer range separated by _) |
| d_c | d_c=Viridis | Density map coloring setting (Viridis, Inferno, YlOrRd) |
| d_o | d_o=.8 for 80% opacity | Density map opacity slider (any decimal number 0 - 1) |
| density | density=1.5_5.0 for 0.015 to 0.05 | Density map scale threshold slider |
| feature | feature=icon | Feature type (icon, density) |
| feature_off | feature_off=0_6~10_541 for hiding features 0-6 and 10-541 | Transcript visibility toggle (may include indices beyond panel genes because the range includes negative control targets) |
| feature_po | feature_po=.5 | Feature point opacity (decimal numbers 0 - 1) |
| feature_ps | feature_ps=circles | Feature point style (icons, circles) |
| feature_psc | feature_psc=6 | Feature point size scale |
| ii_b | ii_b=0_0 | Brightness per imported image (decimal numbers -1 to 1, separated by _) |
| ii_c | ii_c=0_5 | Contrast per imported image (decimal numbers 0 - 10, separated by _) |
| ii_colormap | ii_colormap=_viridis (first image none, second image viridis) | Colormap per imported image (any of viridis or inferno, separated by _) |
| ii_colors | ii_colors=00ff00~~ff0000_ (first image: first channel green, third channel red, rest default; second image: all default) | Colors per imported image (groups of hex color values separated by ~, images separated by _) |
| ii_gamma | ii_gamma=_5~~~0 (first image: all default; second image: first channel 5, fourth channel 0, rest default) | Gamma correction per imported image (groups of decimal numbers 0 - 5 separated by ~, images separated by _) |
| ii_minmax | ii_minmax=0_1000__~~100_500 (first image: first channel [0,1000], rest auto-leveled; second image: third channel [100,500], rest auto-leveled) | Channel intensity per imported image (groups of integer ranges with _ separated by ~, images separated by __) |
| ii_n | ii_n=My H&E image%09IF Image | Name of imported images (non-empty strings, separated by %09) |
| ii_o | ii_o=0.5_1 | Opacity per imported image (decimal numbers 0 - 1, separated by _) |
| ii_on | ii_on=0_2__0~3 (first image: channels 0, 1, and 2 are active; second image: channels 0 and 3 are active) | Active channels per imported image (groups of integer ranges with _ separated by ~, images separated by __) |
| ii_t | ii_t=AAAAAAAA8D8AA[...] | Transformation matrix string per imported image (serialized Matrix4 objects, separated by _) |
| ii_v | ii_v=false_true | Visibility per imported image (true, false, separated by _) |
| ii_only_white | ii_only_white=false_true | Display channel in grayscale or color per imported multichannel image (one boolean per imported image) |
| ii_palette | ii_palette=pure_uniform_pure | Uniform or standard color palette per imported multichannel image (one string per imported image) |
| ii_type | ii_type=IF_HE | An image type override per imported image if the autodetected type is incorrect from the image import workflow (one string per imported image) |
| layers | layers=cell~image (show image and cell layers) | Visible layers (cell, feature, image, separated by ~) |
| mi_v | mi_v=false | Morphology image visibility (true, false) |
| nav | nav=true | Show image navigator toggle setting (true, false) |
| off | off=0 if image visibility toggled off | Image visibility toggle (integer range with _, separated by ~) |
| rotation | rotation=90 (rotate image 90º clockwise) | Image rotation (0, 90, 180, 270) |
| sliders | sliders=8_709 for min threshold 8 and max threshold 709 | Image slider (integer range with _, separated by ~) |
| target | target=17708_12889 for view area center (17708,12889) | X,Y location (decimal range separated by _) |
| tt_off | tt_off=true for turning off cell/transcript tooltips | Show tooltips (true, false) |
| z | z=17 for maximum intensity in a 16 high image stack; z=18 for autofocus | Z-slice number, maximum intensity projection, or autofocus (any integer) |
| zoom | zoom=0.412 for zoom level 0.412 | Zoom level (any decimal) |
Here are some examples for modifying image settings with the permalink parameters:
Example 1: Change the viewing area x,y coordinates by modifying the values in the target parameter (format: x_y)
Original:
zoom=0.0801&target=31421.79_20635.79&z=17&
off=&tt_off=true&feature=icon&
feature_off=0_6\~8_67\~69_204\~206_256\~258_541&
bin=80&density=0.1_12.0&cell_c=groups&cell_g=1&cell_f=true
Edit to:
zoom=0.0801&target=5400_5400&z=17&
off=&tt_off=true&feature=icon&
feature_off=0_6\~8_67\~69_204\~206_256\~258_541&bin=80&
density=0.1_12.0&cell_c=groups&cell_g=1&cell_f=true
Example 2: Change the image slider threshold values (format: min_max).
In this example, the default values were not changed, so the permalink does not contain the slider parameter. Parameters are separated by an "&" and there is no set parameter order in the permalink. We will add the slider parameter to the end of the permalink.
Original:
zoom=0.0801&target=31421.79_20635.79&z=17&
off=&tt_off=true&feature=icon&
feature_off=0_6\~8_67\~69_204\~206_256\~258_541&bin=80&
density=0.1_12.0&cell_c=groups&cell_g=1&cell_f=true
Edit to:
zoom=0.0801&target=31421.79_20635.79&z=17&
off=&tt_off=true&feature=icon&
feature_off=0_6\~8_67\~69_204\~206_256\~258_541&bin=80&
density=0.1_12.0&cell_c=groups&cell_g=1&cell_f=true
&sliders=8_709
Example 3: Set image channel color to a value not available in the user interface (format: HEX color value)
Original:
zoom=0.0801&target=31421.79_20635.79&z=17&
off=&colors=00ffff&tt_off=true&
feature=none&feature_off=0_6\~8_67\~69_204\~206_256\~258_541&
bin=80&density=0.1_12.0&cell_c=groups&cell_g=1
Edit image color to green:
zoom=0.0801&target=31421.79_20635.79&z=17&
off=&colors=2ca25f&tt_off=true&
feature=none&feature_off=0_6\~8_67\~69_204\~206_256\~258_541&
bin=80&density=0.1_12.0&cell_c=groups&cell_g=1