Pancreatic Cancer with Xenium Human Multi-Tissue and Cancer Panel
In Situ Gene Expression dataset analyzed using Xenium Onboard Analysis 1.6.0

Learn about Xenium Analysis
Overview
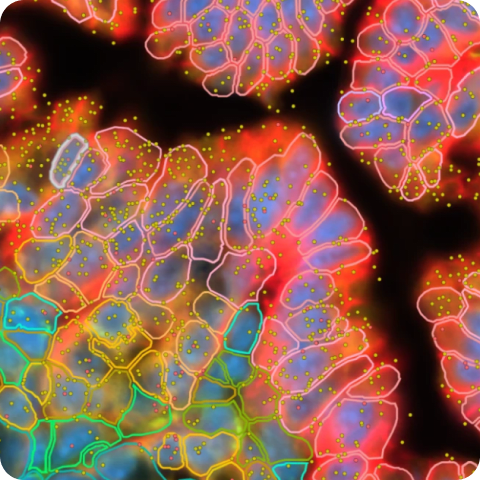
Xenium In Situ Gene Expression data for human pancreatic cancer sections using the Xenium Human Multi-Tissue and Cancer Panel.
How to View Data
Interactively explore this dataset with the Xenium Explorer web demo ("Open web demo" above) or download the files to explore further on your desktop. Learn about the biology highlighted in this dataset here.
The Xenium Explorer subset bundle contains the experiment.xenium, morphology_mip.ome.tif, analysis_summary.html, cells.zarr.zip, cell_feature_matrix.zarr.zip, transcripts.zarr.zip, and analysis.zarr.zip files. See the Getting Started with Xenium Explorer page for more details. Follow these instructions to use image alignment files to import the post-Xenium images in Xenium Explorer.
Biomaterials
An FFPE-preserved block was purchased from AcePix Biosciences (adenocarcinoma, Grade I-II, 50% tumor).
Tissue preparation
Tissues were prepared following the Xenium In Situ for FFPE - Tissue Preparation Handbook (CG000578).
Gene panels
The Xenium Human Multi-Tissue and Cancer Panel (377 genes) was pre-designed by 10x Genomics. The panel design was informed using single cell RNA sequencing data curated and reprocessed for standardization by the Human Protein Atlas. 93 genes were chosen to specifically detect the major cell types of breast, lung, kidney, liver, skin, colon, heart, lymph node, and pancreas tissues. 284 genes were designed to be common to all tissues, especially immune and cancer markers.
The pre-designed panel was supplemented with an additional 97 genes, including some high expressers to test for any sensitivity loss due to crowding.
Xenium Analyzer
The instrument run was performed following the Xenium Analyzer User Guide (CG000584). The on-instrument analysis was run with Xenium Onboard Analysis version 1.6.0.
| Metric | Adenocarcinoma |
|---|---|
| Cells detected | 190,965 |
| Decoded transcripts per 100 µm2 | 135.2 |
| Median transcripts per cell | 114 |
| Total high quality decoded transcripts | 23,926,081 |
| Region area (µm2) | 22,386,228 |
Post-Xenium Imaging
Post-instrument IF staining was conducted as follows: Sections were washed with PBST, then incubated in a blocking buffer (ScyTek AAA999) for 30 minutes at room temperature. The primary antibody (see Table) in the blocking buffer was added and incubated in the dark at 4°C overnight. The following day, the sections were washed three times (10 minutes each) with PBST, then incubated with secondary antibodies (see Table) and DAPI in blocking buffer in the dark at room temperature for two hours. Next, the sections were washed three times (10 minutes each) with PBST, incubated with 80% glycerol, and mounted in CitiFluor CFM-3 mounting media (EMS 17979-20).
Post-instrument H&E staining followed the Demonstrated Protocol Xenium In Situ Gene Expression - Post-Xenium Analyzer H&E Staining (CG000613). The image was tiled, stitched, and acquired on an Olympus VS200 Slide Scanner. The image was registered following this tutorial.
Antibodies used for the post-Xenium IF staining:
| Protein | Host | Fluor | Vendor | Catalog | Dilution |
|---|---|---|---|---|---|
| CD20 | Mouse | Unconj. | Abcam | AB219329 | 1:100 |
| TROP2 | Rabbit | Unconj. | Abcam | AB214488 | 1:100 |
| PPY | Goat | Unconj. | Abcam | AB77192 | 1:100 |
| Ms IgG | Donkey | Alexa 488 | ThermoFisher | A-21202 | 1:500 |
| Rb IgG | Donkey | Alexa 594 | ThermoFisher | A-21207 | 1:500 |
| Gt IgG | Donkey | Alexa 647 | ThermoFisher | A-32849 | 1:500 |
Sections were imaged on a Zeiss Axioimager with a 40x (0.95 NA) air objective. Zen Blue software was used for tiling, image acquisition, and stitching. An ome.tif file was exported using QuPath and registered to the Xenium data using a development version of Xenium Explorer.
Custom Cell and Gene Groups
Xenium data was imported into Seurat v4.3.0.1. Using the FindClusters function (resolution = 0.5), 17 cell clusters were identified. Most cell types were annotated using the Human Protein Atlas. Metaplastic cells were annotated given their co-expression of acinar and ductal/tumor markers (Schlesinger et al., 2020). Tumor cells that do not express the Cystic Fibrosis Transmembrane Conductance Regulator (CFTR) gene form a distinct cluster of CFTR- tumor cells. Two populations of endocrine cells were identified, and differ in their relative expression of PPY, SST, GCG, and INS. Using the FetchData function, barcodes for each cluster were exported into a CSV and then imported into Xenium Explorer by creating custom cell groups. Custom gene groups were assigned by looking at high-ranking differentially expressed genes in each of the clusters using the FindAllMarkers function.
Pathology Annotations
Pathology annotations can be imported in GeoJSON format in Xenium Explorer v4.1 and later (see Annotation Layer documentation for details). The supplemental GeoJSON annotation file is aligned to the post-Xenium H&E image.
This dataset is licensed under the Creative Commons Attribution 4.0 International (CC BY 4.0) license. 10x citation guidelines available here.