Examining Alzheimer’s Disease from chromatin to cell state

Alzheimer’s disease (AD) is an illness with many questions and few answers: why do some people decline faster than others? Why do some have extensive pathology with few cognitive deficits, but some are the opposite? Why does it seem like a mosaic of cell types and regulatory networks underlie different stages and facets of this disease? And, most fundamental and heartbreaking of all, why is this happening to a loved one?
Recently, a group of researchers published a series of articles (1–4) to help answer those first questions in the hopes that no one will ever again have to ask the last. They used genomics, epigenomics, and transcriptomics to characterize disease-associated cell types and states, untangle gene regulatory networks, and tease apart relationships between cognition and cell composition. Moreover, they did it all at unprecedented scale with epigenomic and transcriptomic information from hundreds of patients and (in one publication) literally millions of nuclei using the Chromium Single Cell Multiome ATAC + Gene Expression assay.
Read on to see how these four articles are unraveling the impacts of AD on the genome, epigenome, transcriptome, and how each of these biological systems inform and influence the others.
*Author’s note: While we strive to highlight the impacts of the papers we feature, the scope and scale of these publications make that difficult for a single blog. We strongly recommend reading the original papers if you have any interest in the field as, in the author’s opinion, they represent a truly staggering and significant contribution to our body of knowledge for AD.*
Breaking bad: AD-associated double-stranded DNA breaks
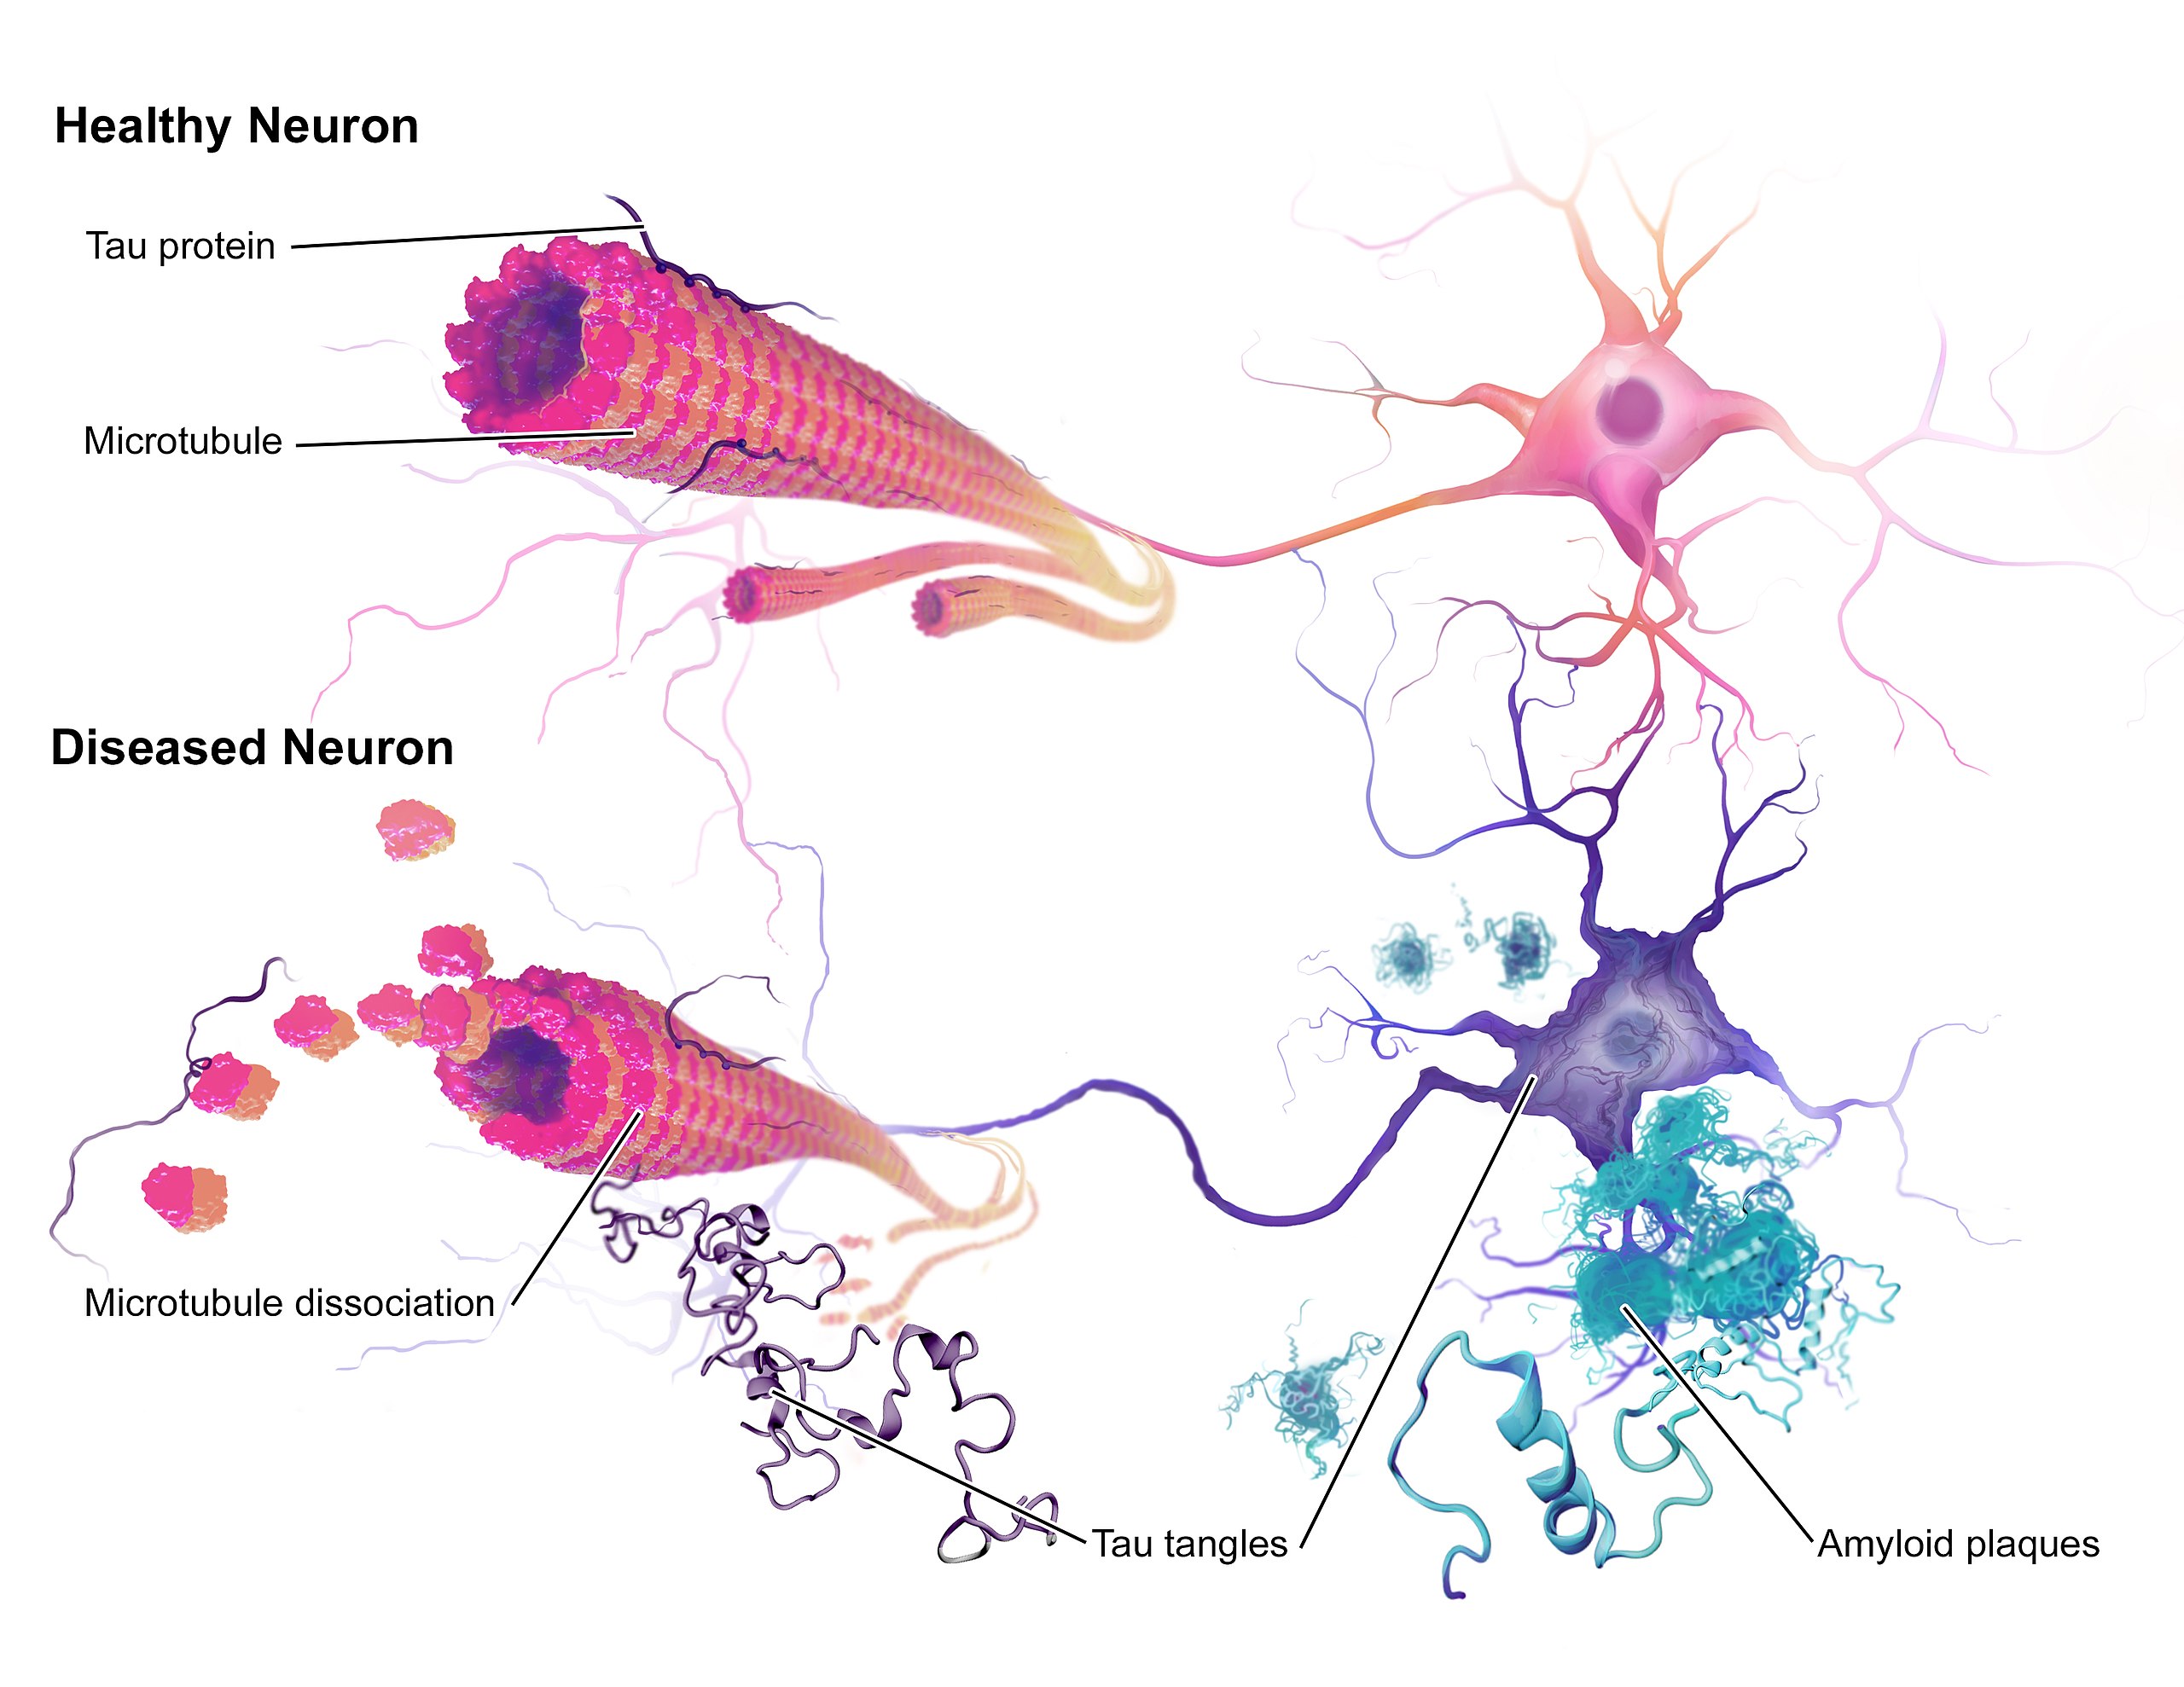
Most people are familiar with two of the major AD neuropathologies—amyloid plaques and neurofibrillary tangles—but fewer know that double-stranded DNA breaks (DSBs) are also an early pathological marker in AD. Given that DSBs can lead to genomic instability (such as gene fusion events), and that they are common in AD, Dileep et al. (1) sought to uncover how they might impact the neuronal genome in AD.
Using over 2 million nuclei collected from 380 patients, the researchers determined that not only were gene fusion events more common in AD, but that they exhibited cell-type specificity. Excitatory neurons that expressed genes more linked to neuronal cell functions were depleted for gene fusion events. In contrast, excitatory neurons that expressed greater levels of DNA damage and repair genes had a greater number of gene fusion events and were associated with AD pathology markers.
The researchers next looked at a key mediator of DSB repair: the cohesin complex. They saw increased expression of genes in this complex in the excitatory neurons of patients with high levels of AD pathology. In these same cell types they saw increased expression of histone genes, including several—H2AFX and H2AFV—linked to DSB and DNA damage pathways, highlighting the cell type– and pathology-specific alterations in DNA structure in AD.
Deconstructing the epigenome in AD
This group of studies started with the epigenome, and the researchers went big from the get-go. In Xiong et al. (2), the researchers used a total of ~850,000 nuclei (~414,000 for single nuclei RNA-seq and ~437,000 for single nuclei ATAC-seq) from 92 patients to characterize the prefrontal cortical “regulome” in early AD, late AD, and healthy patients.
This multiomic data was able to resolve several dozen cell subtypes, including 29 neuronal (14 excitatory, 15 inhibitory) and 22 glial and vascular subtypes. In spite of this diversity, the investigators saw open chromatin peaks that were consistent with cell-type gene expression specificity.
They next leveraged these findings to characterize prospective regulators and identified several dozen, with a large proportion of these exhibiting cell-type specificity. Intriguingly, they were unable to detect any large effect sizes between single open chromatin peak–gene pairs, making it more likely multiple regulators work together in organizing gene expression. Researchers added more evidence to this likelihood by generating cell type–specific co-accessibility modules, finding that each module had an average of 524 unique genes nearest to open chromatin peaks and connected out to 8 other modules.
But how were chromatin and gene expression changed as a function of AD status? Highlighting not just the cellular basis of AD, but how it changes between disease stages, the researchers identified 15 co-accessibility modules that differed between healthy controls and early AD patients. These modules centered primarily around excitatory neuronal processes. In contrast, over 70 modulesdiffered between early and late AD, and these were dominated by glial processes.
Closing out the study, the researchers found a curious phenomenon: neuronal loss is a hallmark of AD, but their single nuclei transcriptomic data indicated no change in the relative proportion of neurons. In contrast, snATAC-seq showed the expected decrease in neuronal cells. To reconcile these findings, the group dove deeper into their snATAC-seq data and identified proportions of cells with weaker cell identity (termed “de-identified cells”). These de-identified cells were highly enriched in late AD versus early AD and controls, consistent with AD progression driving epigenomic erosion.
Building a cellular atlas of the brain in AD
AD, like all central nervous system disorders, is extraordinarily complex and heterogeneous. AD does not affect every cell type equally, nor does it affect every person equally. This raises two obvious questions: what cell type(s) are most (or least) affected by AD, and why are some individuals more (or less) susceptible to AD despite the presence of pathology in their brains?
To answer these questions, Mathys et al. (3) turned to single cell transcriptomics and characterized an astonishing 2.3 million single prefrontal cortical nuclei across 427 control and AD patients. They began by defining a transcriptomic signature of global AD pathology that was observed in three different subtypes of excitatory neurons.
Consistent with the epigenomic findings in the paper above, differentially expressed genes (DEGs) in these early stages of AD included—among other things—enrichment in chromatin organization. Late AD DEGs also painted a picture of what was going on in each cell type, with neuronal projection and synaptic signaling linked to neuronal subtypes, cholesterol metabolism in oligodendrocytes, and cell activation in microglia.
However, these changes were only descriptive of what was happening in cell types, so the authors sought to link these signatures associated to measures of cognition. They began by looking at DEGs correlated with cognitive impairment. While they found associated DEGs in each cell type with global cognitive function, genes associated with specific variables (such as episodic memory) overlapped the most in excitatory neurons, a subset of inhibitory neurons, astrocytes, and oligodendrocytes.
They next examined signatures of cognitive resilience, defined as patients who had had better (or worse) cognitive abilities than expected given the degree of neuropathology. Again, the importance of excitatory neurons was apparent: there were five genes differentially expressed in relation to one or more measures of cognitive resilience in eight different excitatory neuronal cell types.
Zooming out from transcripts to whole cells, the researchers next asked whether specific cell types may confer cognitive resilience. In contrast to the earlier involvement of excitatory neurons, they found that the relative proportion of inhibitory neurons was higher in those with high cognitive function, while a lowered abundance of these same neurons was associated with lower scores.
Further cementing the importance of these inhibitory neurons, the group demonstrated that increased abundance of these neurons was associated with a higher cognitive resilience to AD pathology ratio, and was seen in patients with high cognitive function despite extensive AD pathology in the brain. But what about some of the non-neuronal cell types implicated in AD?
Microglial dynamics and their role in driving AD
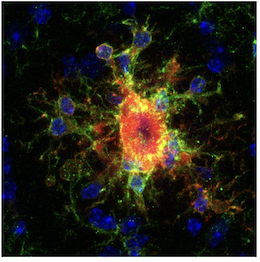
Inflammatory glia surrounding amyloid plaques were one of the first clinical observations in AD, and activated microglia are one of the major affected cell types in AD. In recent years, pro-inflammatory disease-associated microglia (DAM) have been characterized in AD using single cell transcriptomics, but not all inflammatory microglia are created equal. Using 194,000 microglial nuclei from 443 patients, Sun et al. (4) managed to characterize an astonishing twelve different microglial states in control and AD patients.
Breaking down these cell states further, they grouped cell types into homeostatic, inflammatory, and lipid-processing groups. Over 1,500 genes were differentially expressed in these groups, including genes that were specific to microglial state (e.g., homeostatic, inflammatory, etc.) and/or AD stage.
Leveraging the multiomic (i.e. snATAC-seq and snRNA-seq) data afforded them, the researchers characterized three patterns of chromatin accessibility (one homeostatic and two activated).
Using 25 different transcription factors (TFs) identified in this screen, Sun et al. performed overexpression analyses in microglia derived from human iPSCs and found that overexpression of homeostatic-associated TFs helped microglia retain a homeostatic-like phenotype. Additionally, overexpression of several of these TFs in the presence of a strong proinflammatory signal attenuated several markers of microglial inflammation, helping provide a molecular map of microglial dynamics in AD.
Looking forward with a multiomic roadmap of AD
Alzheimer’s disease is debilitating. It is complex. But it is by no means impossible to understand. The epigenomic and transcriptomic studies highlighted here gave researchers the ability to see the same cells from multiple angles, enabling insights that would have been an order of magnitude more difficult to make with either technology separately.
We thank the authors for this truly impressive body of work. These insights will help the rest of the field pave a path towards a more unified understanding of the molecular architecture of AD, and offer a blueprint to better understand other dementias as well.
Interested in how else our technologies can help give you a new view of AD and related dementias? Find out in our application notes, featuring single cell and spatial multiomics and single cell spatial imaging with Xenium In Situ.
References:
- Dileep V, et al. Neuronal DNA double-strand breaks lead to genome structural variations and 3D genome disruption in neurodegeneration. Cell 186: 4404–4421 (2023). doi: 10.1016/j.cell.2023.08.038
- Xiong X, et al. Epigenomic dissection of Alzheimer’s disease pinpoints causal variants and reveals epigenome erosion. Cell 186: 4422–4437 (2023). doi: 10.1016/j.cell.2023.08.040
- Mathys H, et al. Single-cell atlas reveals correlates of high cognitive function, dementia, and resilience to Alzheimer’s disease pathology. Cell 186: 4365–4385 (2023). doi: 10.1016/j.cell.2023.08.039
- Sun N, et al. Human microglial state dynamics in Alzheimer’s disease progression. Cell 186: 4386–4403 (2023). doi: 10.1016/j.cell.2023.08.037